
Abstract
BACKGROUND AND PURPOSE: Since the introduction of flat panel detector–equipped C-arms, the use of flat panel detector CT (FPCT) in the neuroradiologic angiography suite has become more frequent. This examination implicates its own specific radiation exposure. We used the CT dose index (CTDI) concept and adapted it to the special FPCT geometry to provide a consistent comparison with multisection head CT (cCT).
MATERIALS AND METHODS: Exposure data obtained for routine scanning during a period of 1 year were used to assess a specific dose of a total of 217 rotational scans performed in 105 patients. One hundred seventy-two scans were 3D digital subtraction angiography (DSA) scans. There were 45 scans that were performed to achieve high-quality, soft-tissue resolution. Dose measurements in cylindrical polymethylmethacrylate (PMMA) phantoms were used to determine the CTDI value and to compare it with the reference values for cCT. In addition, the dose-area product (DAP) was registered and correlated with the CTDI and corresponding dose-length product (DLP) values. Exposure data and dose values were compared with cCT.
RESULTS: Mean-weighted CTDI value of 3D-DSA was approximately 9 mGy per scan. High-quality, soft-tissue resolution FPCT scans, comparable with cCT, revealed a mean dose value of 75 mGy (reference value for cCT, CTDIw ∼ 60 mGy).
CONCLUSION: The high-speed scans used for 3D-DSA revealed a significantly lower CTDIw and DLP compared with clinical CT. The high-quality FPCT protocol resulted in a higher dose and should therefore be limited to acute cases, when patient transfer to a CT scanner is considered to be a disadvantage for patient management.
Flat panel detectors (FPD) mounted on dedicated gantry systems or interventional C-arms are currently used for CT scanning. These scanners are used for interventional radiology and angiography or image-guided radiation therapy units and offer large coverage of up to 200 mm.1-6 Volumetric imaging provided in the operating room has proved to be valuable for intraoperative procedures and is available for navigation and fusion with other preoperative or postoperative imaging modalities.6-8
Neuroradiology may benefit from the dual capabilities of such scanners.8-12 Conventional digital subtraction angiography (DSA) can be combined with rotational digital subtraction angiography (3D-DSA). Furthermore, rotational datasets can also be used to reconstruct native or contrast CT datasets of the brain and skull. The image quality of modern C-arm scanners has improved, especially with respect to low-contrast detectability.4-6 The first C-arms with use of CT functionality were equipped with image intensifier tubes and had their application, especially in the very-high-contrast angiographic imaging, working with contrast differences of more than 1000 HU. Current systems are equipped with FPDs and offer a significant improvement in low-contrast resolution. Contrast differences of down to 10 HU can be detected, which is a qualitative highlight.1,4 Imaging of cerebral bleeding, which was only detectable on conventional CT, now is possible within the angiography suite with use of FPCT. Nevertheless, low-contrast image quality is inferior compared with clinical CT.3,5,6 On the other hand, imaging of small, high-contrast targets, like intracranial microstents, seems to be superior compared with conventional multisection CT.9 Bone imaging with FPCT, a high-contrast target again, at least is equal to multisection CT, which is published for lumbar myelography and postmyelographic FPCT.10
The frequent use of FPCT is associated with an increase of radiation dose to the patient when FPCT is performed as an additional examination. It is not surprising that this concern has led to increased scrutiny with regard to the accuracy of radiation dose assessment to patients who undergo CT examinations. C-arm FPCT again has substantial changes in geometry, providing collimations by far higher than the 100-mm recommended integration length of the CT dose index (CTDI) standard.13-19 In addition, the systems use partial rotation scanning, which is expected to result in inhomogeneous dose distributions in the patient.6,20 It is also questionable if the common phantoms are sufficient for dosimetry with use of wide-beam fields.15,19 Although these scanners perform CT scanning, there is no consensus yet on estimating the patient dose for FPCT imaging. Because the systems emerged from radiography and angiography, many manufacturers provide the dose-area product (DAP) omitting any CT-specific terminology.21 Still, it is important for intermodality comparison reasons to adapt dose metrics used for FPCT to provide an accurate and flexible dose assessment.
In this study, we used the CTDI concepts as they are defined for standard CT and adapted them to the special C-arm geometry to provide a consistent comparison between clinical CT and C-arm CT. The exposure data are provided for routine scanning for 1 year with use of automatic exposure control for the acquisition of 105 patients with C-arm FPCT.
Materials and Methods
Equipment
For the investigations, an Axiom Artis dBA C-arm (Siemens Medical Solutions, Forchheim, Germany) with respective acquisition and reconstruction software (DynaCT; Siemens, Forchheim, Germany) was used (Fig 1A). The system is equipped with biplane imaging components, from which only 1 is used for CT imaging. The C-arm uses a 40-cm × 30-cm FPD that allows for the reconstruction of a nontruncated volume of approximately 22 cm (in-plane) and 16 cm (in z-direction). For larger objects, detruncation software is included by the manufacturer to correct for respective artifacts.2 The system uses an automatic exposure control (AEC), which modulates the exposure settings (exposure time, tube current, and tube voltage) with respect to the detector entrance dose (DED).2 The modulation method is attenuation based, and large differences are expected for different body regions or patient cross-sections. The user is allowed to set a respective DED to adjust the noise level. Besides this, there is no possibility for the user to interact with the AEC or the algorithm involved with the modulation. The AEC control at our system works according to a priority modulation. In a first step, the mAs level (tube current × exposure time per pulse) is changed; in a second step, with a lower priority, the tube voltage is adapted if the desired DED cannot be achieved with the mAs-modulation only.

Measurement (A) and dosimetry setup (B) including the C-arm system and the PMMA phantom in which the ionization chamber was placed. The PMMA phantom possessed 5 bore-holes for dosimeter placement in the central and peripheral regions.
In addition to the AEC, the system offers a DAP measurement chamber for on-line dosimetry (DIAMENTOR; PTW, Freiburg, Germany). The DAP chamber is mounted in front of the tube (behind the filter) and allows for a scan-specific measurement.
Dosimetry
We examined the exposure data of 105 patients with respect to the CTDI and its derivatives.13 The aim of the CTDI is to assess the integral over the dose profile along the z-direction (patient's longitudinal axis) for an infinite integration length  1) in the central and peripheral positions of a CTDI phantom, Cz being the collimated beam width as defined in Fig 2 and D(z) representing the dose profile along the z-direction. The problem we faced is that the standard dose chambers are limited to a length of 100 mm and measure the so-called CTDI100, which does not allow for an easy assessment of the integral over the complete dose profile. Following the annotations and geometry definitions of Figs 1B and 2, the maximal beam width (or collimation) Cz in the case of our C-arm CT scanner amounts to approximately 200 mm, for the center of rotation (COR) to focus distance RF = 785 mm, the COR to detector distance RD = 415 mm, and a detector z-extent of 300 mm, which are the standard settings for the given system.

Geometry definitions for the y/z plane COR is the center of rotation, Cz is the beam width at the COR (ie, collimation), and γ is the cone angle. RF is the distance from the focal spot to the COR, and RD is the distance from the detector to the COR.
In this case, the CTDI100 underestimates the ideal CTDI value, with an infinite integration range by more than 50% as shown in Boone.15 To handle this problem, we conducted the measurements with a 250-mm-long ionization chamber (iba Wellhöfer, Schwarzenbruck, Germany) to provide a better approximation of the value of CTDI, which ideally should be integrated over an infinite integration length. The values given below refer to the CTDI250 defined as  2)
2)
In the following case, we will omit the subscript 250 for simplicity. In addition, the phantom used in this study was not a typical 15-cm-long polymethylmethacrylate (PMMA) cylinder because we adapted the length to 300 mm also according to Boone.15 The diameter of the phantom was 160 mm to emulate the head region, and a 320-mm PMMA cylinder was used for the assessment of body dose according to the current CT dosimetry recommendations.13,16 Using peripheral and central measurements, we calculated the weighted CTDI with  3) where CTDIC is measured in the central hole, and CTDIP is the mean value over 4 peripheral measurements for a half-scan acquisition (Fig 1B). The CTDI values were normalized to 100 mAs.
The dose-length product (DLP) for the acquisitions was calculated with DLP = CTDIw × Cz because 1 rotation covers the complete head. The values of CTDIw and DLP were scaled by the mAs-values Qi, set by the AEC for each examination i to give the patient-specific value and CTDIi = (Qi/100 mAs) × CTDI and DLPi = (Qi/100 mAs) × DLP for patient i respectively. The value of the DAP was measured on-line by the system. It was examined with respect to its correlation to the CTDI measured in the phantom.
Measurement Protocols
For neuroradiologic applications, 2 protocols were used as set up by the manufacturer. A fast acquisition protocol with a single rotation time of 5 seconds was used for acquisition of 3D-DSA. This high-speed protocol acquires 2 subsequent series with 133 projections each over an angular rotation range of 200°. The high-speed protocol starts with a native mask acquisition run for subsequent subtraction, which is followed by a contrast-filled run. Contrast agent application (Iomeron 300; Bracco Altana Pharma, Germany) was done automatically with use of an appropriate injector (ProVis Mark V; Medrad, Warrendale, Pa), the contrast flow rate was in the range of 1.5 to 2.5 mL s −1, and injection time was 7 seconds (delay 2 s).
A high-quality acquisition protocol uses a 200° run for 20 seconds for the acquisition of 496 projections. The high-quality protocol was performed without contrast injection usually. The DED setting was routinely set to a value of 0.36 μGy/projection for the high-speed protocol and 1.2 μGy/projection for the high-quality protocol.
Patient Cases
A total of 217 rotational head scans were performed in 105 patients. The high-speed protocol was used with intra-arterial contrast injection for 172 of 217 rotational scans, which were 3D-DSA scans, respectively. Most of the 3D-DSA examinations (72 patients) were used to assess intracranial aneurysms, less frequent were the cases of patients with intracerebral arteriovenous malformations, arteriovenous fistula, intracranial stenoses, or acute cerebral artery occlusions, respectively.
There were 45 of the 217 scans that were performed with a high-quality acquisition protocol to achieve soft tissue (low-contrast) resolution datasets. All high-quality scans were carried out without additional contrast agent injection. The high-quality scans were performed in patients who experienced intracranial hemorrhage to exclude secondary bleeding; in most cases, patients had primarily ruptured intracranial aneurysms.11 Additional indications for high-quality scans were assessment of external ventricular drainage or exclusion of a primarily unnoticed bleeding during an intracranial intervention such as an arteriovenous malformation or vessel recanalization in patients with stroke.
All scans were uncollimated (full-field) head scans, in which some of the patients were scanned twice for preoperative and postoperative controls or in 3D-DSA when necessary. No special requirements were needed for this study because we collected the exposure data retrospectively.
In addition to the head scans, we included 7 exemplary spinal intervention scans (eg, myelography) to take body scans into account as well, though the use of C-arm CT for body scans is currently very limited.
Evaluation
The CTDI and the DLP were determined for voltages 70, 81, 90, 102, 109, and 125 kV, which are available to be set manually at the scanner. We applied a polynomial fit for the CTDI as a function of voltage to consider tube voltage values, which were set by the AEC and were not directly measured in the phantom. This approximation is well suited because a smooth function is expected.3
Patients were sorted according to the type of scan and the body region investigated. This arrangement resulted in 172 scans by use of the high-speed protocol and 45 scans by use of the high-quality protocols for head/brain studies. The CTDI and DLP values were calculated for each patient, and a histogram of both values with respect to all patient scans was generated.
Results
Assessment of the CTDI
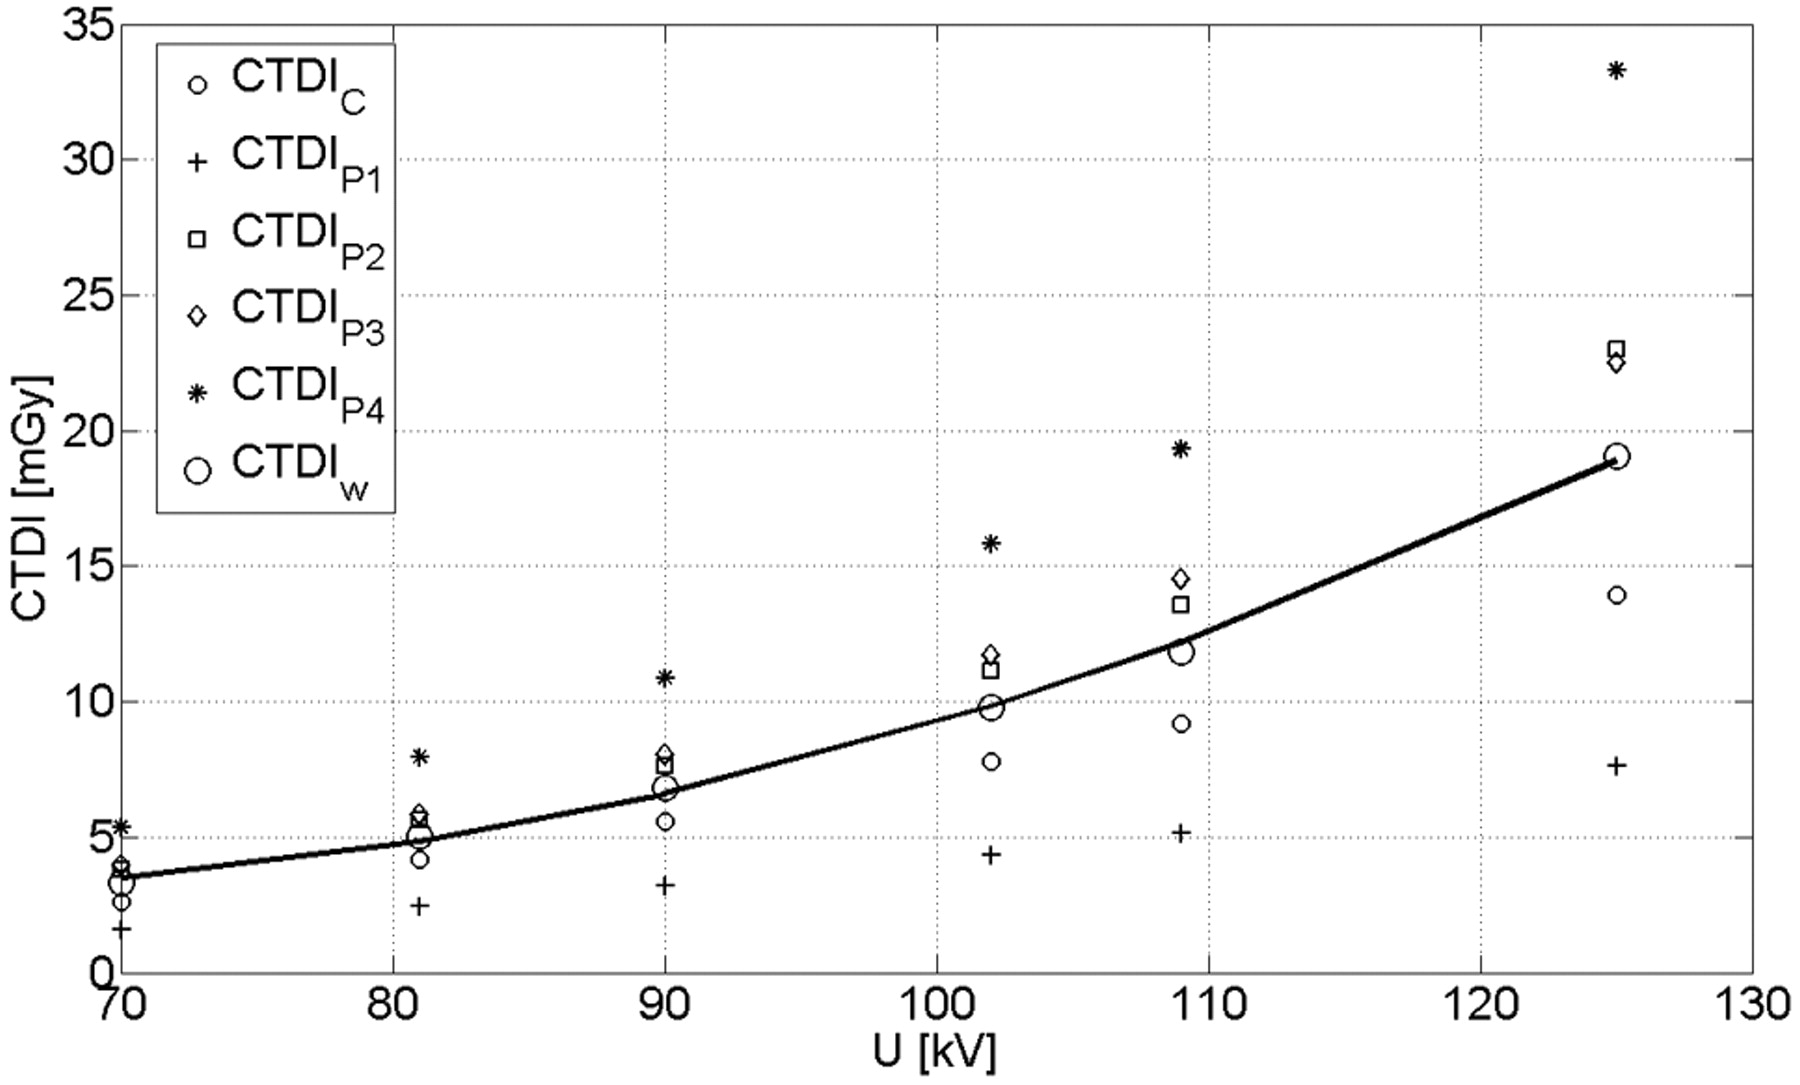
The CTDI measured as a function of tube voltage, which is shown in Fig 3 (normalized to 100 mAs). In addition, the plot shows the CTDI values for the center (CTDIc) and the 4 peripheral positions (CTDIp1, CTDIp2, CTDIp3, and CTDIp4). The separate CTDI values demonstrate the inhomogeneity of the dose distribution for the half-scan acquisition. Similar CTDI values are expected only for the positions p2 and p3, which are geometrically symmetric with respect to the trajectory of the tube. Position p4 results in the highest dose value because the tube traveled below the table in this specific case. The contrary holds for position p1; the difference in the CTDI compared with the lower position p2 amounted to a factor of 3.1 on average.

CTDI values for center, periphery, and the calculated CTDIw. The solid line represents a quadratic fit for the CTDIw which was used for subsequent calculations. The correlation coefficient amounted to R = 0.98.
The typical voltage for head/brain examination ranges between 70 kV and 80 kV which is in good agreement with the measured data and corresponds to CTDIw values between 3.7 and 5.2 mGy normalized to 100 mAs, respectively. The corresponding CTDIw value for a typical 80-kV CT scan with a clinical scanner amounts to 4.0 to 6.0 mGy.3 A quadratic fit approximates the dependence between CTDIw and tube voltage very well (correlation coefficient R = 0.98), in which the CTDIw reflects both the tube voltage and the mAs value of the examination. As mentioned previously, this step is necessary because the AEC controls both voltage and mAs values.
For the 320-mm PMMA cylinder (body phantom), only the values for 125 kV were measured because the AEC system adjusted the tube voltage for the patient spine scans to values of more than 122 kV. With the current protocol, a CTDI value of 8.6 mGy (normalized to 100 mAs) was measured for the body phantom. The value is comparable with CTDI measurements for clinical CT and is in agreement with exemplary values reported in Kalender's Computed Tomography3, which vary between 6 and 8 mGy for a 320-mm cylindrical PMMA phantom at 120 kV.
Scan-Specific Dose Values
The mean voltage for the high-speed scan with 0.36 μGy/pulse detector entrance dose was held constant at 70 kV. Only the mAs value was modulated with each patient with use of a mean value of 259 ± 46 mAs (mean ± SD). The high-dose/high-image quality protocol resulted in a mean tube voltage of 79 ± 3.2 kV and used a mean value of 1592 ± 54 mAs per rotation (ie, per scan). As expected, the exposure setting remained fairly constant because the interpatient differences in attenuation are small for head examinations.
Figure 4 shows a histogram of the CTDIw, DLP, and DAP values for all scans regarding the high-speed protocol. As already mentioned, the DAP values were measured on-line by the scanner. The CTDIw values were 9.3 ± 1.6 mGy (mean ± SD), and the DLP amounted to 186.6 ± 33.1 mGy × cm. The measured DAP was distributed approximately 1026 μGy × m2, with an SD of 192 μGy × m2 calculated for the 172 scans. The SD of the values showed a relatively low interpatient variation as expected (<20%). The correlation of the measured DAP and the estimated CTDIw was very good (R = 0.953) as shown in Fig 4D.

Dose values for 172 patient scans regarding the high-speed (HS) protocol. A, B, and C show the histogram of the number of patient scans regarding the CTDIw, DLP, and DAP. The distributions are similar for the 3 dose measurement techniques. The DAP measured on-line shows a good linear correlation to the estimated CTDIw value (D). Note: The red lines and red dotted lines indicate the mean value and SD.
Similar to the results shown in Fig 4, Fig 5 presents the CTDIw, DLP, and DAP values for the high-dose/high-quality scan. The CTDIw value was 75.1 ± 5.2 mGy, and the DLP amounted to 1506.1 ± 112.7 mGy × cm. The measured DAP resulted in 7377.4 ± 291.9 μGy × m2 per rotation. Again the correlation between the CTDIw and the DAP is very good (R = 0.953).

Dose values for 45 patient scans with use of the high-quality protocol. A, B, and C show the histogram of patient scans with respect to the CTDI, DLP, and DAP. The distributions are similar for the 3 dose measurement techniques. The DAP measured on-line shows a good linear correlation to the estimated CTDIw value (D). Note: The red lines and red dotted lines indicate the mean value and SD.
For the 7 spine scans, the average CTDIw amounted to 85.1 ± 1.1 mGy per scan over all spine scans at tube voltage settings varying between 122 and 125 kV.
Protocol Comparison
The dose assessment revealed a dose discrepancy between the high-speed and high-quality protocols by a factor 6.0 to 8.0 on average. However, only 45 scans of 217 were performed in the high-dose mode, and the higher-dose levels were only used selectively when special indications were given as mentioned in the Patient Cases section. The spectrum of special indications for high-quality protocols included, for example, patients with subarachnoid hemorrhage, when rebleeding before or after an aneurysm-coiling procedure had to be ruled out. The high-quality protocol was used to assess intracerebral hemorrhage (eg, in patients who underwent intra-arterial thrombolysis) as well. Recapitulatory, the assessment of low-contrast difference targets like blood was seen as an indication for the high-quality protocol.
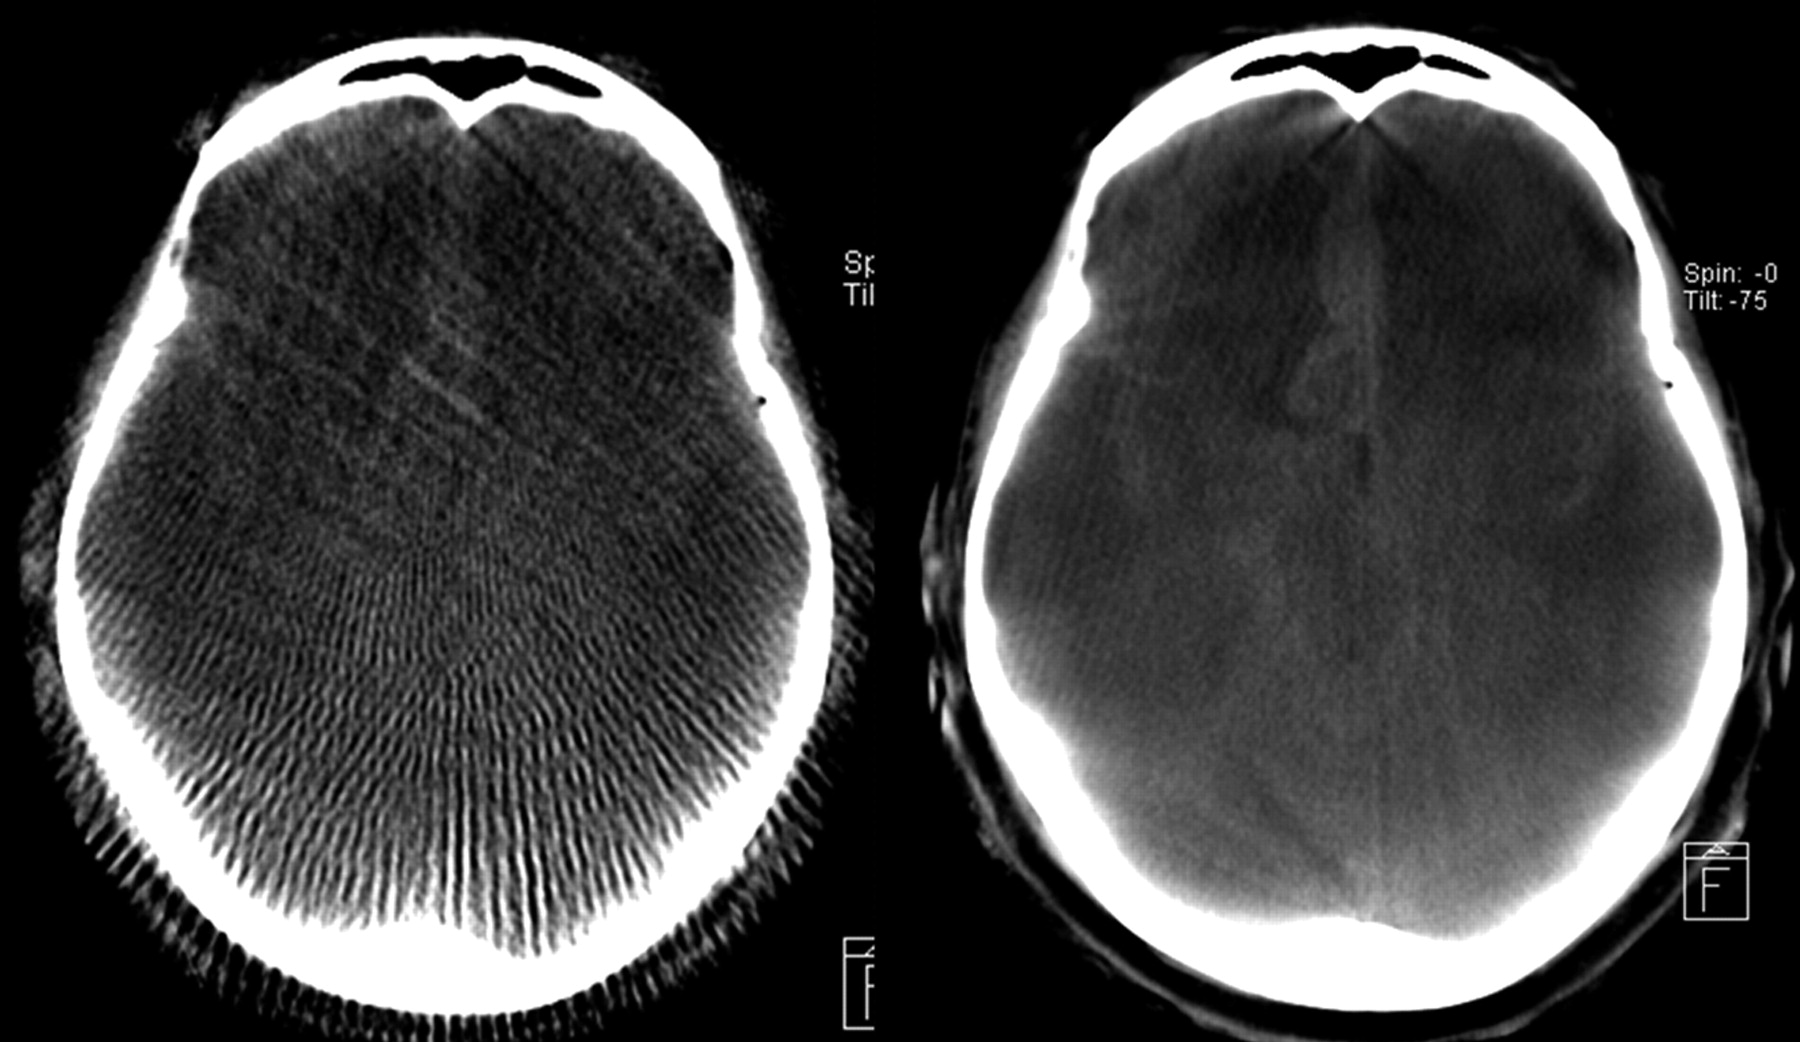
Figure 6 shows respective images resulting from a high-speed and a high-quality scan for the same patient and section, in which the high-quality protocol shows superior image quality. As expected from the dosimetric results, the noise in the high-quality image seems to be much lower compared with the high-speed scan. The sampling artifacts originating from the small number of projections in high speed are quite distinct, and in high-speed protocols low tissue resolution is nearly nonexistent. Hence, in the high-speed protocol, typically it is not possible to detect intracranial hemorrhage.

Qualitative comparison of an HS reconstruction (left side) and HQ (right side) for the same patient and section with respect to diagnostic image quality. Because of the superior image quality, the subarachnoid bleeding can be clearly diagnosed on the HQ image. The HS image seems to be only adequate for a rough anatomic orientation.
Discussion
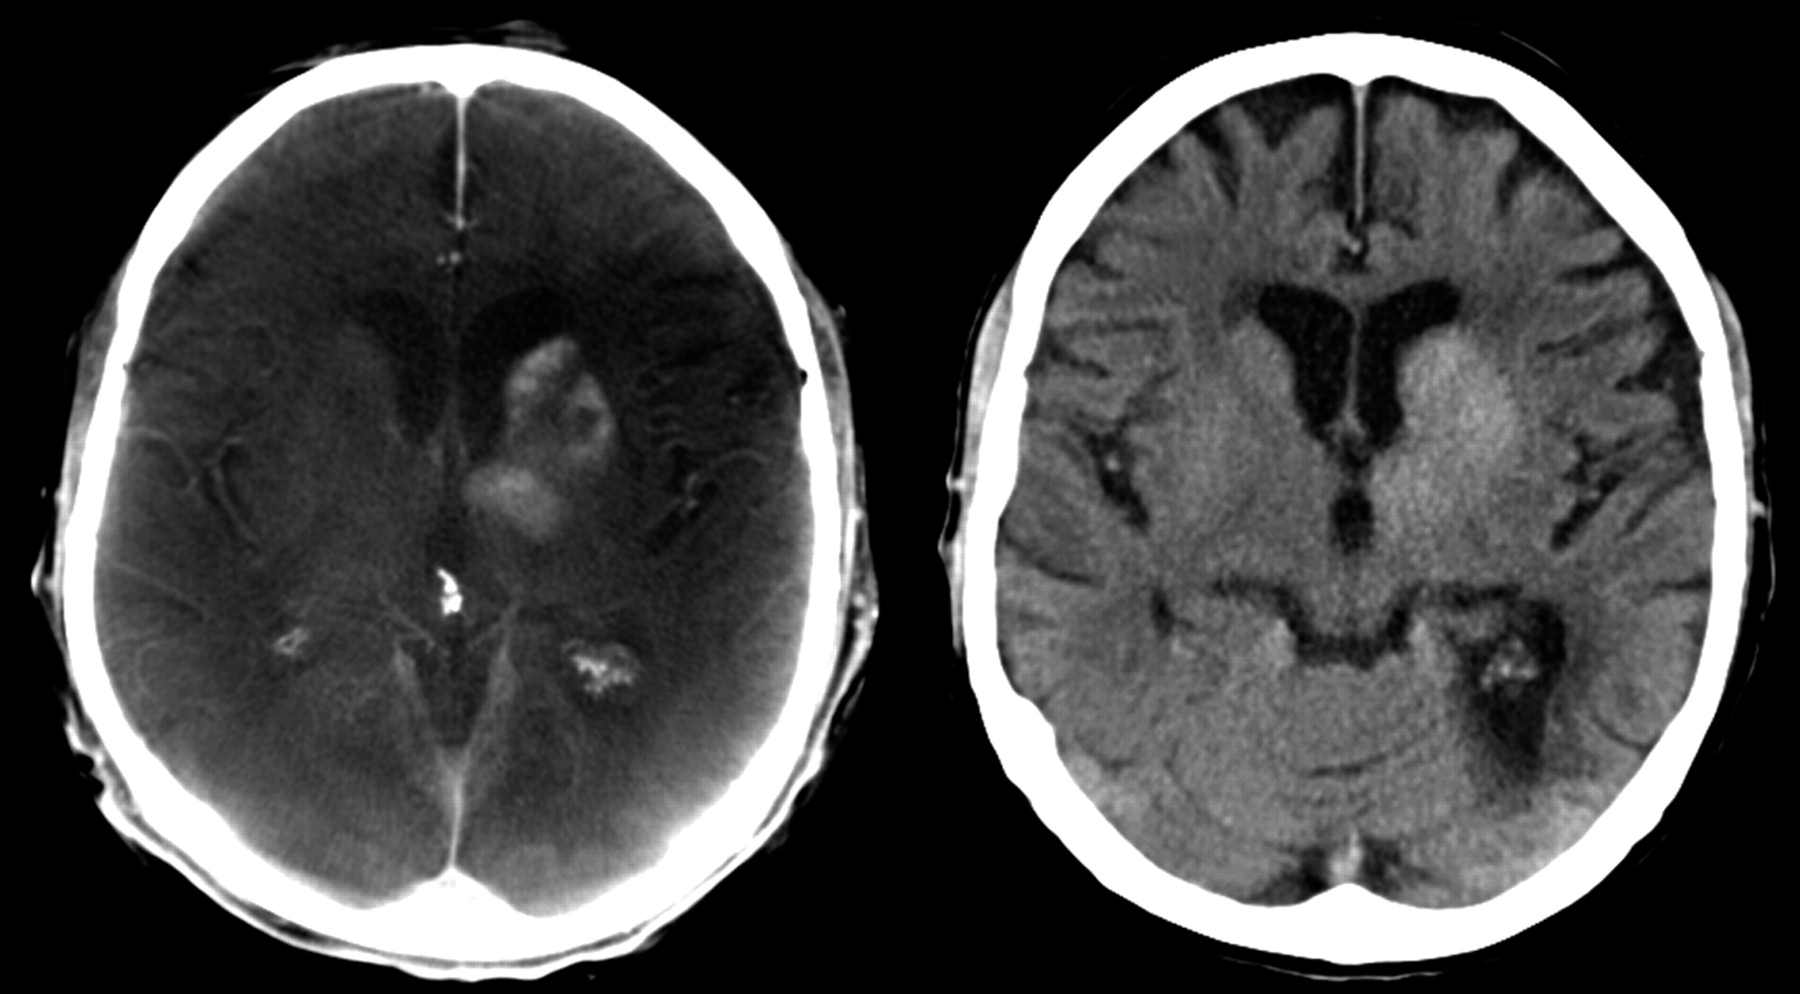
FPCT is increasingly used in the angiography suite; therefore, patient dose concerns come to the forefront. Because the method is relatively new, the adaptation of interventional radiology to CT with respect to dose considerations is not finalized. C-arm CT provides enhanced, 3D anatomic information that may result in, for example, better guidance and navigation during interventional procedures. Even low-contrast intracranial hemorrhage can be diagnosed, though contrast resolution seems to be inferior compared with cCT (Fig 7).

Mechanical thrombolysis of a carotid-T-occlusion. The reperfusion resulted in enhancement of contrast agent in the basal ganglia, which was injected during mechanical recanalization. High-quality scan (left side) was performed to exclude hemorrhage. This finding was confirmed on follow-up cCT, which was performed the next day (right side).
In this study, we combined technical dose measurements with a respective assessment of the exposure data during daily routine without changing the medical workflow. State-of-the art systems were used along with the current standards in CT dosimetry. The CT dosimetry measures were correlated to the standard radiographic dose metric DAP, which is currently measured on-line for each investigation on fluoroscopic or radiographic systems. The combination of on-line DAP measurement and CTDI calibration seems to provide appropriate means for comparing modalities and providing on-line estimates of patient dose during intervention. A combination with respective conversion factors would, in addition, provide real-time estimates of effective dose18,20 according to the standards currently used for conventional CT. Other authors such as Schueler et al21 also investigated the radiation dose with respect to 3D rotational cerebral angiography (3DRA) and recorded mainly the skin dose and the cumulative incident dose for 3DRA scans (eg, 33 mGy for their standard 3DRA acquisition mode) by using the DAP to compare with bi-planar DSA. Although it is possible to calculate the cumulative incident dose values for our scans (eg, 38.1 mGy for the standard high-speed scans at the interventional reference point21), we cannot use the data for a detailed comparison because several geometric parameters (field size, bow–tie filter etc) as well as the exposure data are different and some are not available in Schueler et al.21 We agree with the authors that for 3DRA or, in general, 3D acquisitions with C-arms, the x-ray field area can extend beyond the edges of the skull. As a result, the total DAP for a complete 3D acquisition could overestimate the patient area exposed and thus overestimate the stochastic risk, which seems to be the reason for some outliers in Figs 4D and 5D. Nevertheless, we showed here, with respect to the connection of both fluoroscopic and CT imaging, high correlation between the CTDI and the DAP; an efficient calibration method as well as calculation of correction factors with respect to error sources21 will be part of future work.
A minor drawback of this study may be the use of the CTDI; this holds both for the case of conventional cCT and FPCT dosimetry, as the efficiency of the index itself is currently under discussion.13-19 Although the current CTDI standard can be used as a consistent comparison measure for the validation, it is not considered as a tool for accurate patient dosimetry. For example, use of Monte Carlo tools (ImpactMC; VAMP, Erlangen, Germany) for the simulation of dose allows demonstrating the inhomogeneity of the dose distribution for partial scans of 200° for both head and pelvis scans (Fig 8A and B). Thus, in addition to the CTDI concepts, which are based on simple cylindrical phantoms, 3D dose distributions obtained either by simulation or by measurement can provide a more accurate look at the patient-specific distribution of dose (eg, for noncylindrical and anthropomorphic phantoms). In the latter case, 3D dose distributions can be used to estimate further parameters such as organ dose and effective dose, which are more appropriate for the quantification of patient dose.

Example of 3D dose distributions calculated by Monte Carlo simulations for 2 phantom planes (axial and coronal) with use of an anthropomorphic phantom for a 200° C-arm FPCT scan in relative units representing head and pelvis scans. The axial section nicely demonstrates the inhomogeneity of the dose distribution for a partial scan.
The evaluation shows that the herein used routine measurement protocols are quite different with respect to dose and image quality. Dose varied over a factor of 6.0 to 8.0 on average between 2 specialized protocols. As the expected noise level will be a factor √6.0 to √8.0 smaller, it can be expected that the high-dose protocol will provide the overall better image quality, both for intervention and sometimes to even fulfill diagnostic-CT criteria.2,6,12 The high-speed mode shows a CTDIw of approximately 9 mGy (DLP ≈ 180 mGy × cm), whereas the high-quality resulted in a mean CTDIw ≈ 75 mGy (DLP ≈ 1500 mGy × cm). For comparison, we extracted the reference dose values for clinical CT from the German Federal Office for Radiation Protection (BfS) report.22 For head CT, the reference CTDIw for routine investigations amounts to 60 mGy, whereas the DLP is given with 1050 mGy × cm. For the investigated cases on the C-arm scanner, a full-field acquisition was assumed (which is routinely used), whereas the reference values for DLP were gathered according to the specific protocols of the users, which may amount to scan lengths clearly below 20 cm for head scans. Typical CT acquisition lengths for the head can vary depending on the medical indication. The recommendations of the BfS are based on long-term studies monitoring the routine CT use for the specific application.22
The high-speed scan, which is the most common among the C-arm CT applications, resulted in a clearly lower CTDIw and DLP compared with clinical CT. The high-quality C-arm protocol resulted in a higher dose and should therefore be limited to special and acute cases when very good image quality comparable with standard head CT is needed.
The use of C-arm CT can be compared with standard CT in exposure and can vary from very low to high dose depending on the protocols used and cannot be ignored. Of course, this dose application has to be regarded with respect to the total exposure during intervention in which additional fluoroscopy or DSA scans (2D) are often necessary. C-arm CT combined with suitable software (eg, navigation) may support the clinical workflow and can result in a lower dose by simply reducing the overall exposure time.6 In addition, CT-guided interventions have the potential to minimize the additional fluoroscopic time in the operating room needed for control scans and, perhaps, also additional postoperative CT scans. Additional developments regarding the improvement of image quality for these systems will potentially result in a dose reduction for the same image quality.2-6 The use of thin-collimated scans or advanced methods such as multi-resolution local tomography could also help to maintain image quality in a volume of interest while reducing patient dose.3,6 Furthermore, more sophisticated AEC methods as well as spectral optimization (eg, tube filtration) combined with improved reconstruction algorithms could lead to additional improvements.6
Nevertheless, the applied dose is an important issue and has to be further investigated compared with standard CT and certainly as compared with the complete interventional procedure circle, including fluoroscopy and DSA. Also of interest and the subject of additional investigations is the exposure of medical personnel from CT in the angiography suite. Common dose metrics or calibration methods combining CT-like metrics such as the CTDI and radiography metrics such as the DAP would be helpful with respect to a comparison of modalities and applications. In addition, more studies should not only look at the dose but also carefully evaluate the achieved image quality and the impact of specific dose reduction steps.
Conclusion
The high-speed scans used for 3D-DSA revealed a significantly lower CTDIw and DLP compared with clinical CT. The high-quality FPCT protocol resulted in a higher dose and should therefore be limited to acute cases, when patient transfer to CT scanner is considered to be of disadvantage for patient management.
References
- Received March 28, 2008.
- Accepted after revision June 10, 2008.
- Copyright © American Society of Neuroradiology
In this issue


Jump to section
Related Articles
Cited By...
- Brain Radiation Doses to Patients in an Interventional Neuroradiology Laboratory
- Initial experience with a combined multidetector CT and biplane digital subtraction angiography suite with a single interactive table for the diagnosis and treatment of neurovascular disease
- Angiographic CT with Intravenous Contrast Injection Compared with Conventional Rotational Angiography in the Diagnostic Work-Up of Cerebral Aneurysms
- Feasibility of Flat Panel Angiographic CT after Intravenous Contrast Agent Application in the Postoperative Evaluation of Patients with Clipped Aneurysms
- Angiographic CT after Intravenous Contrast Agent Application: A Noninvasive Follow-Up Tool after Intracranial Angioplasty and Stenting
- Feasibility of Angiographic CT in Peri-Interventional Diagnostic Imaging: A Comparative Study with Multidetector CT
- Overlying Fluoroscopy and Preacquired CT Angiography for Road-Mapping in Cerebral Angiography
- Pre-Procedural Imaging of Aortic Root Orientation and Dimensions: Comparison Between X-Ray Angiographic Planar Imaging and 3-Dimensional Multidetector Row Computed Tomography