
Abstract
BACKGROUND AND PURPOSE: 3D-CT angiography (3D-CTA), a vessel-cast technique, is useful in the diagnosis of patients with brain lesions and cerebrovascular disease. However, it provides no information on blood-flow dynamics. Therefore, we developed a new technique, dynamic 3D-CTA (d3D-CTA), that yields 3D images of the vasculature and allows assessment of the hemodynamics and of the cerebral perfusion.
METHODS: We subjected 12 patients to d3D-CTA; 7 had brain tumors, 4 had arteriovenous malformations (AVMs), and 1 presented with cervical internal carotid artery occlusion. d3D-CTA was performed with a multidetector-row CT scanner with 64 detectors; the parameters were 0.5-mm section thickness, 0.5 seconds per rotation, 135 kV, and 150 mA. Contrast medium (total volume, 30–35 mL) was injected at 6–7 mL/s; scanning was started after a 5-second delay. Scans were generated with volume-rendering reconstruction and displayed in cine mode.
RESULTS: We succeeded in obtaining d3D-CTA scans in all cases. The scans yielded 3D information on the vascular structures and hemodynamics and on the status of the cerebral perfusion.
CONCLUSION: d3D-CTA facilitates the acquisition of information on the vascular and cerebral dynamic blood flow on 3D-CTA images. Despite the relatively high radiation exposure and contrast injection speed and its limited scan range, this technique is useful for the diagnosis of patients with brain tumors or cerebrovascular disease and for treatment planning.
3D-CT angiography (3D-CTA) is useful for the evaluation of intracranial lesions such as cerebral aneurysms, vascular malformations, occlusive disease, and brain tumors.1–11 Although it provides 3D anatomic information on vascular structures that is useful for diagnosis and surgical strategy planning, it does not allow visualization of the hemodynamic status of intracranial vessels.
Because conventional catheter angiography (CCA) is the only technique currently available for assessing their hemodynamic status, patients with intracranial lesions routinely undergo CCA assessment. However, CCA is invasive and associated with morbidity and mortality. Silent embolisms occurred in approximately 30% of patients undergoing diagnostic cerebral angiography,12,13 and there is a 0.7% risk of stroke14 in patients subjected to these procedures.
Dynamic MR digital subtraction angiography (MR-DSA) is a new diagnostic tool to assess the hemodynamics in patients with arteriovenous malformations (AVMs).15–18 However, its limitations are inadequate spatial resolution, narrow section thickness, and poor temporal resolution. Furthermore, because MR-DSA does not yield 3D images, it is not appropriate for surgical planning.
The development of multidetector row CT (MDCT) scanners allows the acquisition of dynamic scans with a wider scan range and faster acquisition time.19–22 Using these features, we developed a novel technique, dynamic 3D-CT angiography (d3D-CTA), to demonstrate intracranial hemodynamics.
Materials and Methods
We subjected 12 patients to d3D-CTA. They were 9 women and 3 men ranging in age from 17 to 75 years (mean, 52.8 years); 7 had brain tumors, 4 had AVMs, and 1 patient presented with cervical internal carotid artery (ICA) occlusion (Table 1). Prior informed consent was obtained from all patients; the local medical ethics committee approved the study protocol.
Clinical information on 12 patients with brain lesions
A MDCT scanner with 64 detectors (Aquilion; Toshiba Medical Systems, Tokyo, Japan) and a tiltable gantry were used. After obtaining a scout view to determine the d3D-CTA scan range, an 18-gauge plastic intravenous catheter was placed in the antecubital vein; the line was connected to a dual-head power injector (Nemoto Kyorindo, Tokyo, Japan) via a catheter (MEDITOP, Tokyo, Japan). Dynamic scanning was started 5 seconds after the injection of nonionic contrast material (Iopamiron 370; Schering, Osaka, Japan). In 11 patients, the contrast medium (total volume, 30 mL) was injected over the course of 5 seconds at a rate of 6 mL/s; this was followed by a chaser bolus of 18 mL saline (6 mL/s). The other patient (case 5), whose body weight exceeded 75 kg, was contrast-injected at 7 mL/s (total volume, 35 mL) over the course of 5 seconds, and this was followed by a chaser bolus of 21 mL saline (7 mL/s). To prevent catheter rupture, we used a pressure monitor on the dual-head power injector; the upper limit for the injection pressure was set at 10 kg/cm2. The scan parameters were 135 kV/150 mA, 0.5 seconds per rotation for 40 rotations, 512 × 512 matrix, 64 sections of 0.5-mm section thickness, and scan range of 32 mm.
Because the original images acquired by dynamic CT scanning were arranged sequentially at each detector, they were rearranged at each time phase. The acquired data were reconstructed at 0.3-mm intervals and transferred to a workstation networked to the MDCT scanner. We generated 3D-CTA using 2500–3000 original images obtained at 0.5-second intervals. 3D-CTA scans were generated by a volume-rendering method, and the serial images were displayed in cine mode.
For reconstruction in some cases, we used a subtraction method to remove bone images without deleting vascular structures. First, primary 3D-CTA images consisting of all pixels between −500 and 4000 Hounsfield units (HU) were created. Then, the threshold for secondary bone images was carefully chosen on the primary 3D-CTA images by a neurosurgeon who confirmed that the new bone images did not include any vascular structures. The threshold for the secondary bone images was 267–423 HU. The thickness of the bone images was then increased by 8 pixel layers using the “dilate” function on the workstation. The “dilate” function adds a specified number of pixel layers from the original data to the image. The dilated bone image (mask) was then subtracted from the original 3D-CTA scan.
In case 12, we generated cerebral perfusion maps. Using 8 original 0.5-mm thick sections, we produced 4-mm thick axial images. From these data, we reconstructed a series of images with a time interval of 0.5 seconds; 40 images were obtained. To acquire cerebral perfusion data, we used Perfusion CT Software (ZIO software, Tokyo, Japan); it facilitates calculation of the cerebral blood flow (CBF), cerebral blood volume (CBV), and mean transit time (MTT) maps.
Results
In all 12 cases, we succeeded in obtaining d3D-CTA scans. There were no adverse events; although the patients reported experiencing a warming sensation throughout the body. All d3D-CTA scans could be displayed on cine movies.
The dynamic blood flow to all 7 tumors and the surrounding normal vessels was demonstrated by d3D-CTA. In the 4 patients with AVMs, we were able to obtain serial images that demonstrated passage of the contrast material through the AVM and the surrounding normal vessels. Feeders, nidi, and drainers within the scanned range were identified separately, and early venous filling in the arterial phase could be observed. In case 12, we generated perfusion maps; approximately 10 minutes were required for the development of d3D-CTA scans and perfusion maps.
Representative cases are illustrated in Figs 1–3.

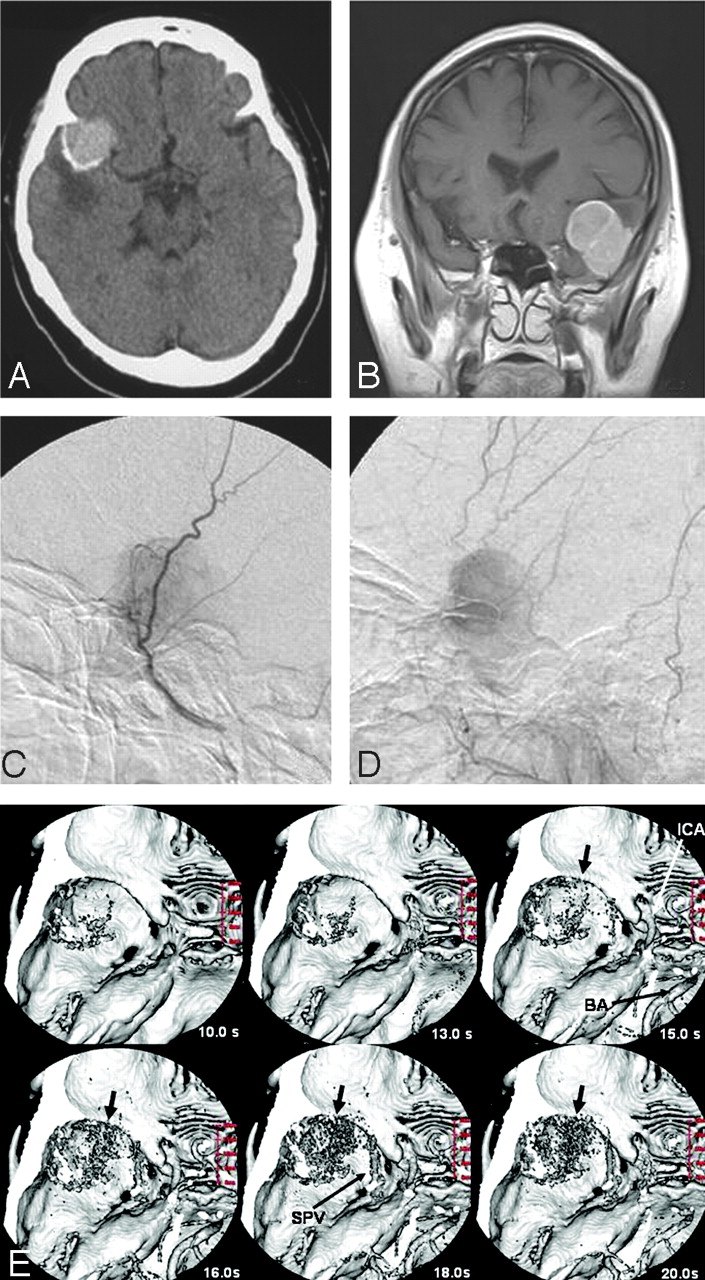
A 52-year-old woman with a sphenoid ridge meningioma (case 3). A, Plain CT shows a mass with calcification in the left frontotemporal region.
B, Coronal contrast-enhanced T1-weighted image reveals a homogenous enhanced mass in the left middle fossa.
C and D, A left external carotid artery angiogram, lateral views of the early (C) and late (D) phase, reveals a tumor stain fed by the middle meningeal artery.
E, d3D-CTA (superior view). d3D-CT angiographs obtained at 10, 13, 15, 16, 18, and 20 seconds after contrast injection are shown. The tumor stain is first demonstrated in the arterial phase (at 15 seconds). d3D-CTA indicates that the blood supply to the tumor is from the sphenoid ridge. Calcifications within the tumor are shown at 10 seconds. ICA, left internal carotid artery; BA, basilar artery; SPV, sphenoparietal vein.
Case Illustration
Case 3.
Fig 1 shows a 52-year-old woman with sphenoid meningioma who suffered a partial complex seizure. Because d3D-CTA demonstrated that the tumor supply derived from the sphenoid ridge, we first devascularized the tumor at its site of attachment. This facilitated its removal without bleeding. Intraoperative findings confirmed that the tumor attachment we devascularized was that portion of the tumor image in which staining was first seen on the d3D-CTA scan.
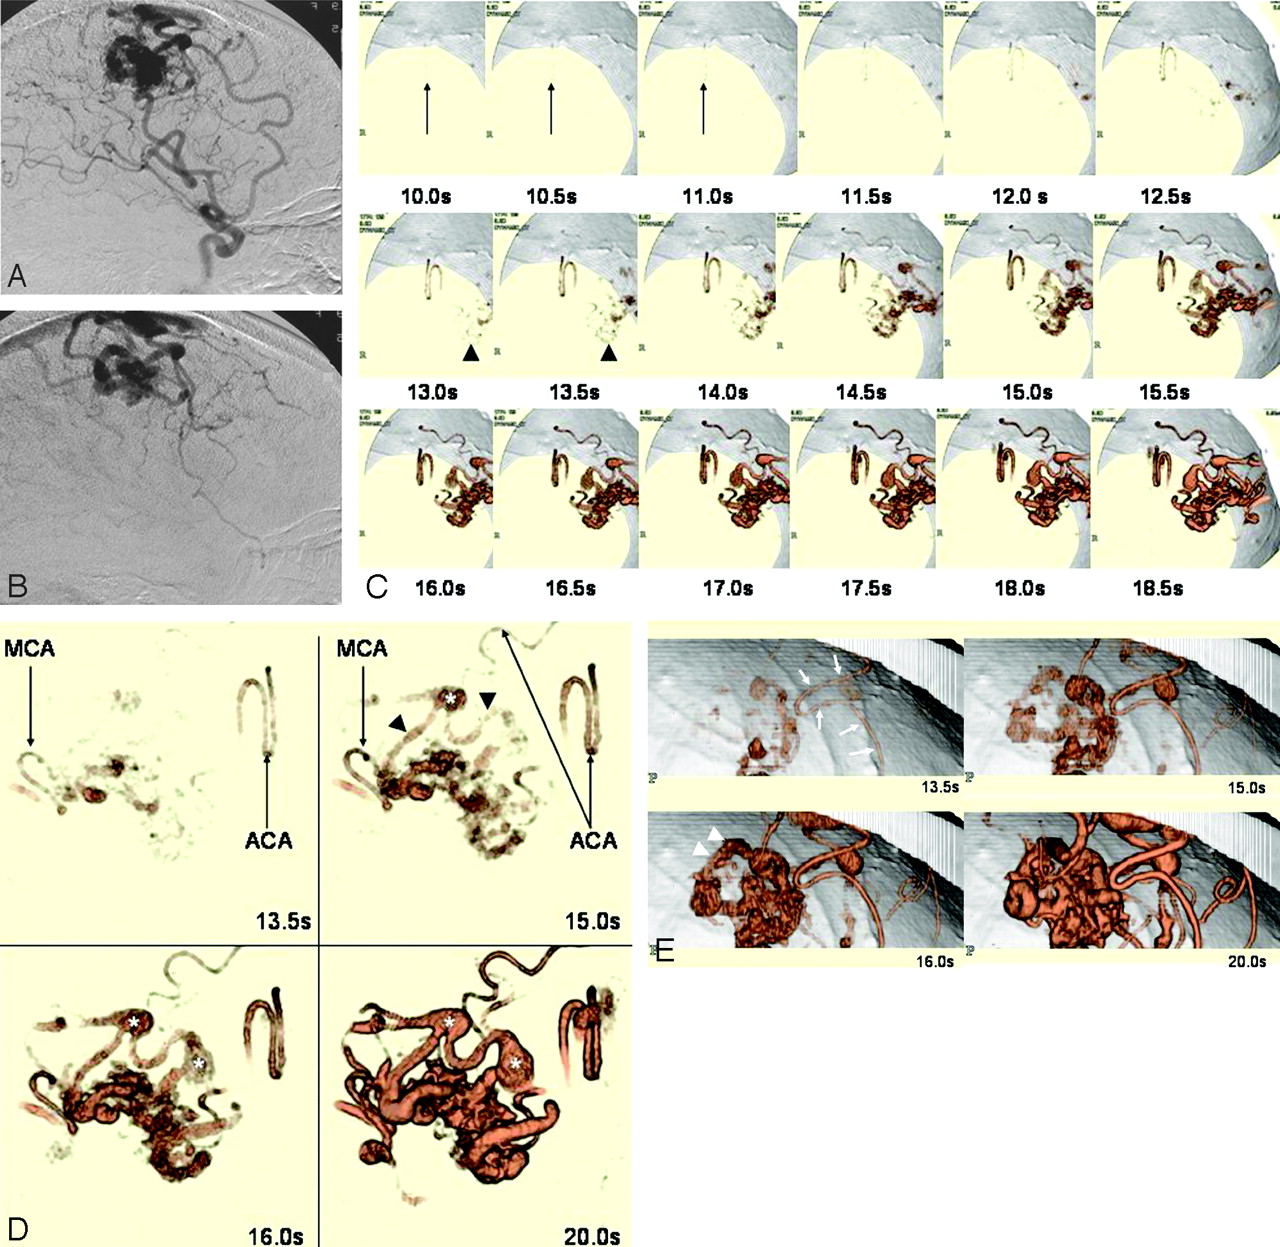
Case 8.
Fig 2 shows a 61-year-old woman with a frontal AVM who suffered a generalized tonic seizure. d3D-CTA demonstrated the hemodynamics of the AVM (eg, early filling of the nidus and drainer) and the angioarchitecture of the AVM.

A 61-year-old woman with an arteriovenous malformation (AVM) in the left frontal lobe (case 8). A and B, Left internal carotid artery angiogram, lateral views of the arterial (A) and venous (B) phase, reveals an AVM fed by branches of the anterior and middle cerebral arteries; drainage is into the frontal ascending vein.
C, d3D-CTA (inferior view) obtained at 0.5-second intervals after contrast injection. The anterior cerebral artery (feeder, arrow) is demonstrated at 10 seconds; the frontal ascending vein (drainer, arrowhead) is shown in the early arterial phase (at 13 and 13.5 seconds). The d3D-CTA scans demonstrate the hemodynamics of the AVM.
D, d3D-CTA (superior view) obtained at 13.5, 15, 16, and 20 seconds after contrast injection. The feeding arteries, nidus, and drainer are visualized in the arterial phase (at 13.5 and 15 seconds). MCA, branch of the middle cerebral artery; ACA, branches of the anterior cerebral artery; *, varices.
E, d3D-CTA (left lateral view) obtained at 13.5, 15, 16, and 20 seconds after contrast injection. In the early arterial phase (at 13.5 seconds) the feeder, a branch of the anterior cerebral artery (arrow), and the nidus are demonstrated. The arterial phase (at 16 seconds) revealed a drainer (arrowheads), indicating that there is an arteriovenous shunt. d3D-CTA provided information on the hemodynamics and the 3D vascular structures of the AVM.
Case 12.
Fig 3 shows a 75-year-old woman with cervical ICA occlusion who was admitted with vertigo. d3D-CTA revealed a 0.5- and 1.0-second filling delay in the right middle cerebral artery (MCA) whose caliber was smaller than that of the left MCA. Functional maps of CBF, CBV, and MTT showed no difference between the right and left cerebral hemispheres.

A 75-year-old woman with occlusion of the right cervical internal carotid artery (case 12). A, Cervical 3D-CTA showing occlusion of the right internal carotid artery (arrow). Right lateral (left) and left lateral (right) views of the right cervical vessels are shown. CCA, common carotid artery.
B, d3D-CTA (anterosuperior view). 3D-CTA scans were obtained at 12, 12.5, 13, 13.5, 14, and 14.5 seconds after contrast injection. The right middle cerebral artery (MCA, arrowheads) is visualized later (at 13 or 13.5 seconds) than the left MCA (arrows), which appeared at 12.5 seconds. d3D-CTA demonstrates the right MCA with a 0.5- and 1-second filling delay compared with the left MCA. The smaller caliber of the right compared with the left MCA indicates that the blood flow volume in the right MCA is smaller than in the left MCA. Cal, calcification.
C, Functional maps of cerebral blood flow (CBF), cerebral blood volume (CBV), and mean transit time (MTT) produced from d3D-CTA data. The maps showed no significant difference between the 2 hemispheres.
Discussion
Because of their high speed and isotropic resolution of thin sections, MDCT scanners offer unique advantages over single-detector-row CT instruments.19–22 Moreover, MDCT scanners permit the acquisition of thin sections with isotropic voxel sizes. Whereas 3D-CTA using MDCT scanners provides excellent 3D images of vascular structures, it is essentially a vessel-cast technique that yields no significant hemodynamic information. We demonstrated previously our arterial- and venous-phase 3D-CTA technique that employs a MDCT instrument23; however, it remained difficult to evaluate the dynamic blood flow. Our new method makes it possible to visualize the dynamic CBF on 3D-CTA and allows the use of 4- to 16-detector row instruments to produce d3D-CTA images, though because of their small scan range, the images are not assessable. Use of a 64-detector row MDCT facilitates the development of d3D-CTA images with a relatively wide scan range.
In patients with intracranial tumors, CCA is used to gain insights into the dynamic blood flow in the tumor mass and the anatomic vascular structures of tissues surrounding the tumor. Precise information regarding the anatomic relationship between the tumor and surrounding normal vessels is extremely important for surgical planning. Although 3D-CTA is informative with respect to tumor location, shape, and vascularity, it yields no insights into the hemodynamics within the tumor. In our case 12, d3D-CTA demonstrated that portion of the tumor attachment where it was necessary to interrupt the blood supply in the initial stage of the operation; this rendered the operation safer and the operation time shorter. The dynamic pattern of the tumor stain revealed by d3D-CTA may also contribute to a differential diagnosis and d3D-CTA may demonstrate arteriovenous shunts that are usually a characteristic of malignant tumors.
CCA has been an essential diagnostic tool in patients with AVM. d3D-CTA demonstrates the characteristic hemodynamics of the AVM; as feeding arteries, nidi, and drainers are visualized in the arterial phase, it allows their individual identification. Although the hemodynamic information depicted on d3D-CTA scans is similar to that provided by CCA, d3D-CTA scans can be viewed from different angles and simulate surgical views. This enhances the preoperative assessment of the anatomic relationships of the AVM. For detailed evaluation, any phase in d3D-CTA can be selected separately. The images of maximum intensity projection (MIP) or multiplanar reconstruction (MPR) variable-thickness sections are useful for detailed analysis. Because d3D-CTA can also be used for follow-up assessment to confirm the complete obliteration of AVMs after radiation therapy, its use decreases the number of necessary follow-up CCA studies.
In patients with cervical ICA occlusion, d3D-CTA demonstrates the direction of the flow from the anterior communicating artery to the MCA. In our patient (case 12), it showed a 0.5- and 1.0-second filling delay in the right MCA compared with the left MCA, respectively, indicating a circulation delay on the right side. However, the MTT map did not depict any significant difference between the cerebral hemispheres, possibly because there was sufficient collateral blood flow to the right hemisphere. Functional maps may fail to demonstrate very small delays.
Dynamic MR-DSA and CCA can be used for the dynamic assessment of the intracranial circulation. However, MR-DSA has some limitations; inadequate spatial and temporal resolution and the section thickness of 10–20 mm hamper the visualization of lesions with complicated vascular structures such as AVMs with overlapping vessels. In addition, more than 20 minutes are required to generate a single series of MR-DSA images. Furthermore, because MR-DSA is not available on a 24-hour basis at most institutions, it cannot be performed in some emergencies (eg, patients with acute stroke who are admitted outside the hours of MR-DSA availability). Although CCA remains the diagnostic “gold standard,” it is an invasive, time-consuming procedure. Moreover, it can be difficult to acquire repeat CCA scans, especially in critically ill patients and those on ventilators, and it does not provide information on the cerebral hemodynamics.
d3D-CTA, on the other hand, provides information regarding the 3D vascular structure, the dynamic blood flow, and cerebral perfusion. Because CT scanners are available around the clock at most institutions, d3D-CTA scans can be acquired in emergent patients, especially those admitted outside the regular hours with ischemic stroke. Although we have not examined patients with acute ischemic stroke by d3D-CTA, in such patients, it could detect the site of occlusion of intracranial vessels, the degree of arterial stenosis or occlusion, and the presence of impaired cerebral perfusion, thereby allowing the appropriate and immediate management of these patients. At present, our technique is preliminary and cannot cover large lesions because the scan range is limited to 32 mm. However, a MDCT with 256 detectors would allow scanning of the entire head from the skull base to the vertex. d3D-CTA can also be used to investigate the steal phenomenon in patients with subclavian steal syndrome, to assess circulatory changes after bypass surgery, and to perform follow-up examinations after endovascular treatment or radiation therapy. Because d3D-CTA is minimally invasive, patients can be monitored on an outpatient basis, rendering this method cost-effective. Finally, the cost of d3D-CTA is half that of conventional angiography.
However, the limitations and disadvantages of d3D-CTA must not be overlooked. Compared with CCA, its spatial resolution is inferior. Although we perform conventional CTA with a tube voltage/current of 135 kV/260 mA and an injection speed of 3 mL/s, at d3D-CTA, we decreased the tube current to 150 mA to reduce the radiation dose; at scanning parameters of 135 kV/260 mA for 20 seconds, the estimated radiation dose exceeds 700 mGy. However, at 150 mA, the spatial resolution of 3D-CTA is poor. Therefore, to improve its spatial resolution, at d3D-CTA, we usually deliver a bolus contrast injection at a rate of 6 mL/s (total volume 30 mL), twice that used in conventional 3D-CTA.
Although others24,25 have reported contrast infusion at 7–8 mL/s, they did not discuss possible complications attributable to the high speed of injection. In their perfusion CT study, Koenig et al26 injected 50 mL of contrast medium at a flow rate of 20 mL/s. They reported no complications in patients without severe cardiac insufficiency and only a warm sensation throughout the body. Although none of their patients experienced extravasation of the contrast medium or other serious complications, special care must be taken when d3D-CTA is performed on patients with cardiac disease or in elderly persons.
In all 12 of our patients, the contrast medium arrived at the scan range within 20 seconds. Because the pulse rate is significantly correlated with the arrival of the injected contrast medium at the intracranial circulation,27 in patients with bradycardia, the scan delay time should be adjusted to yield the appropriate scan timing. In patients with severe heart disease, the injection speed and total volume of the contrast medium must be decreased.
Because the high injection speed may lead to catheter rupture, we use a pressure monitor at the injector. The catheters we use can sustain a pressure of up to 15 kg/cm2; at 6 mL/s, the measured pressure was approximately 6 kg/cm2.
At a section thickness of 0.5 mm, the craniocaudal coverage was only 32 mm and insufficient to cover relatively large lesions. Coverage of the whole brain requires a 256-detector row MDCT; this would allow scanning at a section thickness of 0.5 mm over a 128-mm range and the production of functional maps of the entire brain.
In our series, approximately 10 minutes elapsed from the start of scanning to the generation of d3D-CTA images and functional maps. The development of advanced postprocessing software for d3D-CTA will shorten this time. Our technique exposes patients to a relatively high radiation dose (approximately 500 mGy), 5-fold that of conventional 3D-CTA (100 mGy). The exact radiation dose at CCA cannot be measured because it depends on the duration of radiation exposure. Because the radiation dose at CCA for 4 vessels, the bilateral carotid and vertebral arteries, is approximately 300–400 mGy, we estimate that the radiation dose with fluoroscopy is somewhat greater than that.
The radiation dose at perfusion CT is reportedly 700–1400 mGy.28 Imanishi et al29 encountered 3 patients with transient bandage-shaped hair loss after perfusion CT combined with CCA or interventional procedures. Because all 3 of their patients underwent 2 angiography studies of the head and more than 2 perfusion CT studies within 15 days, they estimated that they received a radiation dose of more than 3–5 Gy to the skin. The danger of excessive radiation exposure must be considered when patients are subjected to repeated d3D-CTA studies.
The radiation dose in d3D-CTA is comparable with CCA and lower than in perfusion CT studies. Although there are currently no guidelines on what represents a reasonable radiation dose for CT studies, efforts must be made to keep the dose as low as possible. We are in the process of developing technologies that yield improved image quality at reduced radiation doses and lower contrast injection speeds.
Conclusion
d3D-CTA is a promising new technique that can demonstrate 3D hemodynamics. Our technique yields information on the 3D structure of vessels, and serial 3D images of the dynamic blood flow and cerebral perfusion in a single scanning. Although our technique is in the preliminary stage, it is fast and minimally invasive and may represent an advanced neuroimaging technique. We postulate that d3D-CTA can replace CCA in the diagnosis for almost all patients with central nervous system disorders except for the cases that require the interventional procedure.
References
- Received February 13, 2006.
- Accepted after revision April 12, 2006.
- Copyright © American Society of Neuroradiology


