
Abstract
BACKGROUND AND PURPOSE: Retrograde cortical venous drainage (RCVD) is the most major risk factor for aggressive behavior of intracranial dural arteriovenous fistulas (DAVF). The purpose of this study was to assess the efficacy of relative cerebral blood volume (rCBV) map for RCVD in patients with DAVF.
METHODS: Ten patients with angiographically proven DAVF with RCVD, 2 reference patients with DAVF without RCVD, and 10 control subjects underwent examinations with dynamic susceptibility contrast (DSC)-MR imaging. Four patients with DAVF with unilateral RCVD were evaluated, before and after treatment. The calculation of mean rCBV ratio was performed on a hemispheric basis. The mean rCBV ratio was defined as the value on one side (higher value side) divided by that on the other side (lower value side).
RESULTS: In all patients with DAVF with RCVD, the rCBV map showed an increase in rCBV of the angiographically proved affected hemisphere. In 2 reference patients with DAVF without RCVD and all control subjects, the rCBV map showed no increase of rCBV. The mean rCBV ratio in patients with DAVF with RCVD was significantly higher than that of control subjects (P = .0002). Treatment response for RCVD was indicated by a decrease of CBV on the rCBV map and by a decrease of 22% in the mean rCBV ratio.
CONCLUSIONS: Increased rCBV by DSC-MR correlated with RCVD in patients with DVAF. The assessment with rCBV for RCVD may be more quantitative than that with angiogram.
Intracranial dural arteriovenous fistulas (DAVF) have long been regarded as benign compared with brain arteriovenous malformations.1 In approximately 15% of cases, however, patients sustain intracranial hemorrhage, most commonly intraparenchymal or subarachnoid in location.2 In addition, a smaller number of cases are identified as a result of parenchymal deficits, seizures, or dementia arising from venous hypertension because of impairment of venous drainage.3 Previous reports4–6 have suggested that a finding of retrograde cortical venous drainage (RCVD) is a major risk factor for aggressive behavior of DAVF. DAVF are grouped into benign or aggressive categories dependent on the pattern of venous drainage on angiogram.7–9
Angiography is the best technique for the diagnosis of DAVF. Findings of angiographic examinations reveal arteriovenous shunt, venous outflow obstruction, and RCVD. The angiographic appearance of brain parenchymal venous drainage is delayed, confirming widespread venous hypertension.10 However, it is difficult to evaluate hemodynamics quantitatively on the basis of angiographic findings in patients with DAVF with RCVD.
Developments in the dynamic susceptibility contrast (DSC)-MR technique make it possible to assess transit time, relative cerebral blood volume (rCBV), and relative cerebral blood flow by analyzing signal intensity changes after the first pass of a paramagnetic contrast agent.11,12 We thought that RCVD caused an increase in the volume of blood as a result of dilation of cortical and medullary veins, and thereby the increase in rCBV of an affected hemisphere with RCVD can be demonstrated with the use of DSC-MR technique. We performed DSC-MR in 10 patients with DAVF with RCVD, and in 4 patients with unilateral RCVD before and after treatment. The purpose of our study was to correlate rCBV by DSC-MR with the presence or absence of RCVD confirmed by angiography.
Materials and Methods
Patients
Summary of data of patients with DAVF in this retrospective study are shown in the table. Ten patients (6 men and 4 women; age range, 50–75 years; mean age, 60.5 years) with angiographically proved DAVF with RCVD and sinus occlusion underwent examinations with routine T1- and T2-weighted imaging, 3D time-of-flight (TOF) MR angiography, and DSC-MR imaging. Three patients were evaluated twice and 1 was evaluated 3 times, before and after treatment (interval between first and second MR examinations was 2 weeks to 15 months). Two patients (reference cases) with angiographically proved DAVF without RCVD and sinus occlusion also underwent the same examinations. The control subjects consisted of 10 patients (7 men and 3 women; age range, 53–77 years; mean age, 58.2 years) without DAVF (ruled out by follow-up clinical findings) who underwent the same DSC-MR imaging. Indication for these examinations in these cases included transient ischemic attack, small infarction, and small brain tumor. These lesions did not affect target selection for rCBV measurement because these lesions were located in another section. Informed consent was obtained from all patients with DAVF and from control subjects.
The hemispheres of patients with DAVF with RCVD were grouped into affected (hemisphere with RCVD) or nonaffected (hemisphere without RCVD) categories dependent on the presence or absence of RCVD on angiogram. Three patients with DAVF were affected in both hemispheres. Totals of 13 affected and 7 nonaffected hemispheres in patients with DAVF and 20 hemispheres of control subjects were evaluated.
MR Imaging
MR imaging was performed on a 1.5T superconducting unit with a standard head coil. Routine T1-weighted spin-echo and T2-weighted turbo spin-echo imaging were performed with the following parameters: for T1-weighted imaging, the repetition time (TR) was 550 ms and the echo time (TE) was 15 ms; for T2-weighted imaging, the TR was 5000 ms and the TE was 90 ms. All images were obtained with a 22-cm field of view (FOV) and 192 × 256 matrix. Section thickness was 7 mm. 3D-TOF MR angiography was performed with 3D fast imaging in a steady-state precession sequence with the following parameters: TR of 40 ms, TE of 6.5 ms, flip angle 20°, 64 or 80 partition, 22-cm FOV, and 192 × 512 matrix. The actual thickness of the partitions was 0.8 or 1.0 mm. The saturation pulse was placed above the volume slab in all DAVF and control patients.
DSC-MR Imaging
DSC-MR imaging was undertaken by gradient-echo (GE) echo-planar pulse sequence. The imaging parameters were as follows: TR was 1000 ms, TE was 60.7 ms, flip angle was 60, FOV was 24 cm, matrix was 128 × 128, and section thickness was 7 mm. There was one acquisition; a bolus injection of 0.1 mmol/kg of gadolinium-based contrast agent at 2 mL/s immediately followed by a bolus injection of saline (total 20 mL at same rate) by power injector, and each section was sampled 60 times per minute. DSC-MR imaging was covered in the section through basal ganglia to the body of lateral ventricle with 5 sections. To acquire rCBV measurement, the measured time-signal intensity curves were converted first into a time-concentration curve and then were fitted with a γ-variate function to eliminate recirculation effects. Blood volume values were determined by using equations obtained from the indicator dilution theory by calculating the area under the tissue time-concentration curve on a pixel-by-pixel basis.
Image Interpretation
The routine MR imaging in all patients with DAVF with RCVD and the rCBV maps in all patients with DAVF and control subjects were independently reviewed by 2 neuroradiologists who were unaware of patients’ histories and findings of physical examination and angiography. The presence or absence of prominent flow voids on the surface or deep in the brain and of white matter edema and the presence of increased rCBV was evaluated. Disagreements were resolved by consensus.
Measurement of rCBV Ratio
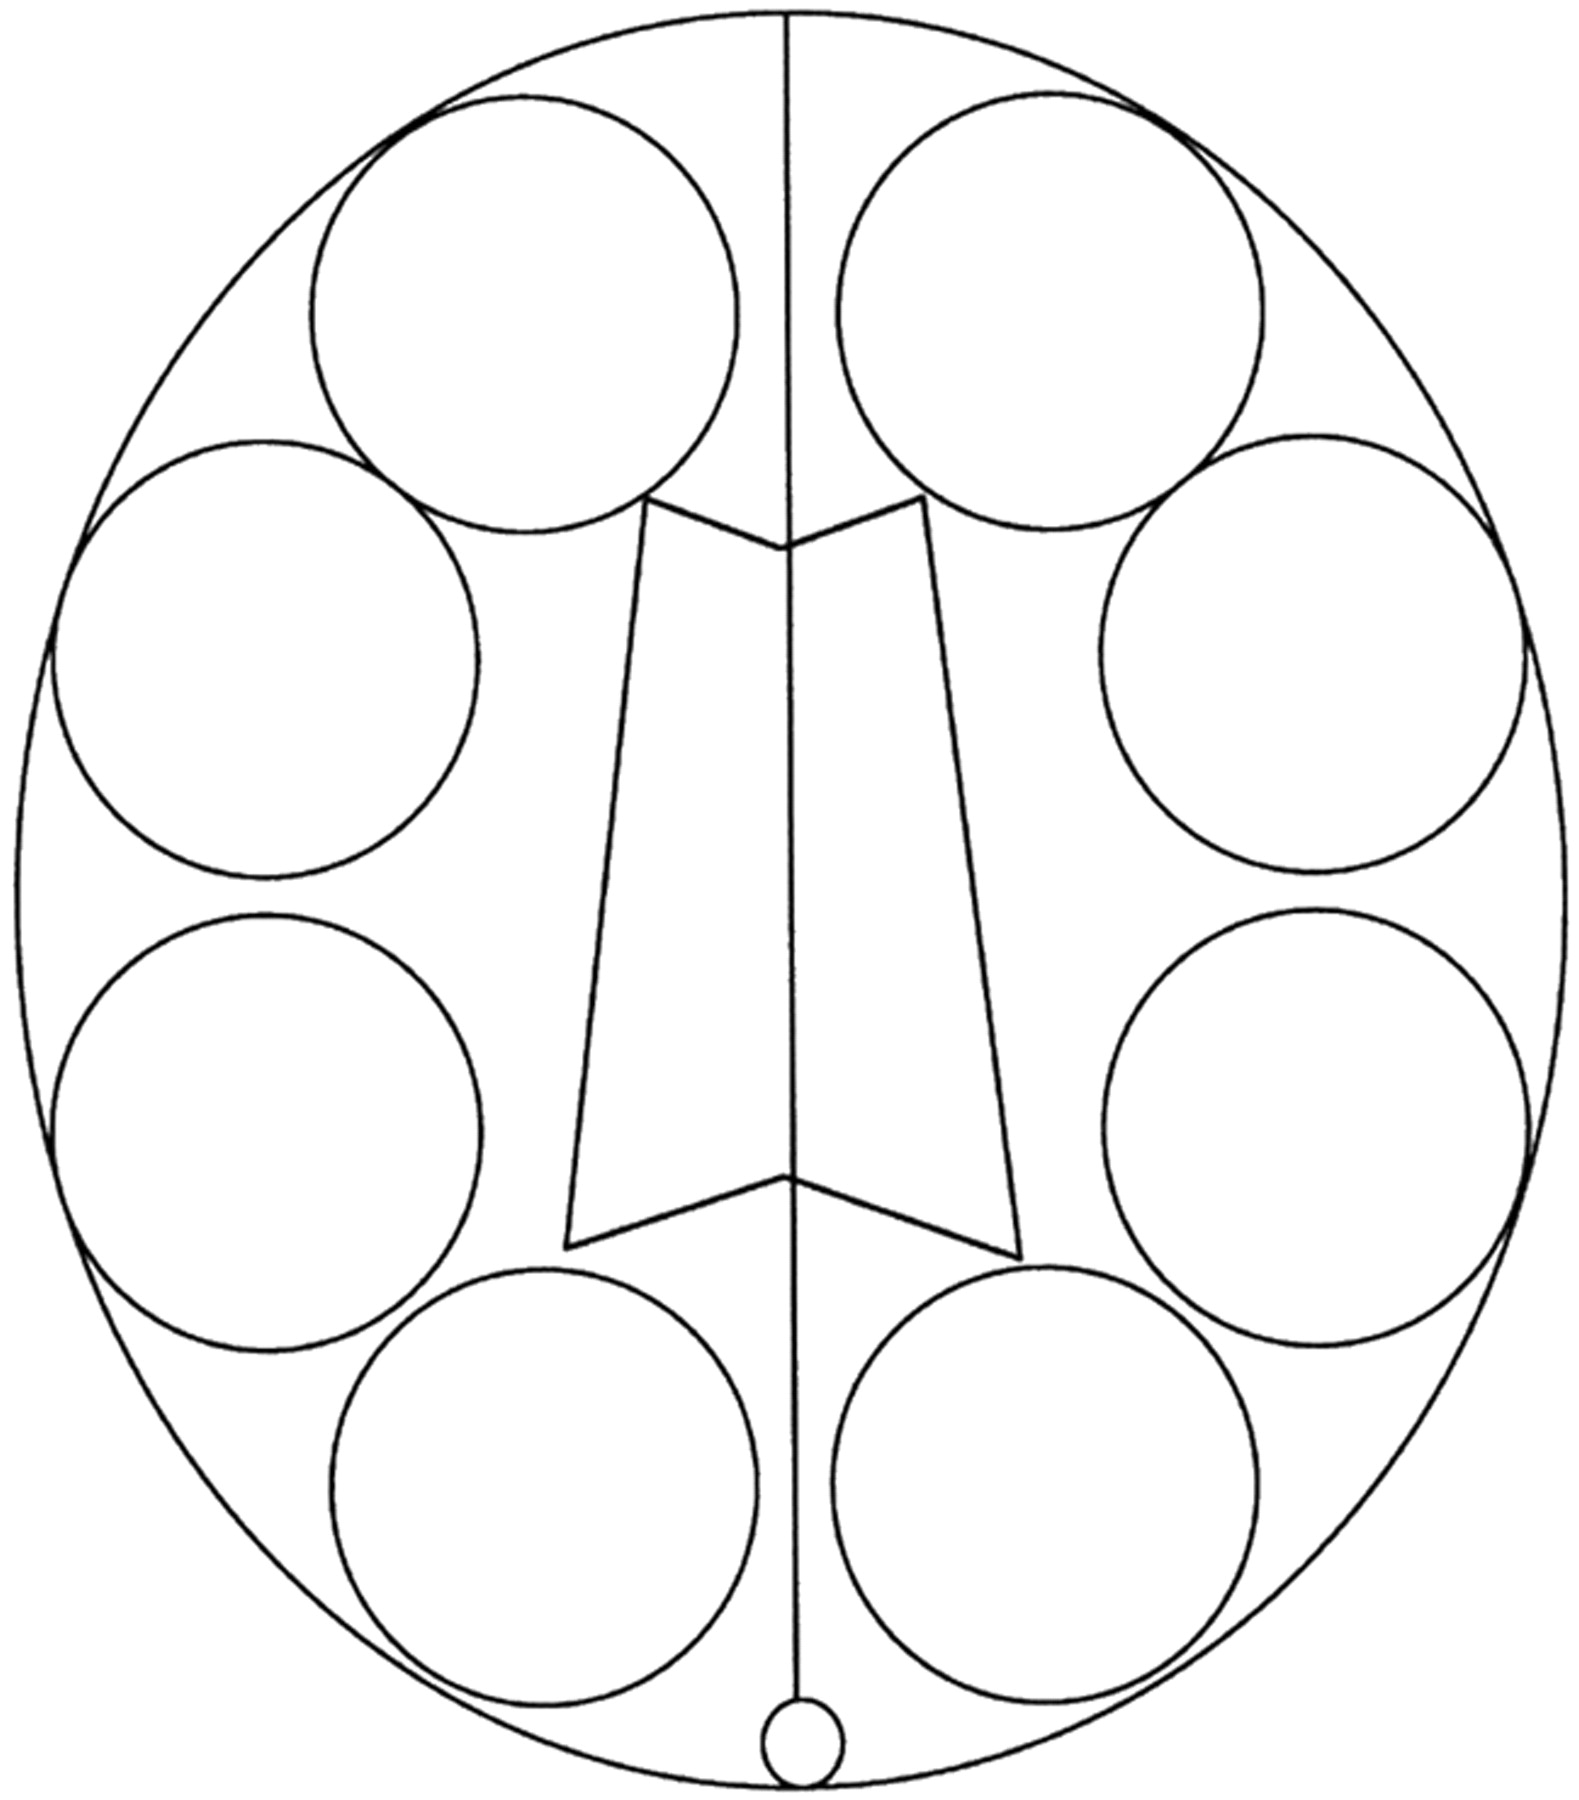
Region of interest (ROI) analyses for rCBV were performed in all patients with DAVF and in control subjects. From DSC-MR imaging, the section through the body of the lateral ventricle was selected as the target section for the rCBV measurement. We defined CBV as the fraction of the total tissue volume within a voxel occupied by blood (arteries, capillaries, and veins). Therefore, the ROI included dilated large blood vessels except venous sinus. Four circular (approximately 3.5 to 4 cm) ROIs were placed in each hemisphere including the cerebral cortex and white matter on the target section without covering the adjacent venous sinus. We obtained 8 ROIs in each patient, 4 in each hemisphere. The schematic shows the ROIs for rCBV measurement on the target section in Fig 1. The calculation of mean rCBV ratio was performed on a hemispheric basis. We defined the rCBV ratio as the value on one side divided by that on other side. In patients with DAVF with one affected hemisphere, the rCBV ratio was defined as the value on affected side divided by that on nonaffected side. In patients with DAVF with both hemispheres affected and in control subjects, the rCBV ratio was defined as the value on the higher value side divided by that on the lower value side.

Schematic shows the region of interests for rCBV measurement on the target section.
Statistical Analysis
The nonparametric Mann-Whitney U test was used to compare rCBV ratio between patients with DAVF with RCVD and control subjects. The nonparametric Wilcoxon signed rank test was used to compare rCBV ratio between before and after treatment in patients with DAVF with RCVD. For all statistical tests, P values less than 0.05 were considered to indicate significant difference.
Results
A summary of patient data is shown in Table 1. Four patients had papilledema. Two patients had intracranial hemorrhage; one patient had a small subcortical hematoma in the right parietal lobe and the other had a small amount of subarachnoid hemorrhage at the posterior fossa. No patients had white matter edema secondary to severe venous hypertension.
Summary of patient data
Although T2-weighted imaging showed prominent flow voids on the surface or deep in the brain in 5 (50%) of 10 patients with DAVF with RVCD, the rCBV map showed an increase in rCBV of affected hemisphere with RCVD in all cases (Fig 2). In particular, a greater increase of rCBV was observed in the posterior part of the hemisphere. In all patients with DAVF without RCVD (reference cases) and all control subjects, the rCBV map did not show any increase in CBV. In the patient with DAVF (case 9) with small subcortical hematoma in the right parietal lobe, the CBV map showed a more extensive increase of CBV in the right hemisphere than in the left hemisphere, though left and right common carotid angiograms showed almost the same marked venous congestion (Fig 3).

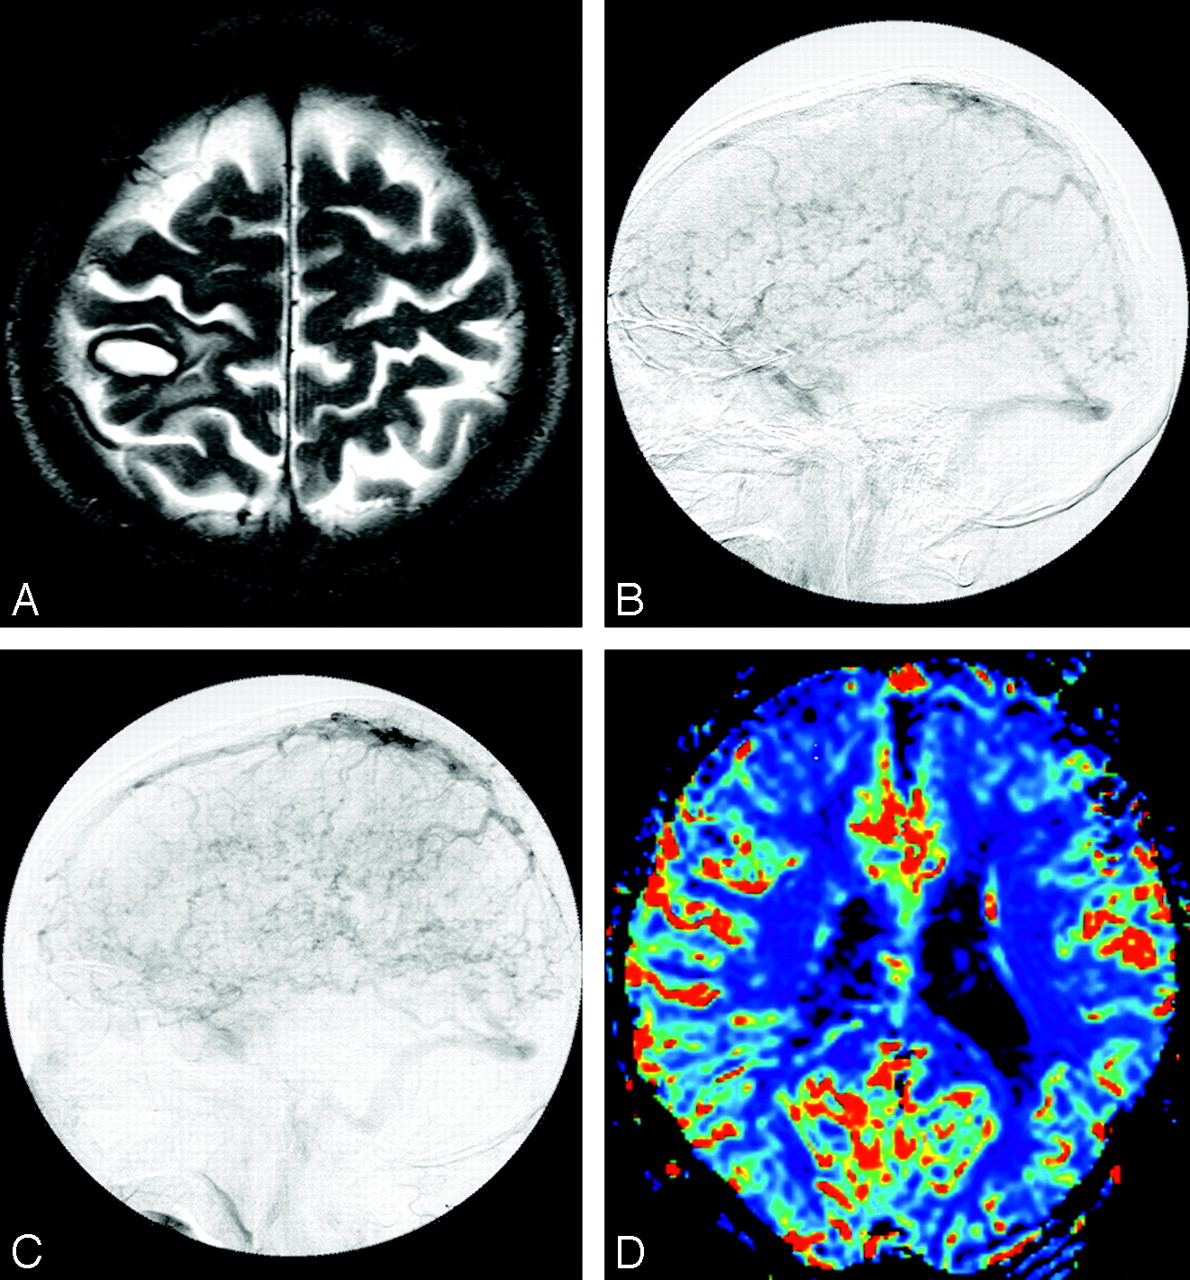
Dural arteriovenous fistula at left transverse-sigmoid sinus in a 52-year-old woman (case 7).
A, T2-weighted image shows no prominent flow voids on the cortical sulci.
B, Left external carotid angiogram depicts reflux in the vein of Labbe and retrograde cortical venous drainage with occlusion of left transverse sigmoid sinus.
C, Color overlay of relative cerebral blood volume (rCBV) map shows marked increase of CBV in the left hemisphere (mean rCBV ratio, 1.32).

Dural arteriovenous fistula at superior sagittal sinus in a 70-year-old man (case 9).
A, T2-weighted image shows late subacute subcortical hematoma in the parietal lobe.
B, Venous phase of right common carotid angiogram depicts retrograde cortical venous drainage (RCVD) with occlusion of posterior part of superior sagittal sinus.
C, Venous phase of left common carotid angiogram also depicts RCVD with occlusion of posterior part of superior sagittal sinus.
D, Color overlay of relative cerebral blood volume (rCBV) map shows marked increase of CBV in the hemispheres bilaterally. The extent of increase of CBV is larger in the right hemisphere than in the left hemisphere (mean rCBV ratio, 1.37; however, the rCBV ratio may be underestimated because of the bilateral affected hemispheres).
The mean rCBV ratio in control subjects was 1.04 ± 0.03 (SD), with a range of 1.0 to 1.08. The mean rCBV ratio in patients with DAVF was 1.35 ± 0.24 (SD), with a range of 1.14 to 1.94. The mean rCBV ratio in 2 patients with DAVF without RCVD (reference cases) was 1.02 and 1.03, respectively. The mean rCBV ratio in patients with DAVF with RCVD was significantly higher than that in control subjects (P = .0002) (Fig 4).

Box and whisker plot show mean relative cerebral blood volume (rCBV) ratio in control subjects and in patients with dural arteriovenous fistulas (DAVF) with retrograde cortical venous drainage (RCVD). The mean rCBV ratio in patients with DAVF with RCVD is significantly higher than that in control subjects (P = .0002).
One patient (case 1) was treated with complete arterial embolization, another (case 2) was treated with arterial embolization and surgical operation (direct packing of the venous sinus), and the other 2 patients (case 3, 4) were treated with partial arterial embolization. In all treated patients, the mean rCBV ratio decreased after treatment. The mean rCBV ratio before treatment was 1.41 ± 0.37 (SD), with a range of 1.14 to 1.94, and that after treatment was 1.10 ± 0.09 (SD), with a range of 1.01 to 1.23. Treatment response for RCVD was indicated by a decrease of CBV on the rCBV map (Fig 5) and by a decrease of 22% in the mean rCBV ratio, though the differences were not statistically significant (P = .125).

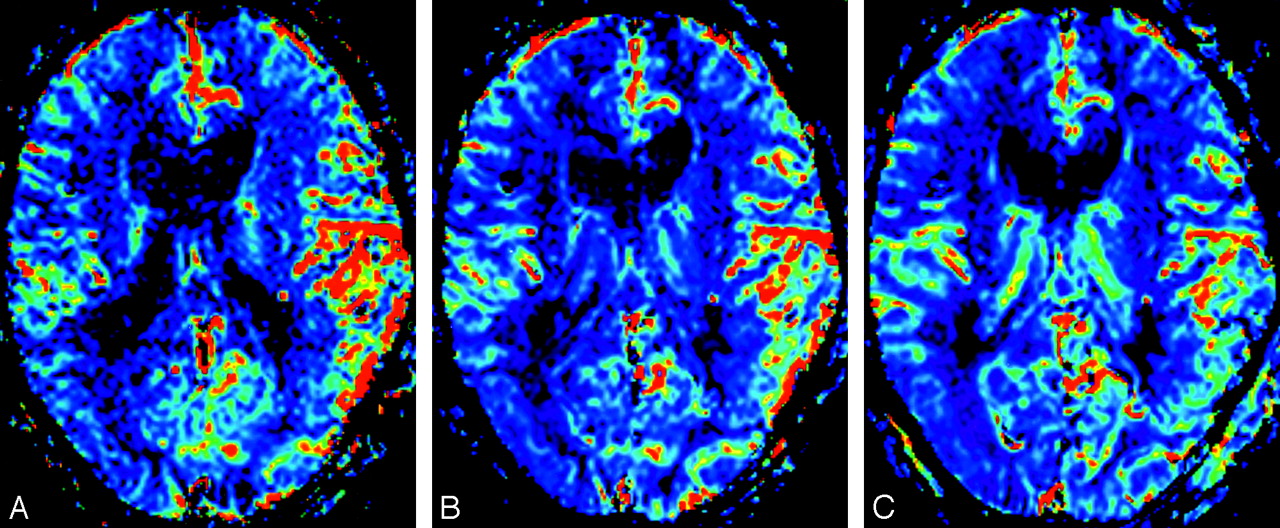
Dural arteriovenous fistula in left transverse-sigmoid sinus in a 71-year-old man (case 2).
A, Color overlay of relative cerebral blood volume (rCBV) map shows marked increase of CBV in the left hemisphere (mean rCBV ratio, 1.94).
B, Color overlay of rCBV map obtained after partial embolization shows improvement of increase of CBV in the left hemisphere (mean rCBV ratio, 1.74).
C, Color overlay of rCBV map obtained after surgical operation (direct packing of the venous sinus) shows more improvement of increase of CBV in the left hemisphere (mean rCBV ratio, 1.23).
Discussion
RCVD is the most major risk factor for aggressive behavior of DAVF. Several authors4–9 have stressed the importance of RCVD in the development of hemorrhage. Our study suggests that CBV is a very sensitive indicator of RCVD in patients with DAVF. The mean rCBV ratio of the affected hemisphere in patients with DAVF was significantly higher than that of nonaffected hemisphere in patients with DAVF and that of control subjects. In all treated patients, the DSC-MR imaging performed before embolization revealed an increased rCBV ratio, which decreased after treatment. Iwama et al13 performed positron-emission tomography (PET) to determine absolute hemodynamic parameters in patients with DAVF with RCVD, who had significantly higher CBV than a control group. These findings are in overall agreement with those of a recent PET study of patients with DAVF.
DAVF are divided into some subgroups dependent on the pattern of venous drainage on angiogram.7–9 Angiography should be performed for the diagnosis of a DAVF. Angiography shows findings of arteriovenous shunt, venous outflow obstruction, and RCVD. However, it is difficult to evaluate hemodynamics quantitatively on the basis of angiographic findings in patients with DAVF with RCVD because the angiographic findings of DAVF are complex, consisting of combinations of arteriovenous shunts, RCVD, sinus occlusions, and impaired parenchymal circulation.
In one patient (case 9) with small subcortical hematoma in the right parietal lobe, the CBV map showed a more extensive increase of CBV in the right hemisphere than in the left hemisphere, though left and right internal carotid angiograms showed almost the same marked venous congestion (Fig 3). This result may suggest that the assessment with rCBV for RCVD is more quantitative than that with angiogram. DAVF may be grouped into benign or aggressive categories depending on the CBV value in addition to the pattern of venous drainage on angiogram.
Conventional MR imaging is often positive in DAVF with RCVD,14–16 though MR imaging of the brain parenchyma in patients with DAVF without RCVD is typically normal. In patients with RCVD, MR imaging often shows prominent flow voids on the surface or deep in the brain, and T2-weighted imaging shows white matter edema secondary to the severe venous hypertension. In our study, the rCBV map visually showed an increase of rCBV of the affected hemisphere in all patients with RCVD, though T2-weighted imaging showed prominent flow voids on the surface or deep in the brain in 5 of 10 (50%) patients with DAVF with RVCD.
Noguchi et al17 reported that the findings of multiple high-intensity curvilinear and nodular structures adjacent to the sinus wall on source images of 3D-TOF MR angiography was reliable for the detection of DAVF with moderate to high arteriovenous shunt, and MR digital subtraction angiography clearly showed retrograde cortical venous drainage, a major risk factor for poorer clinical outcome in patients with DAVF. In our study, the rCBV map could semi-quantify the severity of RCVD in patients with DAVF. As a result, we may be able to decrease the number of follow-up invasive intraarterial catheter angiographies for the screening of suspected worsening lesions in patients with partially treated RCVD.
Our study has some important limitations. The first and major limitation is that rCBV was used in the present study. Our study suggested that the rCBV map is sensitive for indicating impairment of venous drainage in patients with DAVF with RCVD. However, the assessment of the rCBV ratio may lead to underestimation of abnormality when bilateral hemispheres are affected. Three cases with bilateral affected hemispheres (bilateral hemispheres with RCVD) were included in our study; therefore, the rCBV ratio obtained in these cases may lead to underestimation. For diffuse disease, in which the internal reference may also be affected, absolute quantification should be considered for more accurate assessment.
Second, the small number of patients with DAVF was limited. Although our study suggested that treatment response for venous hypertension was indicated by a decrease of 22% in the mean rCBV ratio, the differences were not statistically significant, probably because of the limited number of patients treated. In addition, most (7 of 10 patients, 70%) sites of DAVF were in the transverse-sigmoid sinus in present study. Further studies with larger numbers of patients with DAVF, including DAVF at any site and treated cases, will be necessary.
Third, increased rCBV, as seen in our patients, may be related to the GE type echo-planar imaging used in DSC-MR imaging. Several studies18,19 have shown that GE perfusion sequences are more sensitive than spin-echo (SE) sequences for flow in larger caliber vessels. Although contrast-to-noise ratios are greater in GE sequences than in SE sequences, the greater susceptibility effect created in and around larger vessels with sequences can lead to overestimation of rCBV in these lesions. However, we defined CBV as the fraction of the total tissue volume within a voxel occupied by blood (arteries, capillaries, and veins). The elevation of rCBV in our study may therefore reflect blood products in the more numerous and dilated venous channels because of venous hypertension rather than true elevation in tissue-level capillary perfusion. Donahue et al20 demonstrated increased signal intensity on GE rCBV maps and normal signal intensity on SE rCBV maps in venous malformation.
Conclusions
The rCBV determined by DSC-MR correlated with RCVD in patients with DAVF, confirming a prior report in which PET was used. The rCBV determined by DSC-MR may be the most useful for follow-up assessment of DAVF with partially treated RCVD. In future studies, absolute quantification should be considered for more accurate of RCVD in patients with DAVF.
References
- Received July 15, 2005.
- Accepted after revision October 31, 2005.
- Copyright © American Society of Neuroradiology


