
Abstract
BACKGROUND AND PURPOSE: Cerebral atrophy following herpes simplex encephalitis has formerly been described. We aimed to quantify atrophy after encephalitis of various causes. Additional objectives were to define which initial or long-term clinical factors correlate with volume loss and to search for any correlate in global clinical outcome measures.
METHODS: MR imaging was performed in 40 subjects in the acute stage of encephalitis and ≥6 months after onset of symptoms. The ventricle brain ratio (VBR) was measured on corresponding images from disease onset and follow-up, and the change in VBR (VBR delta) was calculated as a percentage value of the starting measure. Clinical outcome was evaluated by interview and neurologic examination and characterized by using an encephalitis-adapted version of the modified Rankin Scale.
RESULTS: The VBR delta ranged from −5%–102% (median, 5.93%; lower quartile, 1.8%; upper quartile, 14.55%; mean, 14.43%; SD, 23.75%). We found significant differences in the VBR delta between those patients who required intensive care (P = .027), had more than 2 epileptic seizures or a status epilepticus during the acute stage (P = 0.021), or developed postencephalitic epilepsy (P = .015) and their respective counter-subgroups. Three patients were rated to have unfavorable outcome (modified Rankin Scale, 3–5). Patients with unfavorable clinical outcomes tended to show greater VBR delta values, but a statistical evaluation was impossible because of small numbers.
CONCLUSION: More than 2 epileptic seizures or a status epilepticus during the acute stage of encephalitis is associated with a greater loss of parenchyma.
MR imaging is the technique of choice for acute encephalitis.1 There are a limited number of MR imaging follow-up studies after acute encephalitis, mostly of herpes simplex encephalitis (HSE), demonstrating the development of ventricular dilation and/or cortical atrophy after HSE.2–4 MR imaging follow-up examinations were also performed in Japanese encephalitis5 and Nipah virus encephalitis,6 as well as in several single cases of various causes.7–10 Except for steroid-induced reversible cortical atrophy in some patients followed up after acute disseminated encephalomyelitis (ADEM), these studies did not demonstrate the development of parenchyma loss.
A frequently used measurement for cerebral atrophy is the ventricle brain ratio (VBR). It has been applied in studies of various neurologic and psychiatric diseases.11–14 VBR is measured planimetrically or volumetrically and is defined as area of the lateral ventricles divided by the brain area or total intracranial area in a certain plane.11–17 Analogous definitions are found in the volumetric studies by using the brain volume or the intracranial volume as the denominator.18 In all definitions, the expression of ventricular size as a percentage value of the brain/intracranial area or volume serves as a correction for the variation by head size.15,17,18
In this follow-up MR imaging study, we aimed to quantify atrophy after acute encephalitis of various causes by measuring the change in ventricle brain ratio (VBR delta) with time. A second objective was to define which initial or long-term clinical factors correlate with a greater change in VBR and could therefore be predictive of a greater cerebral tissue loss. Third, we wanted to search for any correlate for a greater change in VBR detectable in global clinical outcome measures.
Patients and Methods
Inclusion and Exclusion Criteria
We included all immunocompetent patients with the diagnosis of an acute nonpurulent inflammatory cerebral disease made between January 1992 and October 1999 who fulfilled the following criteria:
Acute or subacute disease onset with cerebral symptoms within, at most, 4 weeks before hospital admission;
Diagnosis of encephalitis confirmed or highly probable based on inflammatory CSF results and/or pathologic cerebral MR imaging findings indicative of encephalitis and/or cerebral biopsy.
We excluded patients with primarily chronic disease, pure meningitis, purulent meningoencephalitis, focal purulent disease (cerebral abscess, septic encephalitis), cerebral parasitosis, immunodeficiency, or possible or definite diagnosis of multiple sclerosis.
Patients
Forty-one patients (22 women, 19 men) who had acute encephalitis between January 1992 and October 1999 participated in a follow-up examination at least 6 months after disease onset. One female patient with an extensive lesion in the right hemisphere was excluded from data analysis because we also aimed to evaluate more subtle changes in cerebral area. The remaining 40 patients’ data were analyzed further. Their median age at follow-up was 37 years (age range, 17–74 years; lower quartile, 24.5; upper quartile, 49.8; mean, 38.2; SD, 15.5), the time interval between the acute stage and follow-up ranged from 6–84 months (median, 35 months; lower quartile, 12.3; upper quartile, 57; mean, 36.9; SD, 23.9). The etiology of the encephalitis had been established in 14 (35%) of 40 patients and had remained unclear in 26 (65%) (Table 1). None of these patients had any brain disease before the encephalitis.
Etiology of acute encephalitis in 40 patients followed up by MR imaging
Image Acquisition
Ethical approval was granted by the institutional review board, and informed consent was obtained from each patient. Each patient had MR images obtained during the acute phase. All follow-up MR images were acquired on the same 1.5T Vision scanner (Siemens, Erlangen, Germany) by using a head coil. The patient’s head was fixed with a vacuum pillow. We acquired transversal T2-weighted images with 5-mm section thickness (TR, 3800 ms; TE, 22 ms/90 ms [2 echoes]; intersection gap, 0.5 mm; field of view, 23 cm; matrix, 256 × 256). To obtain planes corresponding to the ones from the acute stage, we chose orientation of planes identical to those in the preexisting images regarding angle and height, taking into account the different position of the head. Contrast agent was not administered. The images from the acute stage of encephalitis and from the follow-up examination were evaluated visually by an experienced neuroradiologist (C.Z.).
Measurement of VBR and Change in VBR (VBR Delta)
To quantify a potential postencephalitic cerebral atrophy, we planimetrically measured ventricle brain ratio at the beginning of the disease and at follow-up. We relied on the method previously described by Bekkelund et al.11 VBR was defined as area of the lateral ventricles divided by area of the brain.  For each patient, corresponding transversal planes were scanned, 1 each from the first MR imaging of the acute stage of the encephalitis and from the follow-up MR imaging. The plane just superior to the caudate heads was chosen.
For further image modification to obtain good contrast, we used Photoshop 4.0 software (Adobe, San Jose, Calif). The areas of the lateral ventricles and of the brain were measured by manual tracing, by using Scion Image software (version beta 4.0.2, Scion, Frederick, Md). Modifying the method described by Bekkelund et al,11 we defined the margins for the brain area at the inner outline of the subarachnoid space and traced wide sulci (Fig 1). A definition of the margins for brain area as in our study is presented by Liu et al.16 Our aim in choosing this margin definition was to include as little as possible of the subarachnoid space in the measurement of brain area, to facilitate a better evaluation of cortical atrophy. Each measurement was performed 3 times by the same examiner (E.K.H.). The mean of the 3 measurements was used for calculating the VBR.

Planimetric measurement of the ventricular area and brain area to determine the VBR.
The difference between the VBR at follow-up and the VBR at disease onset was calculated and divided by the VBR at disease onset. The determined value, expressed as a percentage and termed “VBR delta,” thus represents the change in VBR at follow-up in comparison with the acute disease stage as a percentage of the starting value. A high VBR delta signifies a great loss of planimetrically measurable cerebral area.  This method of determining the VBR delta to judge a cerebral parenchyma loss presents the following problems: Although we took great care to define the plane orientation of the MR imaging follow-up corresponding to the initial MR imaging (in height and angle, taking into account the different head positions), slight differences in plane orientation between the acute stage and the follow-up MR imaging may have occurred.18 Height and angle of plane orientation substantially influence the result of planimetric measurements, and this influence is even strengthened by the intersection gaps (0.5 mm in this study). Anatomic planes from the 2 examination dates not exactly corresponding to each other, therefore, lead to an imprecision in determining the VBR delta. Moreover, because of partial volume effect, the boundaries between CSF and gray or white substance are not always precisely defined, resulting in a variability of subjective boundary determination and, thus, in a decreased reliability for VBR measurements.11,16 Some of these methodical problems have less influence on the results in volumetric VBR measurement, which is more sensitive19 but was not possible in our study. However, the high correlation found by Liu et al16 between planimetric and volumetric measurements (Pearson r = 0.942; P < .001) indicates that despite its many limitations, the planimetric method can provide good approximate measures.16
Evaluation of Clinical Outcome at Follow-Up
Clinical outcome was evaluated by interview and neurologic examination at follow-up and characterized by using an encephalitis-adapted version of the well-known modified Rankin Scale, which has been validated for stroke patients.20 The adaptation of this scale (Table 2) was necessary because to our knowledge, no encephalitis-specific scales or scores for judging disability exist to date. For statistical evaluation, we classified the patients as having “favorable outcome” (rank 0–2 on the encephalitis-adapted modified Rankin Scale, independence not impaired) or “unfavorable outcome” (rank 3–5, partial or complete dependence on others in activities of daily living). In the interview, patients were also evaluated for postencephalitic epilepsy.
Modified Rankin scale adapted for 40 patients suffering from acute encephalitis 6–84 months previously
Statistics
For statistical evaluation, we used SPSS software (version 9.0, SPSS, Chicago, Ill). For correlations between the VBR values and other metric data, we used the Spearman rank correlation and for group differences regarding the VBR delta, the Mann-Whitney U test. If necessary, exact test methods were applied (Monte Carlo method). Two dependent samplings were compared by using the Wilcoxon signed-rank test. A significant difference was accepted if the P value was less than .05.
Results
Change of VBR Between Disease Onset and Follow-Up
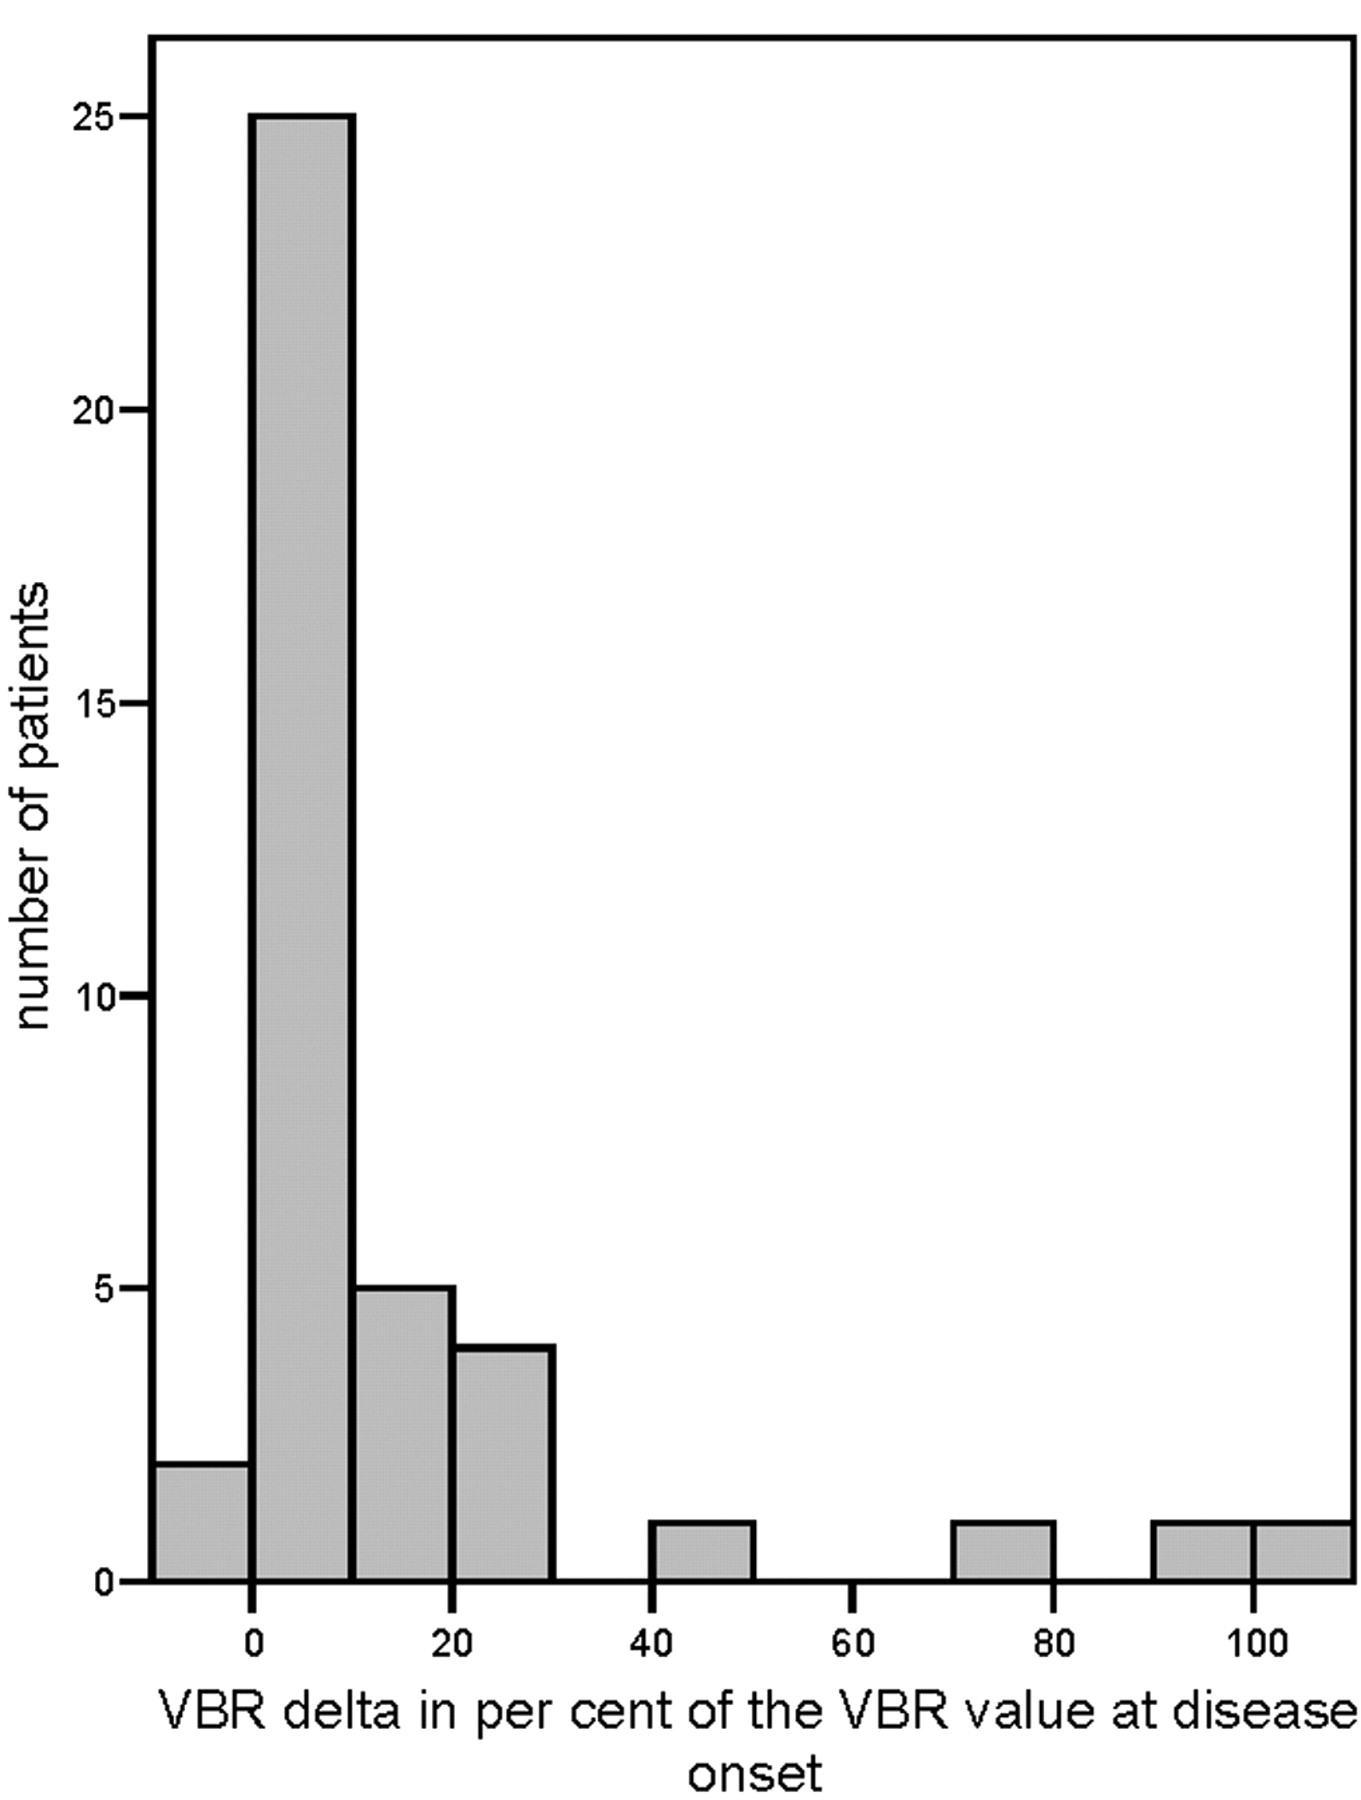
The median VBR of the 40 patients was 0.075 (range, 0.047–0.164; lower quartile, 0.063; upper quartile, 0.090; mean, 0.079; SD, 0.021) at the onset of the disease and 0.087 (range, 0.047–0.177; lower quartile, 0.071; upper quartile, 0.101; mean, 0.09; SD, 0.028) at follow-up. The difference in VBR between these 2 points of time was highly significant (P < .001). The proportional change in VBR compared with the value at disease onset (VBR delta) ranged from −5%–102% of the onset value, with a median of 5.93% (lower quartile, 1.8%; upper quartile, 14.55%; mean, 14.43%; SD, 23.75%).
No appropriate normative data were available for a physiologic increase in VBR. Therefore, we were unable to determine a cutoff point above which a VBR delta would be clearly pathologic. However, 4 patients showed VBR delta measurements that were clearly greater than those of the remaining patients (Fig 2): A patient with mycoplasma encephalitis had extensive cerebral lesions during the acute stage of the encephalitis. A patient with ADEM had more than 2 epileptic seizures during the acute stage of the disease. The remaining 2 patients with high VBR delta values had normal MR imaging findings at disease onset; 1 patient later developed hyperintensities in T2-weighted images in the temporomedial regions bilaterally. Both had a long refractory status epilepticus (for the MR images of 1 of these 2 patients, see Fig 3). For all 4 patients, the enlargement of the inner and also partly the outer CSF spaces, compared with the size at disease onset, was also noted at qualitative visual inspection.

Histogram of the VBR delta values of the 40 patients.

T2-weighted MR images of an 18-year-old man at disease onset with encephalitis of unknown etiology and refractory status epilepticus. Findings of the left image (day of hospital admission) are normal. The right image (11 months later) shows an enlargement of the ventricles and of the subarachnoid space.
Only 13 patients had focal parenchymal lesions during the acute phase; in 10 of them, residual focal lesions could be identified on follow-up MR imaging. No significant differences in VBR delta were found between patients with and without focal lesions.
Correlation Between VBR Results and Age, Time Between Disease Onset and Follow-Up, and Sex
There was a small but significant correlation between the VBR at disease onset and the age at that time (Spearman r = 0.362; P = .022). In contrast, VBR at follow-up did not correlate with the age at that time (Spearman r = 0.286; P > .05). Similarly, there was no correlation between the VBR delta and the age at follow-up (Spearman r = 0.109; P > .05) or between the VBR delta and the time between disease onset and follow-up (latency) (Spearman r = 0.139; P > .05). There was no significant sex difference in VBR delta. The same was true for the VBR values at disease onset and at follow-up.
Association Between VBR Delta and Clinical Aspects of the Encephalitis
We found a significant difference between the VBR delta of those patients who needed intensive care during their hospital stay and the VBR delta of those who did not (P = .027, U test), with greater values in the group who received intensive care. In addition, patients who had more than 2 epileptic seizures or a status epilepticus during the acute stage of the disease differed significantly in their VBR delta from those who had no or, at most, 2 epileptic seizures (P = .021; U test), the former presenting greater values. One example of a high VBR delta in a patient with a status epilepticus during the acute stage of the encephalitis is shown in Fig 3. Similarly, patients with postencephalitic epilepsy had significantly greater values than those who did not develop epilepsy (P = .015, U test) (Table 3). None of the compared subgroups differed significantly in age or time period between disease onset and follow-up (U tests).
VBR delta values of certain subgroups and P values yielded by means of U tests
There was an overlap of these clinical aspects in some patients: 7 of 9 patients with more than 2 epileptic seizures or a status epilepticus during the acute stage of the encephalitis had to be treated in an intensive care unit (ICU). Seven of 8 patients with postencephalitic epilepsy had several epileptic seizures or a status epilepticus during the acute stage (and the remaining patient had exactly 2 epileptic seizures). Seven of 9 patients with more than 2 epileptic seizures or a status epilepticus during the acute stage developed postencephalitic epilepsy. We did not find an association between a specific etiology of the encephalitis and the appearance of more than 2 or statuslike epileptic seizures during the acute stage or the development of postencephalitic epilepsy.
For the subgroups, “treated on ICU,” “more than 2 epileptic seizures or a status epilepticus during the acute stage,” and “postencephalitic epilepsy,” for which significant differences in VBR delta were found compared with their respective counter subgroups, the evaluation of other factors potentially influencing cerebral atrophy18,21 yielded the following results: Diabetes, arterial hypertension, coronary artery disease (evaluated by discharge letters and medication), and alcoholism were not present in the 3 subgroups named previously, and steroid medication was given in 3 of the patients who were treated in the ICU (2 of whom had also a status epilepticus initially as well as postencephalitic epilepsy) for only a very short period of time during the acute illness. Smoking and hyperlipoproteinemia were not systematically evaluated. In the group of all 40 patients, 2 were diagnosed with alcoholism and 2 more patients in addition to the 3 mentioned previously were given steroids for a short period of time. One of the patients with alcohol abuse was also diagnosed as having arterial hypertension. None had diabetes or coronary artery disease.
There was neither an association between the VBR delta and the etiology of the encephalitis nor were there significant differences in the VBR delta between the following groups: first MR imaging during the acute stage, normal versus abnormal; focal lesions in the follow-up MR imaging, existent versus nonexistent; severe impairment of consciousness (stupor or coma) versus no or mild impairment of consciousness (alertness or somnolence); and focal neurologic signs found versus not found.
Association Between VBR Delta and Global Clinical Outcome
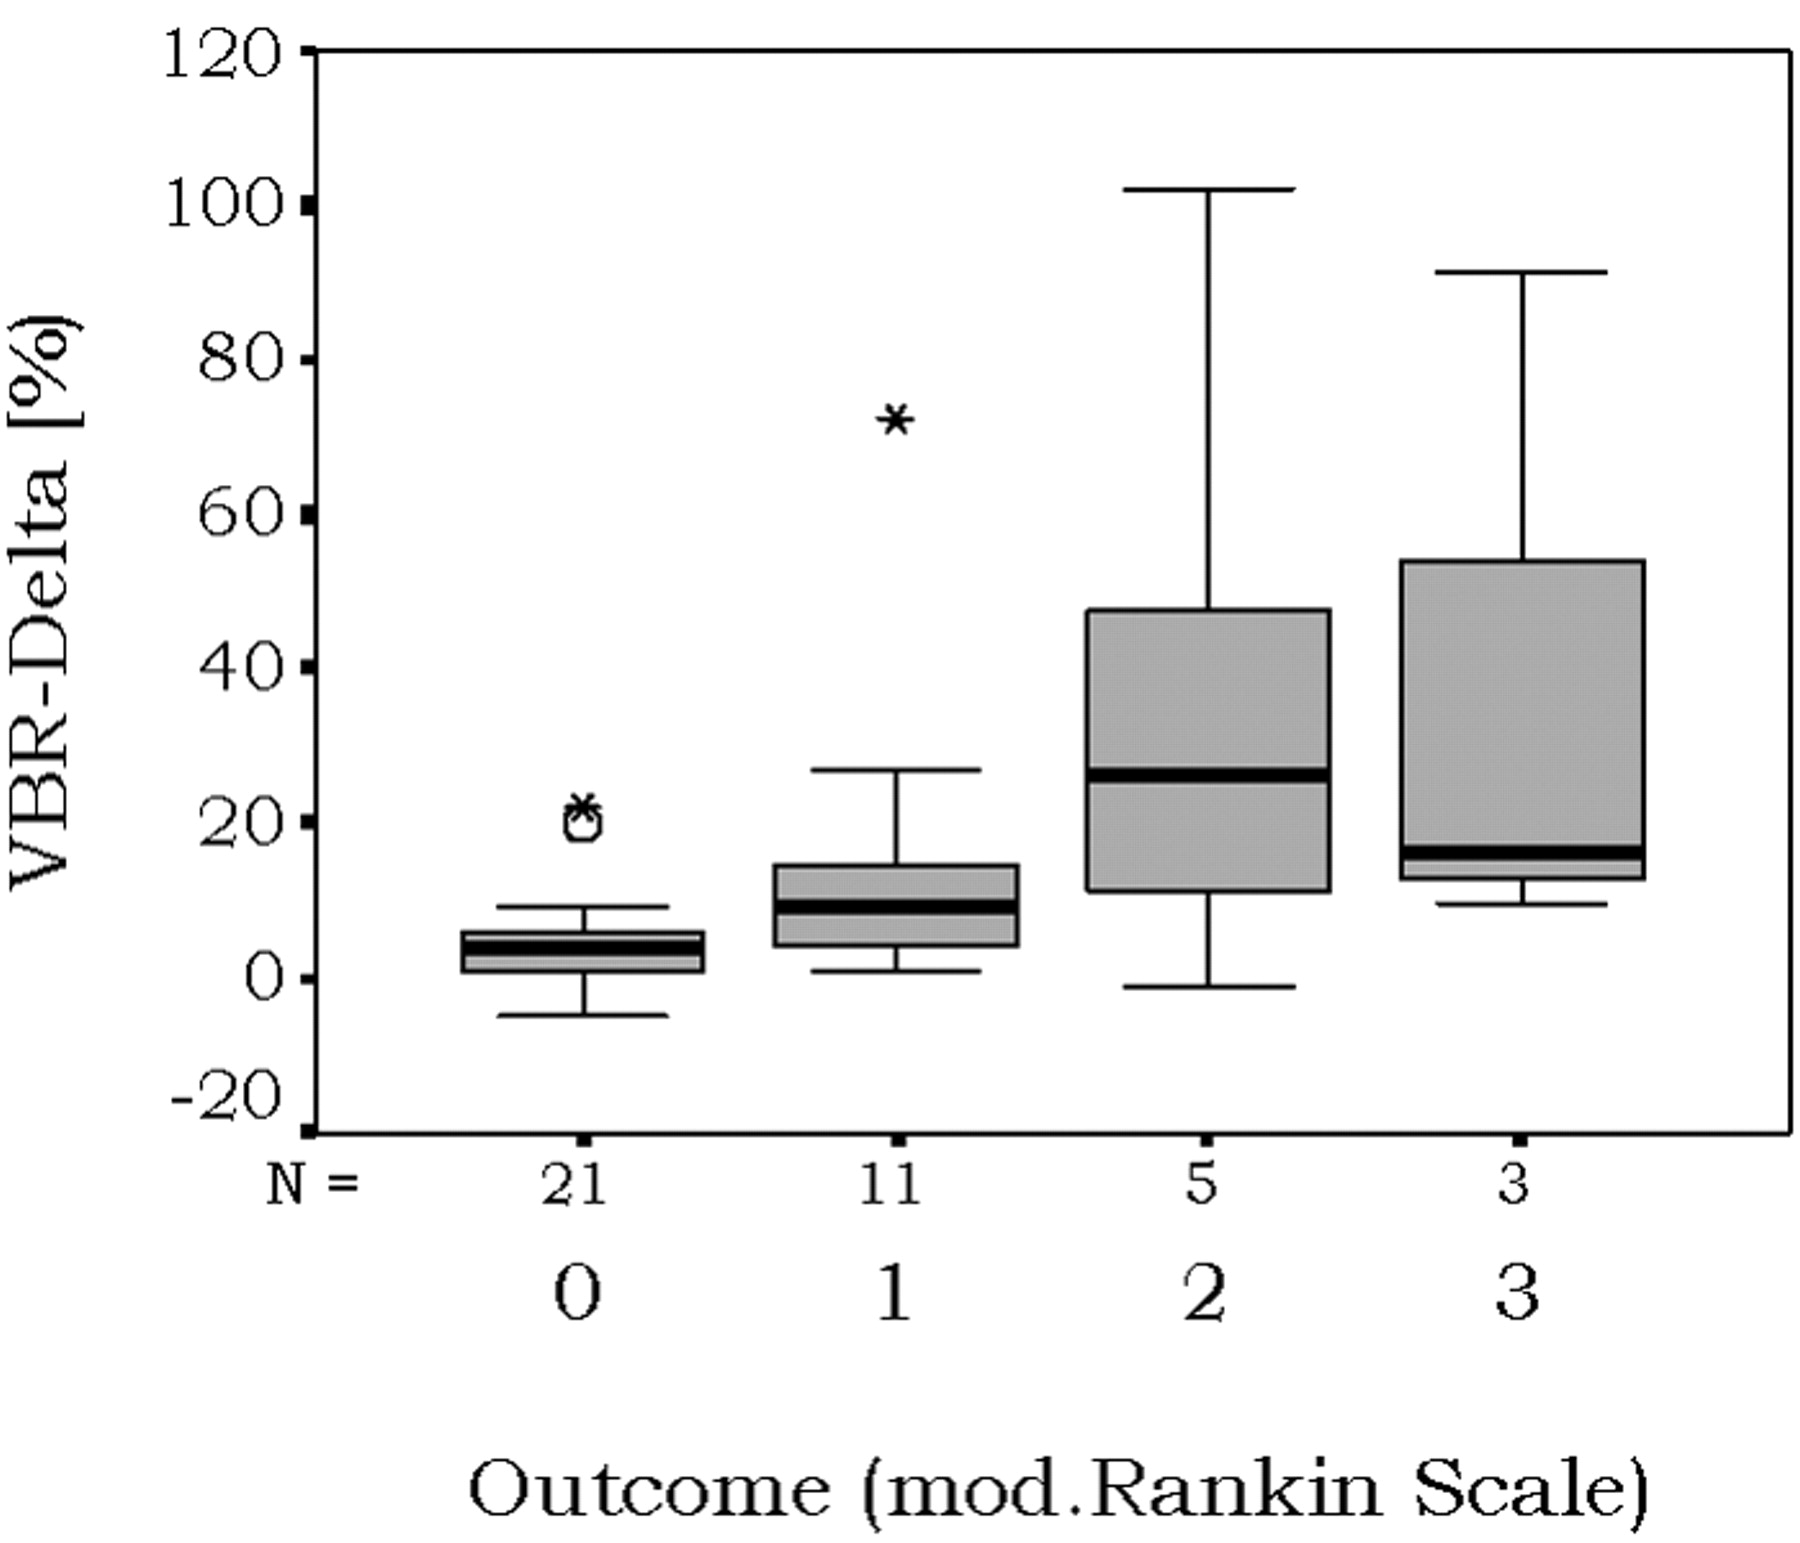
Thirty-seven of the 40 evaluated patients had rank 0–2 on the encephalitis-adapted modified Rankin Scale at follow-up and were, therefore, categorized into the “favorable outcome” group. Table 2 shows the exact patient numbers for each rank. Because of the small number of patients with unfavorable outcome (n = 3, rank 3–5) in our study group, a statistical analysis regarding VBR delta differences between patients with favorable and unfavorable outcomes was not feasible. However, Fig 4 demonstrates that patients with favorable overall outcome tended to display a smaller VBR delta.

Graph shows proportional change of VBR in 40 patients with different outcomes after acute encephalitis. mod. indicates modified.
Discussion
We aimed to quantify cerebral atrophy in the long-term outcome after acute encephalitis of various causes. Additional objectives were to define which initial or long-term clinical factors are associated with parenchyma loss and to search for any correlate in global clinical outcome measures.
As for the effects of encephalitis in humans, there is a limited number of reports from MR imaging follow-up studies about the development of cerebral atrophy following HSE—presenting as enlargement of 1 or both lateral ventricles, cortical atrophy, and pseudocystic changes or atrophy also beyond the structures affected by the encephalitic changes.2,3,22 The judgment that the size of the ventricles and the width of the subarachnoid space are within normal limits by visual inspection alone is always subjective and is based on experience.23
Change of VBR Between Disease Onset and Follow-Up
Statistical analysis yielded a significant difference between the VBR values of the acute encephalitic stage and the follow-up VBR (P < .001), with greater values at follow-up and a VBR delta median of 5.93%. Several potential influencing factors must be taken into account for the interpretation of these results: First, the increase in VBR does not necessarily correspond to a global loss of parenchyma but could also be due to focal cerebral lesions. However, the VBR delta of the 13 patients with focal pathologic MR imaging findings during acute encephalitis did not differ significantly from the VBR delta of the patients with a normal MR imaging at disease onset, nor was it significantly different between patients with focal pathologic MR imaging findings at follow-up and patients with normal follow-up MR imaging findings.
Second, in some cases, there may have been brain edema with compression of the ventricles during the acute stage, whose remission could simulate a pathologic ventricle enlargement compared with the first measurement.
Third, physiologic aging has contributed to the increase in VBR during a given time and is difficult to differentiate from pathologic atrophy.15 We did not have a healthy control group in whom age-associated normative values for VBR or normative values for VBR delta at a certain age and during a certain time period could have been assessed. CT and MR imaging studies concerning the age-associated volume of the brain in normal persons found a reduction in total brain volume and an increase in total ventricular volume and/or in volumetrically determined VBR with increasing age.15,21,24–26 There are also data about the rate of change of the volumetrically determined VBR in healthy controls27 and about the rate of change of the volume of the lateral ventricles.21 All these data, however, cannot be applied as normative for a planimetrically determined loss of parenchyma as needed in this study because of the different methodical approaches of the studies.
Correlation Between VBR Results and Age, Time Between Disease Onset and Follow-Up, and Sex
We found a small but significant positive correlation between the age and the VBR at disease onset (Spearman r = 0.286, P = .022), which one would expect on the basis of the previously cited study data.15,21,24,26 At follow-up, no correlation between these 2 variables was seen. At least for some patients, the VBR seems to have increased independently of the normal aging processes, resulting in a disappearance of the normal association between age and VBR at follow-up.
On the basis of the previously cited literature data, one would also expect an increase in VBR delta with the number of months between both MR imaging examinations. However, CT and MR imaging studies indicated an overall nonlinear, from 60 years onwards25 or from the fifth decade in men and the sixth decade in women onwards,15 exponential increase in lateral ventricle volume. Age, therefore, is an additional factor influencing the VBR delta, given a certain latency. Neither for age nor for latency alone, did we find a correlation with the VBR delta. This is probably due to the fact that in our study group, age and latency had a broad range. Because of the lack of normative data, it is impossible to determine which part of the VBR delta can be explained by the age-associated VBR increase at the given age and during the given latency and which part could be due to the encephalitis or phenomena associated with the disease.
Our study did not yield a significant sex difference in VBR measurements or VBR delta. This is in accordance with results of former studies.21,28 In contrast, other authors found significant sex differences in aging processes, with men usually demonstrating greater age-associated changes, even after correction for head size.15, 28,29
Association Between VBR Delta and Clinical Aspects of the Encephalitis
The subgroups of patients who required treatment in an ICU (P = .027), had more than 2 epileptic seizures or status epilepticus during the acute stage (P = .021), or who developed postencephalitic epilepsy (P = .015) differed significantly in change in VBR from their respective counter-subgroups. As stated in the Results section, these factors partially overlap. We could not find an association between the change in VBR and a specific etiologic agent or other clinical factors. Diabetes, alcoholism, hypertension, coronary artery disease, or arterial hypertension—factors known to influence brain size18,21—were not present in the 3 subgroups named previously, and steroid medication was administered in 3 of the patients treated in the ICU for only a very short time during the acute illness. Therefore, these factors did not contribute to the patients’ parenchyma loss. Smoking—another factor potentially influencing the rate of cerebral atrophy—was not systematically taken into account.
Keeping in mind the limitations of our method, we believe that these results indicate that status epilepticus or repeated epileptic seizures and/or postencephalitic epilepsy are risk factors for a greater brain parenchyma loss. Many animal studies give evidence for a measurable neuronal loss after pharmacologically induced status epilepticus.30,34 For humans, neuropathologic and MR imaging follow-up studies after status epilepticus demonstrate parenchyma loss in the hippocampus35–38 as well as in other cerebral regions, such as the thalamus, striatum, claustrum, cerebellum, and/or cerebral cortex.39–47 A possible mechanism for the neuronal damage induced by status epilepticus is an excessive release of glutamate, finally causing cell death.34,48,49
It is also still disputed whether repeated brief epileptic seizures can lead to measurable progressive neuronal damage.50–54 A recent serial MR imaging study demonstrated focal and generalized neocortical atrophy in patients with chronic epilepsy.55 The development of a focal, but also partially diffuse cerebral atrophy in patients with postencephalitic epilepsy (with mostly complex-partial seizures), has already been described in a study with 42 patients.56 Most of these patients (79%), however, had several epileptic seizures or a status epilepticus in the acute stage of the encephalitis as well. For the patients in our study, we cannot differentiate for certain if either the initial status epilepticus or postencephalitic epilepsy is the risk factor for greater parenchyma loss.
We did not find an association between the value of measurable parenchyma loss and a specific etiologic agent, the severity of consciousness impairment, or other clinical factors indicating the severity of the acute disease. Neither did a pathologic MR imaging finding at disease onset have a predictive value for the later development of cerebral atrophy. In conclusion, in this study group, parenchyma loss following encephalitis was associated with the occurrence of epileptic seizures induced by the encephalitic disease, an effect possibly reinforced by further occurrence of epileptic seizures after the acute stage.
Association Between VBR Delta and Global Clinical Outcome
There is a selection bias in the patient sample under-representing those with unfavorable outcome (rank 3–5 on the encephalitis-adapted modified Rankin Scale) because they were only exceptionally able to come to the hospital for MR imaging studies. Statistical analysis was not possible because of the small patient number in this group, but our data indicate that an unfavorable global clinical outcome—meaning a greater global functional deficit and higher dependency in activities of daily living—tended to be associated with a greater parenchymal loss (Fig 4).
Conclusion
We were able to demonstrate that more than 2 epileptic seizures or a status epilepticus during the acute stage of the encephalitis is associated with a greater loss of parenchyma following encephalitis of various causes. It will be the task of future studies to examine in greater detail the mechanisms of cerebral parenchyma loss that is associated with encephalitis-induced epileptic seizures or status epilepticus.
Acknowledgments
We thank all patients participating in this study and Bianca Müller, Heike Salpeter, Jutta Junghans, Dorothee Kubisch, and Karl-Titus Hoffmann for their continuous support regarding the technical aspects and the organization of this study as well as Gerda Siebert for her statistical supervision.
References
- Received March 13, 2005.
- Accepted after revision October 11, 2005.
- Copyright © American Society of Neuroradiology


