
Article Figures & Data
Figures
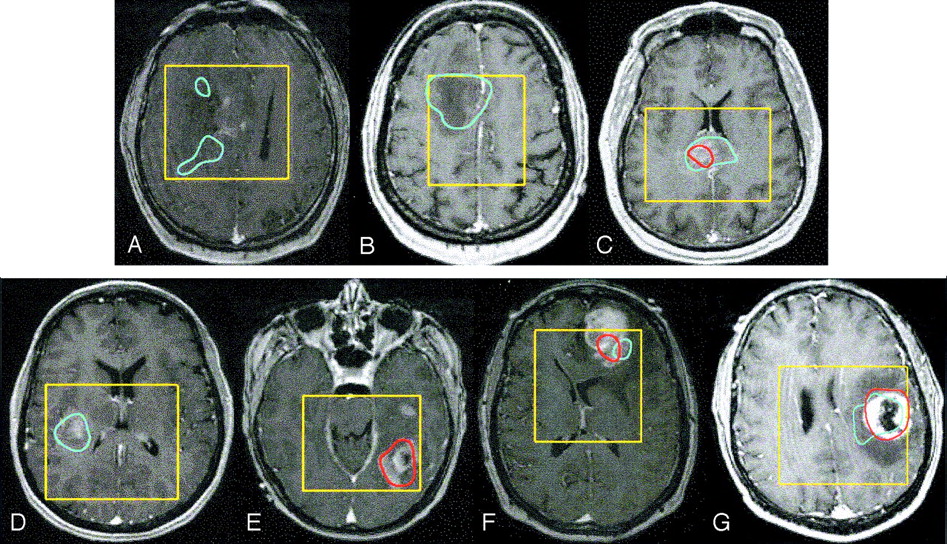
- Fig 1.
Spatial distribution of elevated Lac and Lip presented as contours overlaid on contrast-enhanced T1-weighted images in presurgical patients with the following tumors: grade II glioma with Lac within the T2 hyperintensity but out of the contrast enhancement (A), nonenhancing grade III glioma with only elevated Lac (B), enhancing grade III glioma with elevated Lac and Lip (C), grade IV glioma with only elevated Lac (D), grade IV glioma with only elevated Lip (E), grade IV glioma without macronecrosis but with elevated Lac and Lip (F), and grade IV glioma with ring enhancement and a necrotic core with elevated Lac and Lip (G). Blue = Lac contours, red = Lip contours, yellow = PRESS box.
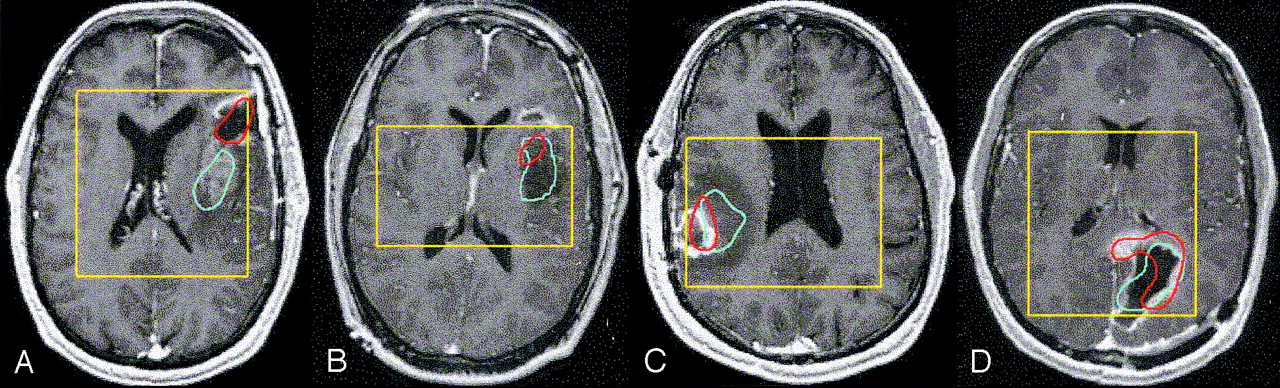
- Fig 2.
Spatial distribution of elevated Lac and Lip presented as contours overlaid on contrast-enhanced T1-weighted images in postsurgical patients with the following tumors: grade II glioma with Lip within the resection cavity and Lac within the contrast enhancement (A), grade II glioma with Lac and Lip within the nonenhancing region (B), grade IV glioma with Lip within the resection cavity and contrast enhancement and Lac in the enhancement and extended to the nonenhancing region (C), and grade IV glioma with Lac within the resection cavity and Lip partly in the resection cavity and mainly in the contrast enhancement (D). Blue = Lac contours, red = Lip contours, yellow = PRESS box.
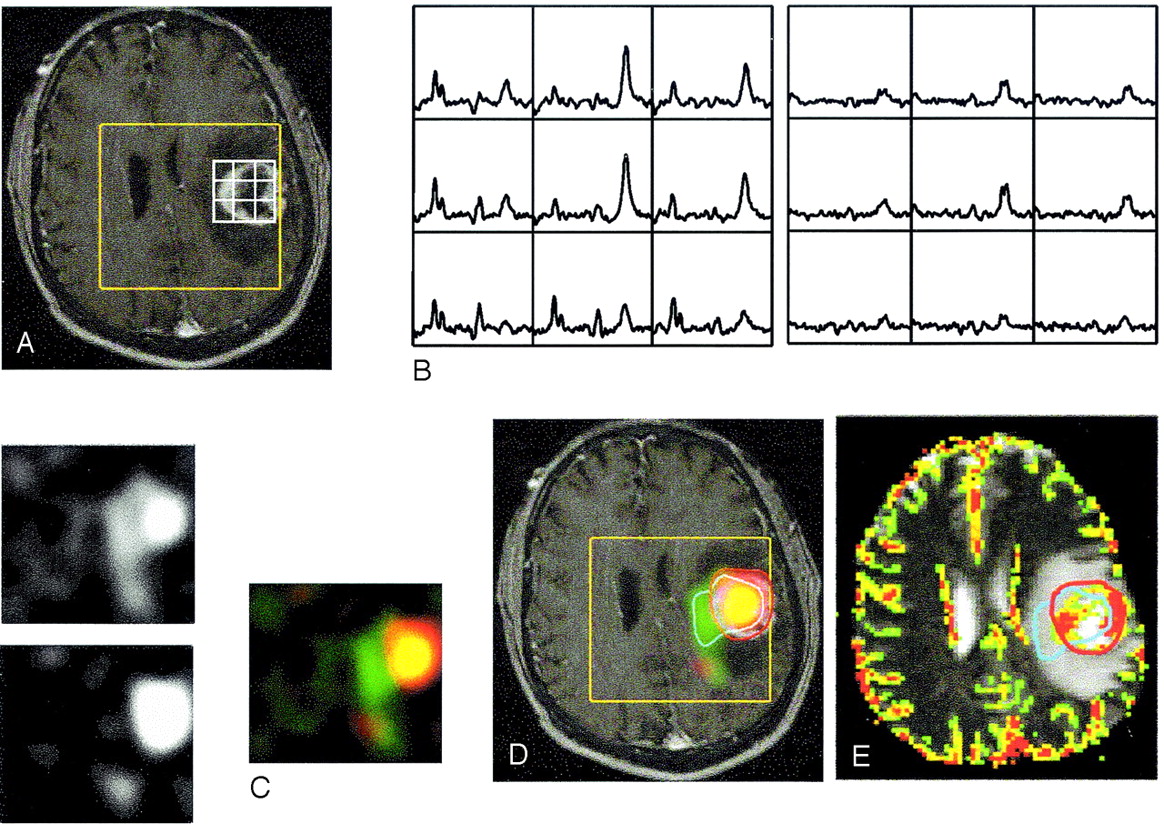
- Fig 3.
Images in a 59-year-old woman with nonenhancing infiltrative grade III glioma in the right frontal lobe with a highly elevated Lac level and increased rCBV before surgery: post-contrast T1-weighted image with an overlying PRESS box and voxel grid (A); difference spectra showing huge, elevated Lac peaks (B); Lac image overlaid on the post-contrast T1-weighted image (C), and rCBV (color) overlaid on the post-contrast T1-weighted image (D). White = PRESS box, blue = Lac contour.
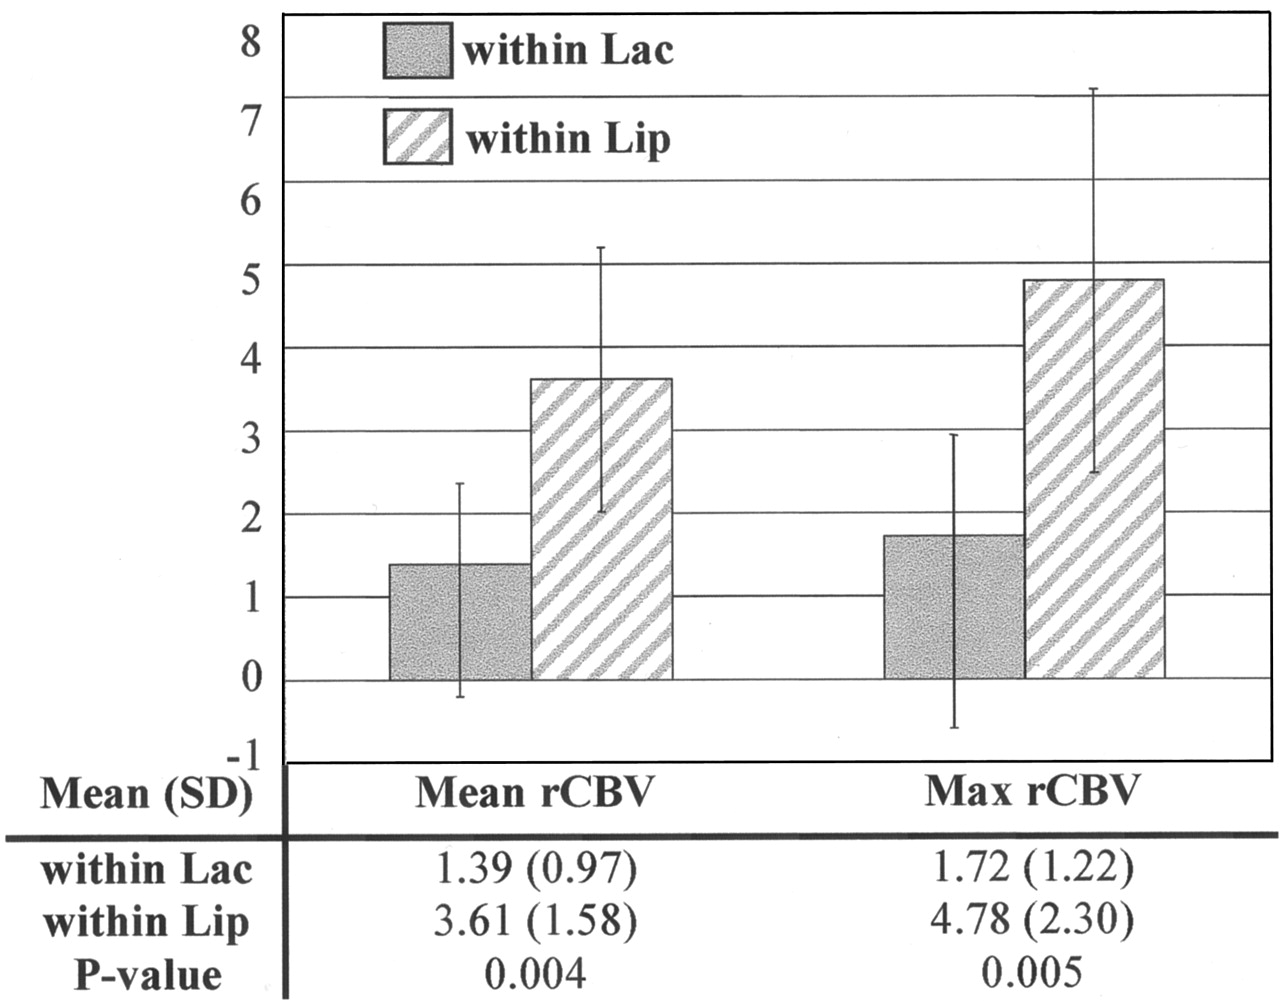
- Fig 4.
Mean, SD, and maximal (Max) rCBV in regions of elevated Lac but no Lip (within Lac) and in regions with elevated Lip but no Lac (within Lip) for six presurgical grade IV tumors with both elevated Lac and Lip. Both mean and maximal rCBV within Lac were significantly lower than those within Lip.
- Fig 5.
Images in a 49-year-old man with grade IV glioma in the left frontal lobe. Presurgical data show increased mean and maximal rCBV within regions having elevated Lac but no Lip and within regions having elevated Lip but no Lac: contrast-enhanced T1-weighted images with PRESS box (yellow) and part of the voxel grid (white) (A); spectra showing the summed spectra for Cho, Cr, NAA, and elevated Lip (left) and difference spectra showing elevated Lac (right) (B); resampled metabolic images show Lac (upper left), Lip (lower left), and the color overlays (right) for elevated Lac only (green), Lip only (red), and both (yellow) (C); Lac and Lip overlaid on T1-weighted images (D); and rCBV overlaid on T2-weighted images with contours for significantly elevated Lac (blue) and Lip (red) (E).
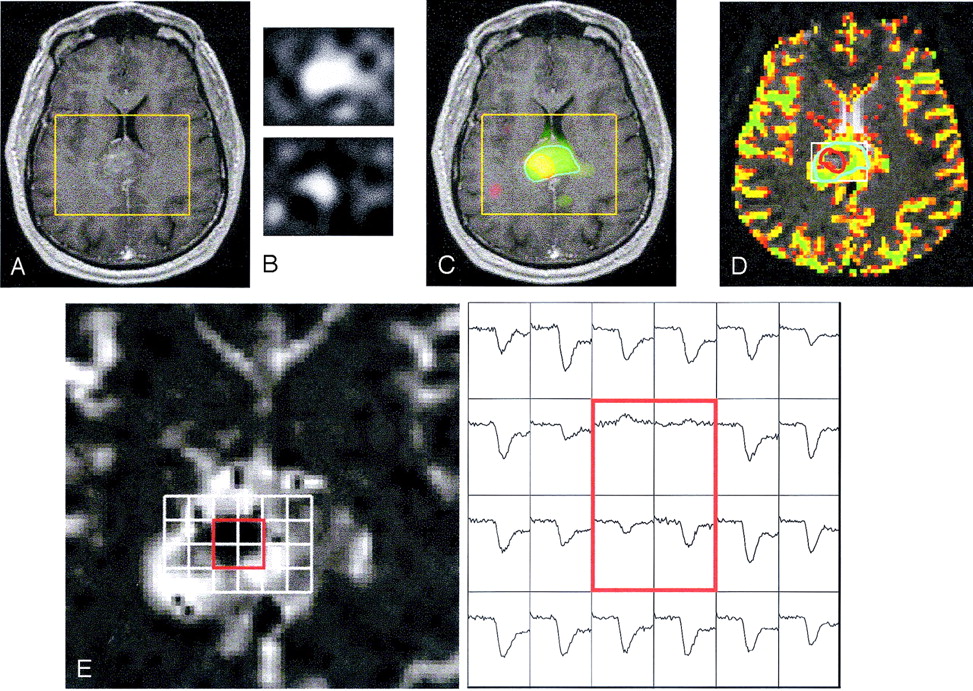
- Fig 6.
Images in a 45-year-old man with enhancing grade III glioma involving the splenium of the corpus callosum. Presurgical data show elevated Lip in the center of the region with elevated Lac: T1-weighted image showing contrast enhancement but no macronecrosis (A); resampled Lac (upper) and Lip (lower) images (B); Lac (green), Lip (red), and both (yellow) overlaid on a T1-weighted image (C); rCBV overlaid on a T2-weighted image with contours for elevated Lac (blue) and Lip (red) (D); and rCBV curves for voxels in the contrast enhancement (E). Dynamic signal intensity curves for voxels (red square) suggest necrosis, which is consistent with elevated Lip peaks.


Tables
Acquisition Time (min:sec) SNR Phantom Cubic 38:24 53.85 Ellipsoidal 17:12 65.53 Volunteer Cubic 38:24 13.77 Ellipsoidal 17:12 15.69 Value Presurgical Tumor Grade Postsurgical Tumor Grade II (n = 7) III (n = 5) IV (n = 11) II (n = 11) III (n = 2) GBM (n = 14) Lac Present* 1 (14.3) 3 (60.0) 9 (81.8) 4 (36.4) 0 11 (78.6) Volume (mL)† 6.69 12.32 (1.01–29.85) 3.74 (1.93–39.15) 7.48 (1.39–11.75) NA 3.24 (1.31–18.17) Lip Present* 0 1 (20.0) 9 (81.8) 5 (45.5) 0 7 (50.0) Volume (mL)† NA 2.45 12.48 (1.41–48.52) 4.87 (1.42–16.89) NA 5.01 (1.17–17.31) Note.—NA indicates not applicable.
* No. of gliomas with elevated Lac or Lip/total no. gliomas in each grade. Data in parentheses are percentages.
† Median (minimum − maximum) for gliomas with elevated Lac or Lip values. Data in parentheses are ranges.
- TABLE 3:
Spatial localization of elevated Lac and Lip levels compared with morphologic abnormalities before surgery
Patient Pathology Elevated Lac Elevated Lip Macronecrosis CE T2-CE Macronecrosis CE T2-CE 1 A2 No No No No No No 2 OD2 No No No No No No 3 OA2 No No No No No No 4 OD2 No No No No No No 5 OD2 No No No No No No 6 OD2 No No Yes No No No 7* OD2 No No No No No No 18 AA3 No Yes No No Yes No 19 AA3 No Yes No No No No 20 OD3 No No No No No No 21* AA3 No No No No No No 22* OD3 No No Yes No No No 23 GBM Yes Yes No Yes Yes No 24 GBM No Yes No No No No 25 GBM Yes Yes Yes Yes Yes No 26* GBM No No No Yes Yes No 27* GBM No Yes No No Yes No 28* GBM No Yes No No No No 29* GBM Yes Yes No Yes No No 30* GBM Yes No No Yes Yes No 31* GBM Yes Yes Yes Yes Yes No 32* GBM No No No Yes Yes No 33* GBM Yes Yes No Yes Yes No Note.—Data before surgical resection or biopsy. CE indicates contrast enhancement; T2-CE, regions within T2 hyperintensity but outside contrast enhancement.
* Patients with both presurgical and postsurgical data.
- TABLE 4:
Spatial localization of elevated Lac and Lip levels compared with morphologic abnormalities after surgery
Patient Pathology Elevated Lac Elevated Lip Resection Cavity CE T2-CE Resection Cavity CE T2-CE 7* OD2 No No No No No No 8 A2 No No No No No No 9 A2 No No No No No No 10 OD2 No No No No No No 11 OD2 No No No No No Yes 12 OD2 No No No Yes No No 13 OA2 No No Yes No No No 14 OA2 No No No No No No 15 A2 Yes No No Yes Yes No 16 A2 Yes Yes Yes Yes No No 17 A2 No No Yes No No Yes 21* AA3 No No No No No No 22* OD3 No No No No No No 26* GBM Yes No No Yes No No 27* GBM Yes No No No No No 28* GBM Yes Yes Yes Yes Yes No 29* GBM No No No Yes No No 30* GBM No No No No No No 31* GBM Yes No No No No No 32* GBM Yes No No No No No 33* GBM Yes No No No No No 34 GBM No Yes No No Yes No 35 GBM Yes Yes Yes Yes Yes No 36 GBM No No No No No No 37 GBM Yes No No Yes Yes No 38 GBM Yes No No No Yes No 39 GBM Yes Yes No No No No Note.—Data after surgical resection or biopsy but before radiation treatment or chemotherapy. CE indicates contrast enhancement; T2-CE, regions within T2 hyperintensity but outside contrast enhancement; A2, grade-II astrocytomas; OA2, grade-II oligoastrocytomas; OD2, grade-II oligodendrogliomas; AA3, grade-III anaplastic astrocytomas; OA3, grade-III oligoastrocytomas; OD3, grade-III oligodendrogliomas.
* Patients with both presurgical and postsurgical data.


