
Abstract
BACKGROUND AND PURPOSE: In vivo1H MR spectroscopy demonstrates elevated choline (Cho)/creatine (Cr) and myo-inositol (MI)/Cr in many neurologic diseases that has been ascribed to gliosis. We tested the hypotheses that in vivo Cho/Cr and/or MI/Cr levels are correlated with glial fibrillary acidic protein (GFAP) immunostains and that the changes are water-soluble metabolites.
METHODS: We performed postmortem 1H MR spectroscopy and GFAP immunohistochemistry in brains from seven rhesus macaques acutely infected with simian immunodeficiency virus (SIV) and in four controls and compared the findings with previous in vivo MR spectroscopic results. Changes in neuropathologic and MR spectroscopic markers after infection and relationships among plasma viral load, GFAP immunostaining results, and ex vivo and in vivo MR spectroscopic measures were statistically evaluated.
RESULTS: On GFAP immunostaining and in vivo MR spectroscopy, GFAP, Cho/Cr and MI/Cr were highest near the time of peak plasma viral load at 11 days postinfection (dpi). Immunostains returned to baseline by 14 dpi, whereas Cho/Cr and MI/Cr had different time courses, with the former dropping below baseline and the latter remaining elevated. Viral load and immunostains were significantly correlated. No correlation was found between ex vivo Cho/Cr or MI/Cr and viral load or between metabolite ratios from in vivo and ex vivo MR spectroscopy.
CONCLUSION: In acute SIV infection, plasma viral load was significantly correlated with brain GFAP immunostains and in vivo 1H MR spectroscopic Cho/Cr. In vivo changes in Cho/Cr and MI/Cr were principally due to contributions other than those of low-molecular-weight water-soluble metabolites.
Brain 1H MR spectroscopic studies of a large number of neurologic maladies frequently demonstrate elevations of the resonances commonly referred to as choline (Cho) and myo-inositol (MI). In the case of neoplasia, a great deal of effort has been expended in understanding the underlying biochemistry and pathology of these elevations. In other diseases, increases in the signal intensity from these resonances are attributed to gliosis primarily because this type of neuropathology occurs in the same diseases. However, the relationship between the pathologic changes and MR spectroscopic findings is poorly documented, possibly because of a lack of suitable animal models.
In a previous study of neuro-AIDS involving a macaque model infected with the simian immunodeficiency virus (SIV) and in vivo 1H MR spectroscopy, we reported unexpectedly large, stereotypic, and transient changes in the levels of Cho/creatine (Cr) and MI/Cr in the frontal cortex during the first month of infection (1). These unexpected findings presented the opportunity to probe the relationship between gliosis, if present, with those brain metabolites frequently associated with gliosis in the MR spectroscopy literature. This model could potentially allow us to better understand these potential relationships by permitting the comparison of in vivo levels of Cho/Cr and MI/Cr with postmortem quantitative measurements of glial fibrillary acidic protein (GFAP) immunostaining, the most commonly used neuropathologic marker of astrogliosis (2–4).
This model offered the further opportunity to help clarify our understanding of brain MR spectroscopy. It is well known that all or nearly all of the brain resonances detected with 1.5-T 1H MR spectroscopy arise from contributions of at least two metabolites. This is the natural result of the relatively poor spectral resolution available at 1.5 T and the many brain metabolites that resonate at similar frequencies. The Cho resonance, for example, has contributions from choline, glycerophosphorylcholine, phosphorylcholine, and probably other metabolites. Furthermore, macromolecules also contribute to the in vivo brain MR spectroscopic spectrum. Having access to postmortem tissue would make the chemical extraction of the brain possible and potentially allow us to define the precise metabolites responsible for the elevations in Cho and MI that are often observed in the course of many neurologic diseases.
Our previous reports were based on a prospective, longitudinal, in vivo 1H MR spectroscopic study of 15 SIV-infected macaques conducted over several years. Animals were euthanized at predetermined set points by using limited preliminary data and educated conjecture. At the conclusion of that study, we found that Cho and MI changes dramatically over a period of days during the first month of SIV infection and that peak elevations in Cho and MI coincide with peak viremia, which occurs at about 11 days after inoculation. Although all animals were scanned at least twice during the first month, only four were euthanized during this period (three at 14 days post infection [dpi] and one at 28 dpi). Unfortunately, the time of peak effect did not coincide with the predetermined times of euthanasia. To overcome this circumstance but still benefit from this valuable resource, three animals were infected and sacrificed at the time of peak viremia. An additional four animals were euthanized without being infected to serve as controls.
Samples from the frontal cortex underwent a quantitative evaluation of GFAP. High-resolution 1H MR spectroscopy at 14.1 T was performed on extracts from adjacent frontal cortex samples. The postmortem results were compared with each other and with the in vivo results. The experiments were designed to test the following hypotheses: 1) In vivo levels of Cho/Cr and/or MI/Cr are directly correlated with results on GFAP immunostaining, and 2) changes in specific water-soluble metabolites account for the changes in Cho/Cr and MI/Cr observed in vivo.
Methods
Animals
All animals were housed according to the standards of the American Association for Accreditation of Laboratory Animal Care. Investigators abided by the Guide for the Care and Use of Laboratory Animals of the Institute of Laboratory Animal resources, National Research Council. Both the Massachusetts General Hospital Subcommittee on Research and Animal Care and the Institutional Animal Care and Use Committee of Harvard University approved all studies reported herein. As previously described (1), we performed in vivo 1H MR spectroscopic studies in 15 rhesus macaques (Macaca mulatta) that were divided into three cohorts of five animals each. The first cohort was imaged before inoculation with SIVmac251 and at 11 and 25 dpi, and the second cohort was imaged before inoculation and at 13 and 27 dpi. The third cohort was imaged before inoculation and at 13 dpi. Four of the macaques were euthanized for postmortem studies (ex vivo MR spectroscopy and quantitative neuropathology), the results of which are reported herein. The four included one animal from the 0- to 13–27-dpi cohort and three from the 0–13-dpi cohort; the one was euthanized at 28 dpi, whereas the three were euthanized at 14 dpi.
We included an additional three macaques that were infected and euthanized at 12 dpi after, as well as four uninfected control animals. All animals were infected with SIVmac251, as previously described (5). Therefore, a total of 11 animal brains underwent postmortem evaluation, including those of four uninfected control macaques, three euthanized at 12 dpi, three at euthanized 14 dpi, and one at euthanized 28 dpi.
The Table describes the MR spectroscopic experiments performed in all animals.
MR spectroscopic experiments
Viral Load Determinations
Peripheral blood was collected from all animals before their inoculation and at days 11, 12, 14, and 28 of the infection. Virion-associated SIV RNA in plasma was quantified by using a real-time reverse-transcription polymerase chain reaction with a sequence detection system (Prism 7700; Applied Biosystems, Foster City, CA) (6, 7). Results were averages of duplicate determinations. Drs Jeffrey Lifson and Michael Piatak (National Cancer Institute) performed analyses of the viral RNA levels at Science Applications International Corporation (Frederick, MD).
Necropsy and Preparation of Tissue Samples
Animals were sacrificed by means of an intravenous overdose injection of sodium pentobarbital. Necropsy immediately followed euthanasia. Brain tissue was harvested in blocks, which were wrapped in foil then snap-frozen by immersing them in 2-methylbutane/dry ice and stored at −70°C. This frozen tissue was then processed and analyzed by means of 1H MR spectroscopy. Tissues adjacent to those samples were collected, fixed in 10% neutral-buffered formalin, embedded in paraffin, and sectioned at 5 μm for routine histology and quantitative neuropathology.
Brain Extracts
Extraction of brain tissue was performed by using methanol/chloroform, as previously described (8) and modified for small samples. We filled impact-resistant, 2-mL, screw-cap tubes containing lysing matrix D (FastRNA Green/Biopulverizing System I; Q-Biogene Inc, Carlsbad, CA) specifically designed for the cell disrupter (FastPrep FP 120; Thermo-Savant, Holbrook, NY) with 1.2 mL of methanol and a tissue sample of 40–80 mg. The cell disrupter was used to pulverize the sample tissue. The tube was placed in a centrifuge (3 minutes at 9000 rpm), and 0.8 mL of the solution was placed into a 15-mL centrifuge tube. Water (0.8 mL) was added to the tube, which was then placed into the cell disrupter and subsequently centrifuged. After 1 mL of the solution was removed, the extraction was repeated a third time with 1 mL of chloroform. All extracted solutions and contents of the tube were placed in the 15-mL centrifuge tube. The 2-mL tube was rinsed with 1 mL chloroform, 0.8 mL methanol, and 0.2 mL water. All rinses were combined with the extracted solutions in the 15-mL centrifuge tube. After we centrifuged the mixture for 8 minutes at 3000 rpm, the resulting water-soluble metabolic solution was removed, placed into a Speedvac Concentrator (Thermo-Savant, Holbrook, NY), and dried at 40°C for the first 2 hours followed by 8 hours at room temperature. The remaining residue was dissolved in 600 μL of D2O.
High-Resolution 1H NMR Studies
High-resolution 1H NMR studies were preformed (Avance 600-MHz spectrometer; Bruker Instruments, Inc., Billerica, MA) by using a 5-mm probe. A one-pulse experiment was used with spectral acquisition parameters including a 90° pulse length of 9 μs; recycle delays of 20 seconds; a spectral width of 7.2 kHz; 32,000 complex points; and 64 scans, which were averaged. All spectra were processed off-line with a spectral analysis program (Peak Research NMR Software; PERCH Solutions, Ltd. Kuopio, Finland), and used to determine the ratio of MI (δ 3.61 ppm) or Cho-containing compounds (δ 3.18–3.21 ppm), to Cr compound (δ 3.03 ppm).
Quantitative Neuropathology
The degree of reactive astrocytosis was assessed with the monoclonal anti-GFAP antibody (1:1000; Boehringer Mannheim, Indianapolis, IN). For this purpose, 5-μm-thick paraffin sections from the frontal cortex of both control and SIV-infected macaques were immunolabeled overnight with these monoclonal antibodies, followed by biotinylated horse anti-mouse immunoglobulin G, avidin–horseradish peroxidase (Vectastain Elite kit; Vector, Burlingame, CA) and reacted with diaminobenzidine tetrahydrochloride and H2O2 (0.03%). Levels of GFAP were estimated by means of computer-aided image analysis, as previously described (9). GFAP immunoreactivity was quantitatively assessed as corrected optical density by using a microdensitometer (Quantimet 570C; Leica Microsystems, Cambridge, UK). For this purpose, three immunolabeled sections were analyzed from each case. Briefly, the system was first calibrated with a set of filters of various densities, and 10 images at 100× magnification were obtained for each section. The area of interest was delineated with the cursor, and the optical attenuation in that area was obtained. The optical attenuation on each image was averaged and expressed as the mean per case. Three sections per case and 10 images per section were obtained. For each case, results representing the number of GFAP-immunoreactive cells per unit area were averaged and expressed as the mean. All sections were coded for blinding, and the code was broken after the results were obtained. All values were expressed as the mean ± the standard error of the mean (SEM).
Statistical Analysis
An analysis of variance was used to determine significant changes in GFAP and MR spectroscopic markers. Least-squares-mean t tests were used to isolate specific significant changes within groups. The spearman rank correlation coefficient was used to determine relationships between spectroscopic markers, plasma viral load, and GFAP results.
Results
Shortly after the animals were infected with SIVmac251, their plasma levels of the virus sharply increased (Fig 1). As the animal mounted an immune response, the plasma viral load decreased by 1–2 logs to the viral set point of approximately 106/mL. Analysis of variance revealed highly significant changes in the plasma viral load of the 11 animals examined at necropsy (P < 10−7). Least-squares-mean t tests were used to isolate significant differences at specific time points. We found a significant increase in viral load between preinfection and 11 dpi (P < 10−9), as well as between preinfection and 12 dpi (P < 10−5). We observed significant declines between 11 and 12 dpi (P < .001), 11 and 14 dpi (P < 10−6) and 12 and 14 dpi (P < .005).

Serum SIV load in rhesus macaque blood during acute infection. Data are from 11 animals used in postmortem examinations. Error bars = SEM.
We previously reported a study in which 15 animals were scanned with in vivo 1H MR spectroscopy before being infected with SIVmac251 and also at 11, 13, 25, and 27 dpi. These animals also had a high peak in plasma SIV load at about 11 dpi, and we observed substantial changes in the levels of cerebral metabolites during the first month after infection (1). MR spectra acquired from the frontal cortex demonstrated significant increases in Cho/Cr (20%, P = .04) and MI/Cr (14%, P = .003) at 11 dpi. At 13 dpi, a 7.7% decrease (P = .02) in NAA/Cr was observed, whereas Cho/Cr was no longer significantly different from baseline. At 27 dpi, Cho/Cr was decreased to 18% (P = .004) below preinoculation values, whereas NAA/Cr and MI/Cr were at baseline values. Absolute concentrations of Cho, MI, and NAA showed a similar time course, with no observed changes in Cr.
Four of 15 animals from the in vivo 1H MR spectroscopic study were euthanized at the predetermined time points of 14 dpi (three animals) and 28 dpi (one animal). The animals were part of a prospective longitudinal study of the effects of SIV infection on the brain, and the remaining animals continued to be imaged at multiple time points for up to 2 years after inoculation (10). The unexpectedly large metabolic changes in the brain that occur during the first month of SIV infection stimulated the additional research that we report here. Because we had not previously euthanized any animals around the time of peak viremia, we proceeded with the inoculation of an additional three animals that were euthanized at 12 dpi, near the time of peak viremia. We also euthanized four animals that remained uninfected to serve as controls. The brains from these 11 animals were analyzed by using neuropathologic and high-resolution MR spectroscopic methods. (The Table provides further clarification of the animals used for the in vivo and ex vivo studies.)
Histopathologic studies of the animals examined at necropsy revealed a striking astrogliosis in the frontal cortex in those euthanized near the time of peak viremia. With nearly equivalent abruptness, a rapid decline in GFAP immunostaining was observed at 14 dpi; the time when the animals’ immune systems asserted significant control of the virus (Fig 2). Quantitative changes in GFAP immunostaining followed temporal trends similar to those of the plasma viral load, but they were distinct from in vivo Cho/Cr and MI/Cr changes during acute SIV infection (Figs 1 and 2). A significantly increased level of GFAP immunostaining was observed in the 12-dpi group compared with controls (P < .004). Levels of GFAP immunostaining were also higher in the 12-dpi group than in 14-dpi group (P < .005), whereas no significant difference was found between control animals and infected animals at 14 dpi. Using the nonparametric Spearman rank correlation, we found a significant correlation between plasma viral load and GFAP immunostaining (Rs = 0.64, P < .05) (Fig 3). In the previously reported in vivo MR spectroscopic study of 15 animals, we found a strong correlation between Cho/Cr change and plasma viral load (Rs = 0.79, P < .01) but observed no significant correlation with MI/Cr (1).

Changes in GFAP immunostaining and in vivo Cho/Cr and MI/Cr after SIV infection. Levels of GFAP were determined by immunohistochemistry. Levels of Cho/Cr and MI/Cr are from 1H MR spectroscopic measurements previously reported (1). Peaks of all three measures were attained at 11–12 days, coincident with peak viremia. Measures then diverge, with GFAP immunostains returning to normal levels by 14 dpi (DPI), MI/Cr remaining elevated, and Cho/Cr decreasing to subnormal levels at 25–27 dpi. Error bars = SEM.

Correlation between frontal cortex GFAP immunostains and plasma viral load was significant (Spearman rank correlation coefficient Rs = 0.64, P < .05).
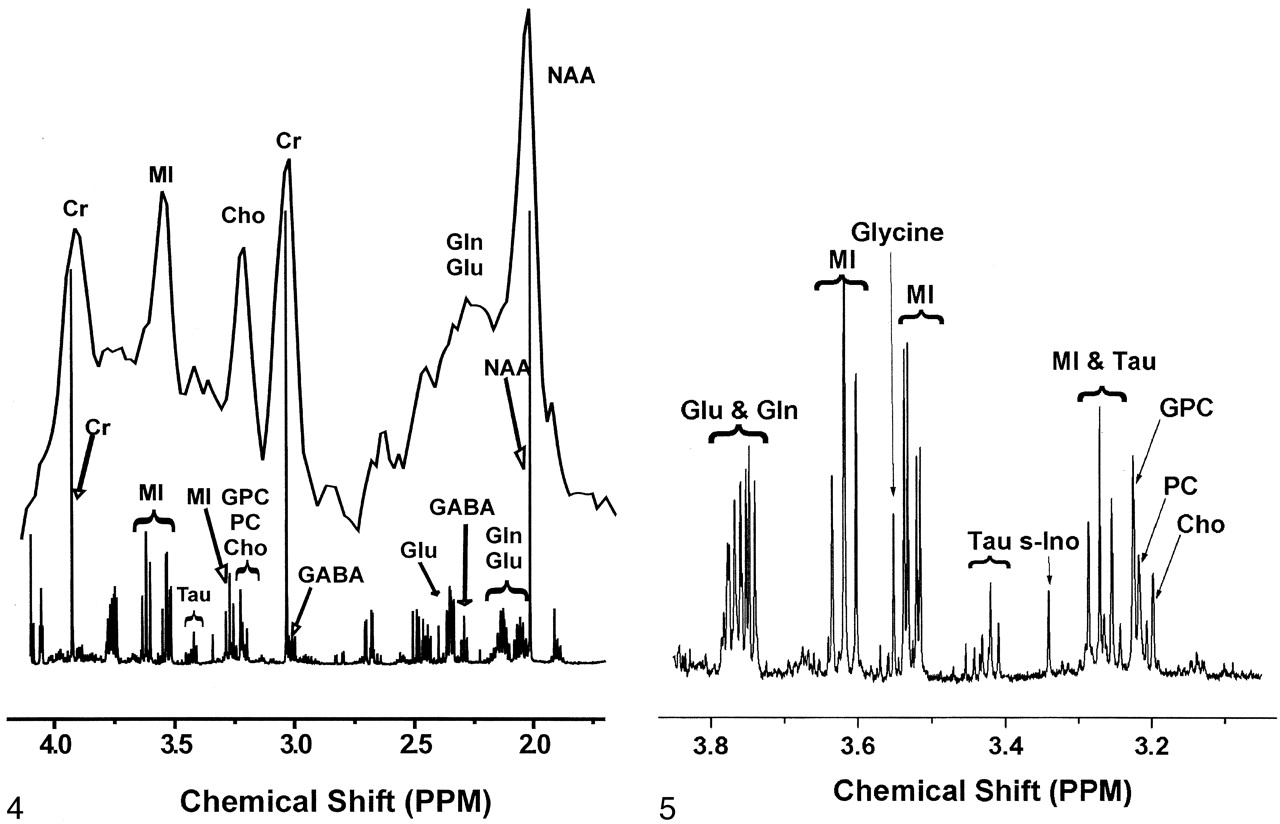
Extracts from the same frontal cortex regions used for quantitative neuropathology were examined with 1H MR spectroscopy at 600 MHz. Figure 4 illustrates the considerable differences in the spectral resolution between the in vivo and ex vivo MR spectra. Figure 5 shows an expanded portion of the high-resolution, brain-extract MR spectrum obtained at 14.1 T and also delineates the resonances that were used for the analyses described later. The Cho contribution was a sum of the trimethylamine resonances from choline, phosphorylcholine, and glycerophosphorylcholine arising between 3.18 and 3.21 ppm. The MI contribution was the triplet located at 3.61 ppm that represented the hydrogens of the hydroxyl groups on carbons 4 and 6. Levels of Cho/Cr and MI/Cr derived from frontal cortex-extract MR spectroscopic measurements were not significantly correlated with plasma viral load. The lack of significant correlation for these and other comparisons might have been due to the small sample size.

In vivo spectrum of control frontal cortex was obtained at 1.5 T (top) and collected with PROBE-P (11) (point-resolved [PRESS] sequence with chemical shift selective [CHESS] water suppression [12, 13], TR/TE/NEX = 3000/35/128). The animal was euthanized, a frontal cortex sample was removed, and metabolites were extracted for ex vivo high-resolution 1H MR study at 14.1 T (bottom). Gln = glutamine, Glu = glutamate, GPC = glycerophosphorylcholine, PC = phosphorylcholine, tau = taurine.

Expanded high-resolution ex vivo 1H MR spectrum of control frontal cortex extract improves delineation of the complex contributions of several water-soluble metabolites designated as MI and Cho on 1.5-T in vivo 1H MR spectra. Gln = glutamine, Glu = glutamate, GPC = glycerophosphorylcholine, PC = phosphorylcholine, s-Ino = scyllo-inositol, tau = taurine.
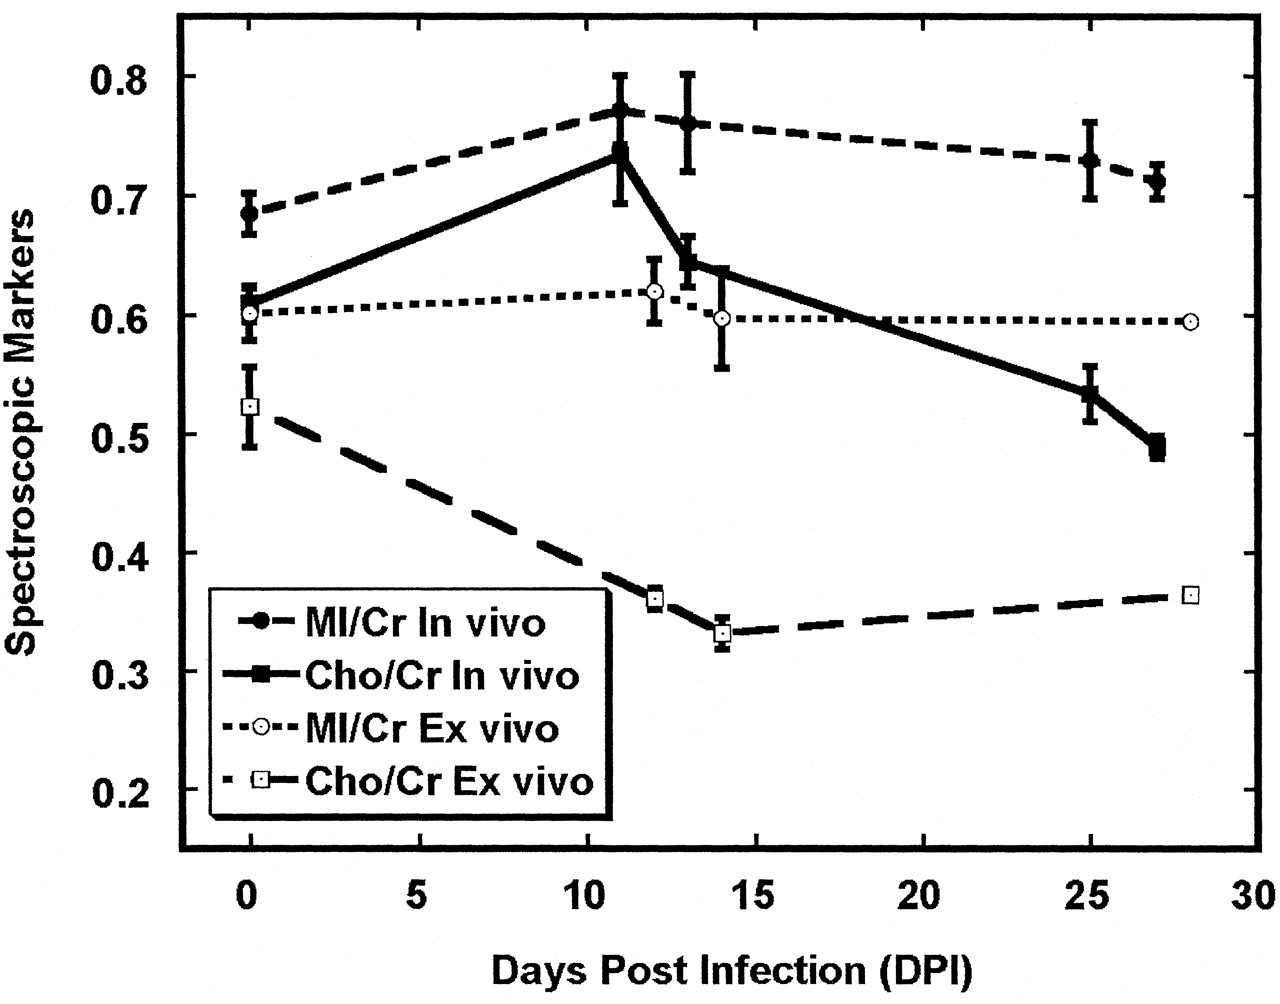
Figure 6 shows the Cho/Cr and MI/Cr ratios derived from extracts of frontal cortex, along with in vivo MR spectroscopic results from the 15 animals that were previously reported (1). Notable differences between in vivo and ex vivo levels of these ratios were clearly apparent. Most conspicuous was the Cho/Cr ratio, which was greater in vivo than ex vivo at all time points. Also notable was a lack of increase in the brain extract Cho/Cr ratio at the time of peak viremia, whereas a significant increase in Cho/Cr was observed with peak viremia during in vivo 1H MR spectroscopy (Figs 2 and 6). Differences between in vivo and ex vivo levels of MI/Cr were also apparent, though not to the degree observed with Cho/Cr. Ex vivo levels of MI/Cr were approximately 15% lower at all time points, as measured from extracts, and we found no significant changes with respect to time after SIV infection.

Comparison of Cho/Cr and MI/Cr in vivo and ex vivo in the frontal cortex after SIV infection. Time course of Cho/Cr in vivo differs from Cho/Cr ex vivo. One possible explanation is that significant changes in the macromolecular contributions to the in vivo MR spectrum occur during infection and that extraction procedure removes these. Differences between in vivo and ex vivo MI/Cr are also apparent although not as dramatic. In vivo data were previously reported (1). Error bars = SEM.
Discussion
An outstanding question in clinical brain 1H MR spectroscopy is the pathobiologic basis of the changes in Cho/Cr and MI/Cr that are frequently observed in a variety of neurologic diseases. The other major resonance observed on 1H MR spectroscopy at 1.5T is NAA, which is well documented as a neuronal marker. Using the SIV-infected macaque model of neuro-AIDS, we documented significant changes in the levels of Cho/Cr and MI/Cr during 1H MR spectroscopy in the first month of infection (1). Thus, the model presented provided an excellent opportunity to probe the relationship between these resonances and the ongoing pathologic changes during this period. We found a profound yet transient astrogliosis that was highly correlated with viremia. We also found that in vivo Cho/Cr levels tended to follow a temporal trend similar to that of plasma virus levels and cortical astrogliosis for the first 2 weeks after infection. However, they subsequently diverged. The in vivo MI/Cr ratio increased with peak viremia but remained elevated despite control of the plasma virus. Of most interest, metabolites thought to be the sources of the in vivo resonances did not change, or they changed in a fashion different from what was observed in vivo. Therefore, other sources must have been contributing to the in vivo 1H MR spectroscopic signals. Those sources, possibly macromolecules, were changing during the dynamic astrogliosis observed in this model.
Histologically, astrogliosis accompanies a large number of neurologic diseases. Astrocytes are characterized by their strong response to diverse neurologic insults. It has been reported that the astroglial response can be detected within 1 hour of mechanical trauma (14). Substantial reactive astrogliosis is observed in a variety of viral infections (including HIV infection), demyelinating diseases, acute traumatic brain injury, neurodegenerative diseases (eg, Alzheimer disease), and others (3). GFAP is the principal intermediate filament in mature astrocytes. It is thought to have key roles in determining astrocyte motility and shape. In response to neurologic insult, astrocytes respond in a fashion termed astrogliosis. Astrogliosis is characterized by rapid synthesis of GFAP and may be recognized by immunostaining with GFAP antibodies (4).
The same diseases that are characterized by astrogliosis, including Alzheimer disease, multiple sclerosis, and traumatic brain injury, may also cause elevations in the Cho/Cr and MI/Cr ratios, as demonstrated in vivo 1H MR spectroscopy (15–24). The relationship is not universal. Although patients with schizophrenia generally have increased Cho/Cr levels, their MI/Cr levels have not been shown to change (25–27), nor has astrogliosis been reported in schizophrenia (28).
MR spectroscopic studies performed at 1.5 T in the frontal lobes of HIV-infected patients demonstrate increased Cho/Cr, (29, 30) increased MI/Cr, (30, 31), and decreased NAA/Cr (29–31). In addition, several MR spectroscopic studies of HIV-infected individuals demonstrated early elevations in Cho/Cr and/or MI/Cr, with decreases in NAA/Cr more commonly observed later in the disease (31–34).
An excellent animal model for understanding the relationship between in vivo 1H MR spectroscopic findings and astrogliosis is the SIV model of neuro-AIDS (35, 36). SIV is a lentivirus with extensive sequence homology with HIV (37, 38). In rhesus macaques, SIV produces a clinical syndrome similar to that of human AIDS (39). Moreover, it results in elevated Cho/Cr and MI/Cr ratios in the frontal cortex during the first month after infection (1). Herein we reported that a profound, but transient astrogliosis occurred during this period; this observation was highly correlated with the amount of SIV in plasma. We also found that the temporal courses of Cho/Cr and MI/Cr were distinct. Our data clearly showed that astrogliosis, as quantified by GFAP immunostaining, was insufficient to explain the changes in brain Cho/Cr and MI/Cr detected in vivo during 1H MR spectroscopy in this model of neuro-AIDS, and possibly in other diseases. Alternatives include microgliosis, leukocyte infiltrates, and possibly even metabolic changes in neurons. A low Cho level may be an indicator of damage to other glial cell types, such as oligodendrocytes rather than astrocytes. We are currently investigating these other possibilities.
Our observations in metabolite extracts from frontal cortex tissues during ex vivo MR spectroscopy at 14.1 T confirm and extend our previous observations in this model (8, 40). The absence of a relationship between the Cho-containing metabolites and MI measured in extracts and the corresponding resonances detected in vivo at scanning before death indicated that other molecules were responsible for the changes observed in these parts of the in vivo 1H MR spectra. The most likely sources are macromolecules or other molecular entities that are removed in the extraction procedure. That these macromolecules substantially contribute to short-echo in vivo 1H MR spectra of the brain is well documented (41–44). However, most of these macromolecules have not been identified. Potential contributors are proteins involved in the astrogliotic process, perhaps macromolecules related to cytoskeletal production. GFAP is the principal protein, a 8–9-nm intermediate filament in mature astrocytes, and undergoes rapid synthesis during astrogliosis (4). Macromolecular changes involving other cell types (microglia, neurons, peripheral immune cells) and even the interstitium may also make major contributions to the MR spectroscopic signal intensity. Further research is required to understand the biochemical basis of the changes in the resonances commonly designated as Cho and MI during in vivo 1H MR spectroscopy of the brain.
Conclusion
In the SIV macaque model of neuro-AIDS, the brain undergoes a profound but transient astrogliosis, as quantified by GFAP immunohistochemistry during the first month of infection, that is correlated with plasma viral load. In vivo 1H MR spectroscopy during this period demonstrated that Cho/Cr and MI/Cr both attain their highest levels coincident with peak viremia and GFAP immunostaining. However, the patterns of these measures diverged as viremia came under immunological control, and GFAP immunostaining did not fully explain the MR spectroscopic changes in the brain. Of interest, solution 1H MR spectroscopic studies of brain extracts revealed an absence of significant changes in the quantities of Cho-containing compounds and MI, which are commonly thought to give rise to the corresponding in vivo resonances. Therefore, changes in the in vivo Cho and MI signals during astrogliosis were primarily due to contributions other than those of low-molecular-weight water-soluble metabolites. One possibility is that changes in macromolecules are related to the response of the brain to acute SIV infection.
Footnotes
Supported by National Institutes of Health grants RR13213 (R.G.G.), NS34626 (R.G.G.), NS30769 (A.A.L.), MH61192 (A.A.L.), MH45294 (E.M.), RR00168-39, P41RR00995, the National Center for Research Resources (P41RR14075), and the Mental Illness and Neuroscience Discovery Institute.
J.P.K. and M.R.L. are co-first authors.
References
- Received March 5, 2004.
- Accepted after revision August 17, 2004.
- American Society of Neuroradiology
In this issue


Jump to section
Related Articles
Cited By...
- No citing articles found.