
Abstract
BACKGROUND AND PURPOSE: MR gradient echo imaging is sensitive to the magnetic susceptibility of different tissue types. The purpose of this study was to investigate the diagnostic potential of MR phase imaging of the human brain.
METHODS: High-spatial-resolution, T2*-weighted, single-echo images were acquired in five volunteers and one patient with a brain tumor on a 1.5T system by applying a 3D, first-order, velocity-compensated gradient echo sequence by using a quadrature transmit-receive head coil. Phase images were reconstructed from the raw data and unwrapped by using a region-growing phase-unwrapping algorithm. Low-spatial-frequency components originating from static background susceptibility effects were removed by high-pass filtering.
RESULTS: Phase images showed excellent image contrast and revealed anatomic structures that were not visible on the corresponding magnitude images.
CONCLUSION: Improved processing of susceptibility-weighted MR phase images offers a new means of contrast for neuroimaging applications.
Phase images contain valuable information that can be used in many MR applications such as phase-contrast angiography (1), blood oxygenation level dependent MR venography (2, 3), the computation of field maps for the geometric correction of echo planar images (EPI; 4) or MR thermometry (5). Although phase information is easily obtained with every imaging sequence, it often remains unused. The main reason for this is the fact that phase is only defined in the range of (−π, +π). Thus, before all further processing steps, phase unwrapping must be applied to the phase images. One common, fast, and easily implemented method is to use a homodyne demodulation reference (6), which operates on the k-space data. The drawbacks of this method are that all information below a certain spatial frequency is lost and that phase unwrapping is not necessarily achieved everywhere in the final reconstructed (3D) image. Regions with a steep phase topography (e.g., tissue-air interfaces) are especially prone to artifacts from incomplete unwrapping. This problem is aggravated by the long echo time (TE) that is necessary for susceptibility-weighted imaging (SWI). Recently, phase-unwrapping algorithms that preserve all phase information have been developed and applied to MR imaging (7–10). The resulting unwrapped phase images allow more flexibility in further processing steps. In the magnitude image, contrast is governed mainly by the intrinsic tissue parameters such as proton density and inherent T1 and T2 or T2* relaxation, whereas the contrast in the phase images depends on differences in local precession frequencies, Δω, which in turn depend on the bulk magnetic susceptibility of the different tissue types or different levels of blood oxygenation. This means that with a single MR measurement one in fact obtains two images that bear independent, nonredundant information. Phase images can thus reveal anatomic structures that remain hardly visible, or even invisible, on magnitude images or combinations of magnitude and phase images, and they bear information on physiological features such as blood oxygenation (11, 12). Strong magnetic field inhomogeneities (e.g., due to imperfect shim or near air tissue interfaces) alter the local resonance frequency, to an extent, which may be much larger than the susceptibility difference between structures such as venous vessels and brain parenchyma. Field variations from imperfect shim or large air-filled cavities, however, usually have low spatial frequencies, whereas small anatomic structures give rise to field variations with high spatial frequencies. These two kinds of field variations can be separated by high-pass filtering. Applying a high-pass filter to the phase images enhances small structures, and, by shifting the lower cut-off frequencies to smaller values, larger structures become more apparent, while at the same time the effects of field inhomogeneities become more prominent. It is therefore important to know the sources of contrast in phase images to be able to exploit their diagnostic value. The aim of this article is to demonstrate the potential diagnostic value of MR phase imaging.
Methods
High-spatial-resolution, T2*-weighted, single-echo images were acquired on a 1.5T system (Magnetom Vision; Siemens, Erlangen, Germany) with a 3D, first-order, velocity-compensated gradient echo sequence (13, 14) by using a quadrature transmit-receive bird cage head coil (typical parameters: TR, 67 ms; TE, 40 ms; α, 25°; FOV, 25.6 × 19.2 × 64 cm; matrix, 512 × 192 × 64). Data from five volunteers and one patient with a high-grade brain tumor (glioblastoma multiforme) were evaluated. In addition, the patient was imaged with a contrast-enhanced T1-weighted, high-spatial-resolution, 3D magnetization-preparation rapid gradient echo (MP-RAGE) sequence (TR, 15 ms; TE, 5 ms; FOV, 16 cm × 25.6 cm × 9.6 cm; matrix, 160 × 160 × 64). Written informed consent was obtained from the patient and all volunteers participating in this study. All postprocessing was performed by using IDL (Interactive Data Language; Research Systems, Boulder, CO).
Data were zero filled, typically resulting in a matrix of 512 × 384 × 96, and 3D images were reconstructed by inverse fast fourier transform. Phase unwrapping was applied to all wrapped-phase images (9, 10). In short, the technique works as follows: each pixel is unwrapped on the basis of a slope prediction that is calculated from its unwrapped neighbors. If the consistency between these predictions is sufficient, the pixel is unwrapped. If no pixels can be unwrapped, the reliability criteria are relaxed and the process starts again.
High-pass filtering was performed on the unwrapped phase images by subtracting a low-pass filtered, unwrapped phase image from the original unwrapped-phase image, I:  where I is the phase image and L̂ the low-pass filter operator. Low-pass filtering was performed by smoothing the image with a boxcar averaging operator of width w = 23 pixels. Then, the unwrapped- and filtered-phase images Ĥ(I) were further processed by applying a minimum intensity projection (mIP), M̂, to several adjacent, high-pass filtered-phase images, Ĥ(I):
Although phase and signal intensity (magnitude) represent two different aspects of MR data, we will nevertheless refer to mIPs also in the case of phase images when no confusion can arise. All mIPs were performed along the z direction (i.e., perpendicular to the axial imaging plane).
Results
An axial view of an original wrapped phase image and an axial, a sagittal, and a coronal view of the phase data after application of the unwrapping algorithm are shown in Figure 1. Note that phase wraps in Figure 1A appear mainly close to the surface of the brain and near air-filled cavities. The large phase changes in the frontal region of the brain (dark areas in the unwrapped phase images Figure 1B–D) are caused by the sphenoid sinuses, which create strong static field inhomogeneities in the neighboring tissue.

Wrapped (A) and unwrapped phase images (B–D). The sphenoid sinuses cause strong field inhomogeneities that extend far into the interior of the brain (white arrows). Parameters: TR = 67 ms, TE = 40 ms, α = 25°, FOV = 256 × 256 × 64, imaging matrix = 512 × 512 × 128.
Brain Anatomy
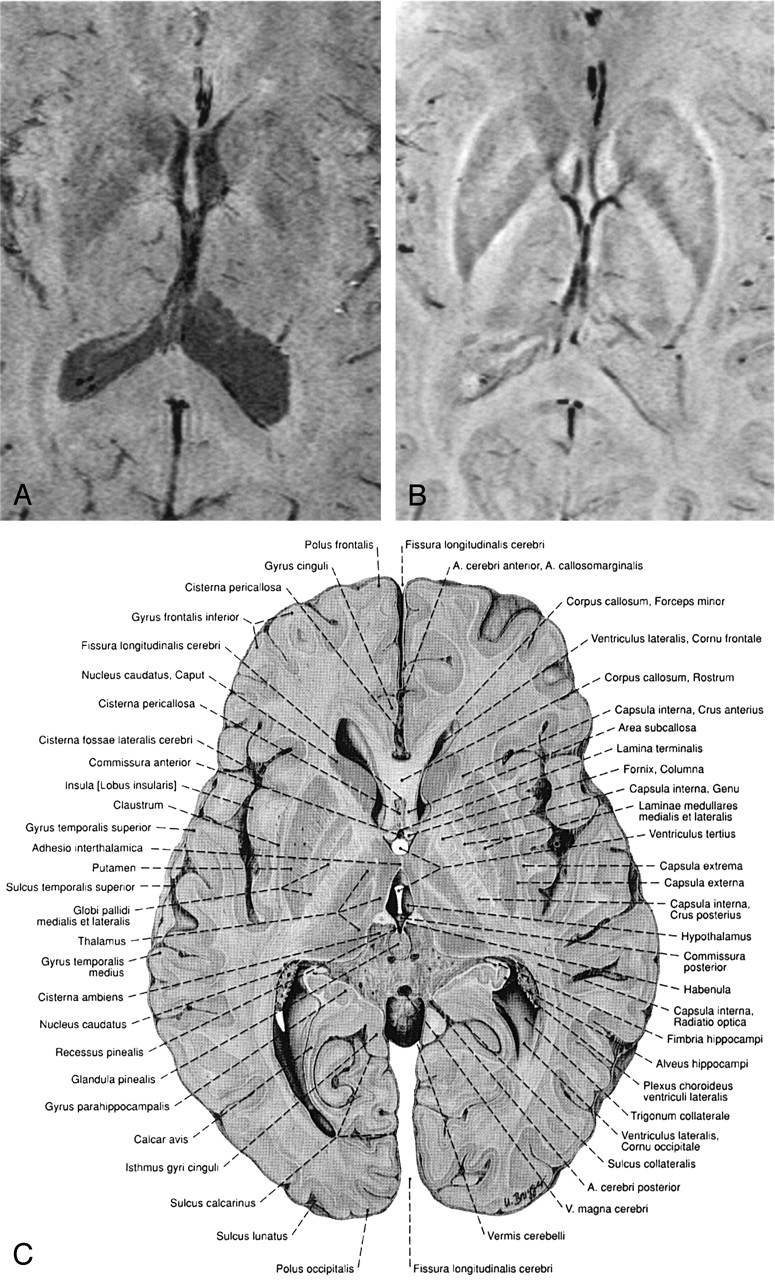
In all subjects, phase and magnitude images of the same data set show characteristic but different behavior that can be used as a source of additional information (Figs 2 and 3). For example, Figures 2B and 3B show phase images in which the capsula interna, the capsula externa, and even the capsula extrema can be identified and compared with anatomic images. The CSF is hardly visible on these phase images, because the resonance frequencies of CSF and parenchyma are very similar; however, because of its long T1, the CSF appears hypointense on the magnitude images, which leads to good contrast between the ventricles and the parenchyma (Figs 2 and 3). The large venous vessel near the left posterior horn of the ventricle is almost invisible in the magnitude image (Fig 2A) but can be clearly identified in the phase image (Fig 2B). Also noteworthy is the fact that the ventricles appear larger in the magnitude images than in the phase images (Figs 2 and 3), which is a feature of the mIP. In the magnitude data, the pixels with the least signal intensity along the path of the projection (in this case, four sections) are located in the ventricles. In the phase image, however, the minimum is located in areas adjacent to the ventricles with increased iron content, such as the caudate nuclei. From such careful comparisons of magnitude and phase information conclusions on the relative position of anatomical features can thus be drawn.

Minimum intensity projections over 4 sections of the magnitude data (A), the corresponding high-pass filtered phase images (B), and a reproduction from an anatomic atlas for comparison (C). In the phase image (B) the capsula interna, capsula externa, putamen, nucleus caudatus, corpus callosum and the claustrum are better visualized than in the magnitude image (A). Also improved is the contrast between gray and white matter. The ventricles are not easily visible in the phase images due to the fact that the magnetic susceptibility of CSF and brain tissue is very similar. TR = 67, TE = 40, α = 25°, FOV = 256 × 256 × 192 mm3, matrix = 512 × 256 × 96, w = 21. (Image C is reproduced with permission from Putz/Pabst: Sobotta, Atlas der Anatomie des Menschen, 21. Auflage 2000, Elsevier GmbH, Urban & Fischer Verlag München, Jena.)

Minimum intensity projections over 4 sections of magnitude image (A), the corresponding high-pass filtered phase images (B), and a reproduction from an anatomic atlas (C). In the phase image (B) the caudate nucleus, the putamen, the globus pallidus, and the thalamus with parts of the thalamostriate veins, amongst other features, can be identified. TR = 67 ms, TE = 40 ms, α = 25°, FOV = 256 × 256 × 96 mm3, matrix = 512 × 256 × 96, w = 21. (Image C is reproduced with permission from Putz/Pabst: Sobotta, Atlas der Anatomie des Menschen, 21. Auflage 2000, Elsevier GmbH, Urban & Fischer Verlag München-Jena.)
In Figure 4, a single magnitude image (Fig 4A) and an mIP over five 1-mm-thick sections of the phase data are displayed (Fig 4B). The nucleus ruber, the substantia nigra reticulata, and the venous vascular structure show excellent contrast, which indicates the sensitivity of the sequence toward the effects of heme and nonheme iron (15, 16). In the red nuclei, the medullary lamella separating the pars parvocellularis from the pars magnocellularis can be clearly identified (17). In the magnitude image (Fig 4A), the middle section of the five sections taken for the mIP in Figure 4B, the nuclei, and the veins are less pronounced, but the posterior horns of the lateral ventricles are visible.

Magnitude image (A), a mIP over 5 sections from the phase images (B) and a reproduction from an anatomic atlas. The red nuclei, the substantia nigra, the crus cerebri and venous vessels are displayed well in the phase image. The medullary lamellae in the red nuclei can be clearly identified. TR = 67 ms, TE = 40 ms, α = 25°, FOV = 256 × 256 × 96 mm3, matrix = 512 × 256 × 96, w = 21. (Image C is reproduced with permission from Putz/Pabst: Sobotta, Atlas der Anatomie des Menschen, 21. Auflage 2000, Elsevier GmbH, Urban & Fischer Verlag München-Jena.)
Tumor
The effects of a tumor (glioblastoma multiforme) on brain anatomy are displayed in Figure 5. Neither the magnitude image (Fig 5B) of the susceptibility weighted scan nor the MP-RAGE image (Fig 5A) are able to display the tissue shift caused by the tumor as clearly as the phase image (Fig 5C). In both the magnitude and the phase image of the susceptibility-sensitive scan, the spatial heterogeneity of the tumor is clearly visible, whereas the edema is better delineated in the magnitude image. Although the contrast-enhanced MP-RAGE scan (Fig 5A) clearly demonstrates the rimlike enhancement pattern of the lesion, it does not reveal much of its internal structure. The detailed differentiation between different tumor parts in the magnitude (Fig 5B), and especially in the phase image (Fig 5C), however, is notable. Multiple hemorrhagic or necrotic parts can be distinguished. For instance, the phase image shows a hyperintense area between the tumor and the basal ganglia (white arrows), which indicates the presence of hemosiderin associated with hemorrhage. The same region appears hypointense on the magnitude image because of the strong local spin dephasing. As a result, combining the native (magnitude and phase) and the contrast-enhanced information of the two scans gives a much better overall characterization, thus aiding lesion delineation or potentially even biopsy.

Contrast-enhanced T1-weighted MP-RAGE scan (A) (TR = 15 ms, TE = 5 ms, FOV = 224 × 256 mm2, section thickness = 1.0 mm), minimum intensity projections over four sections of magnitude (B), and phase (C) of the susceptibility weighted 3D scan of a 29-year-old female patient with a glioblastoma multiforme (TR = 67 ms, TE = 40 ms, α = 25°, FOV = 169 × 256 × 64 mm3, matrix = 160 × 160 × 64, w = 23).
Discussion
Phase images of a T2*-weighted, high-resolution gradient echo sequence contain a wealth of information due to subtle differences in the local resonance frequency. Phase information requires no additional scan time but is an inherent part of an MR image. After phase unwrapping in image space and high-pass filtering, phase images display small anatomic structures with superb contrast and resolution, such as small veins, deep nuclei with increased iron content, or even white matter tracts, which are not easily visible on corresponding magnitude images. There is also increased contrast between cortical gray matter and white matter because of differences in local cerebral blood volume. Until now, interpretation of the phase information contained in the raw data was often confusing and difficult because of phase wraps. By using the proposed unwrapping technique, phase images can be unwrapped within a second on a standard personal computer. For the geometric correction of EPI images, for instance, the relevant information about the distortions of the static magnetic field is contained within the low spatial frequencies, whereas for high-resolution MR venography one wants to preserve the information from small anatomic structures. Use of a homodyne demodulation reference is a fast way to obtain high-pass filtered-phase images almost free of phase wraps. In some anatomic regions, however, phase wraps still appear and become more abundant with increasing field strength. Unwrapping the phase images in image space, on the other hand, preserves all spatial frequency components of the phase information and gives better results in regions of low homogeneity of the static magnetic field.
An evaluation of both magnitude and phase images of the same (susceptibility-weighted) data set results in information that may not be obtained from only the magnitude images of the same or other MR sequences. Because the phase images are obtained together with magnitude images, one has in fact two imaging modalities, one that shows a combination of T1- and T2* weighting and one that is sensitive to tissue magnetic susceptibility only and not influenced by T1 weighting. Nevertheless, both phase and magnitude images may be affected by the same anatomic feature, because both spin dephasing and local precession frequencies are influenced. This is the case for venous vessels, where the phase of spins inside and outside venous vessels depends on the angle between the vessel and the static magnetic field. In this case, certain vessels or sections of vessels may not be visible on the phase images. The high-pass filtered-phase images can, however, be combined with the corresponding magnitude images to create BOLD MR venograms (13, 10). In BOLD venography, phase masks are computed by setting all positive values to 1 and scaling all negative phase values linearly between 0 and 1 (13). On multiplication of the phase mask with the corresponding magnitude image, the intensity in the parenchyma is left unchanged, whereas venous blood appears dark. This procedure ensures that small vessels at all angles yield SWI contrast. The possibility to process and visualize the acquired data in the three different modalities magnitude, phase, and venogram justifies the longer acquisition times that are inevitable when long-TE, high-resolution images are to be obtained. The method may, however, benefit from the shorter TEs at higher field strengths (18) or parallel imaging, where the probability of motion during the scan would be considerably reduced.
The heterogeneity of tumorous tissue (Fig 5) is best visualized in the phase images, showing complex and variable patterns of different parts of the lesions, such as hemorrhagic or necrotic parts. In a recent study performed at 3T, contrast-enhanced susceptibility-weighted BOLD MR venography was shown to provide more detailed information in primary brain tumors and metastases (18). The proposed approach in the present study of acquiring and processing high-resolution, magnetic susceptibility-weighted MR phase images at 1.5T also reveals anatomic features not visible with other MR images; however, further studies that involve histologic verification of findings in phase images are certainly necessary. Nevertheless, the rich details observed in the combined evaluation of magnitude and phase of a susceptibility-weighted scan warrant further investigation. The important features of edema, tumor shape, and size and their effects on nearby anatomy can be assessed with a single susceptibility-weighted scan if magnitude data and phase data are evaluated together.
Recently published phase images obtained at 8T show good contrast even with two-dimensional acquisition and a section thickness of 5 mm (19). They were created with the homodyne demodulation method (6), which imposes limitations upon the flexibility in further processing, because it inherently is a tradeoff between unwrapping and high-pass filtering (20). By using 3D acquisition and an alternative postprocessing scheme, we were able to obtain phase images with high resolution and rich contrast at a clinical field strength of 1.5T.
Conclusion
We have demonstrated the potential of MR phase imaging and emphasized that susceptibility-weighted phase images bear additional information that is not accessible in the magnitude images alone.
Footnotes
Funded by the Deutsche Forschungsgemeinschaft (grant RE 1123/7-1).
References
- Received May 12, 2004.
- Accepted after revision April 8, 2004.
- American Society of Neuroradiology
In this issue


Jump to section
Related Articles
Cited By...
- Advanced computational and statistical multiparametric analysis of Susceptibility-Weighted Imaging to characterize gliomas and brain metastases
- Gadolinium-Enhanced Susceptibility-Weighted Imaging in Multiple Sclerosis: Optimizing the Recognition of Active Plaques for Different MR Imaging Sequences
- Lesion Heterogeneity on High-Field Susceptibility MRI Is Associated with Multiple Sclerosis Severity
- Magnetic resonance frequency shifts during acute MS lesion formation
- Biophysical mechanisms of MRI signal frequency contrast in multiple sclerosis
- Combination of high-resolution susceptibility-weighted imaging and the apparent diffusion coefficient: added value to brain tumour imaging and clinical feasibility of non-contrast MRI at 3 T
- Localization of the Subthalamic Nucleus: Optimization with Susceptibility-Weighted Phase MR Imaging
- Added Value and Diagnostic Performance of Intratumoral Susceptibility Signals in the Differential Diagnosis of Solitary Enhancing Brain Lesions: Preliminary Study
- Biophysical mechanisms of phase contrast in gradient echo MRI
- Semiquantitative Assessment of Intratumoral Susceptibility Signals Using Non-Contrast-Enhanced High-Field High-Resolution Susceptibility-Weighted Imaging in Patients with Gliomas: Comparison with MR Perfusion Imaging
- Usefulness of Susceptibility-Weighted Imaging for Voxel Placement in MR Spectroscopy
- Characterizing the Mesencephalon Using Susceptibility-Weighted Imaging
- Susceptibility-Weighted Imaging: Technical Aspects and Clinical Applications, Part 2
- Susceptibility-Weighted Imaging: Technical Aspects and Clinical Applications, Part 1
- High-field MRI of brain cortical substructure based on signal phase