
Abstract
Summary: Although 3D-CT angiography provides valuable anatomic information regarding lesion and their surrounding vessels and bony structures, it cannot demonstrate lesions, arteries, and veins, separately. The separate demonstration of arterial-phase 3D-CT angiography (3D-CT arteriography) and venous-phase 3D-CT angiography (3D-CT venography) will facilitate the understanding of the vascular anatomy within lesions, thus, allowing improvement of diagnostic accuracy and potentially a safer surgical approach. We describe 3D-CT arteriography and 3D-CT venography by using a multidetector row helical CT.
3D-CT angiography provides valuable anatomic information regarding the lesion and its surrounding vessels and bony structures (1–3); however, the simultaneous demonstration of the lesion, arteries, and veins makes their discernment difficult on 3D-CT angiography (2, 3), and the demonstration of the venous system overlying arteries sometimes obscures the presence of cerebral aneurysms (4). Therefore, the separate demonstration of arterial-phase 3D-CT angiography (3D-CT arteriography) and venous-phase 3D-CT angiography (3D-CT venography) is desirable for improved diagnostic accuracy and may lead to safer surgery. Single-detector CT cannot scan the arterial and venous phases separately, because of its limited scanning speed. Multidetector row CT (MDCT) scanner facilitates acquisition of multiple CT data sets with each rotation of the radiograph tube and scans through large anatomic areas much faster than the SDCT scanners (5–7). This technical note describes a method for intracranial 3D-CT arteriography and 3D-CT venography.
Description of the Technique
We used a MDCT scanner with 16 detectors and a tiltable gantry. First, a scout view was obtained to determine the scan range for dynamic CT scanning. The scan range was set from the orbitomeatal (OM) line 10 mm above to 25 mm, parallel to the OM line. This range could scan the internal carotid artery (ICA) in the cavernous sinus and sigmoid sinus (SS). Next, an 18-gauge plastic intravenous catheter was placed in an antecubital vein. The line was connected to a dual-head power injector. The dynamic CT scan was started 5 seconds after the injection of nonionic contrast material at a speed of 6–7 mL/s (a total volume of 24–28 mL) and was followed by a chaser bolus injection (8) with a total volume of 18–21 mL saline at 6–7 mL/s. Dynamic CT scanning was performed every 0.5 seconds for a total of 25 seconds, with a 5-mm section thickness. The scanning parameters of the dynamic CT scan were as follows: 135 kV; 80 mA; four sections of 5-mm section thickness; and a 512 × 512 matrix. We produced the time-attenuation curves by setting the region of interest at the ICA in the cavernous sinus and the SS.
On the basis of the results of the dynamic CT scan, the optimal scan delays for 3D-CT arteriography and 3D-CT venography were determined (Fig 1). Because the time interval between the time-attenuation curves of the ICA and SS was 5–6 seconds, we determined that the time for scanning for 3D-CT arteriography or 3D-CT venography was 5 seconds. The scan for 3D-CT arteriography was performed from 4 seconds before the peak time of time-attenuation curve of ICA to 1 second after the peak. After an interscan delay of 4–5 seconds, the scanning for 3D-CT venography resumed. With the use of a dual-head power injector, a bolus injection of nonionic contrast medium was delivered at a rate of 6–7 mL/s (total 30–35 mL) for 5 seconds followed by a chaser bolus of 18–21 mL of saline at 6–7 mL/s. The scan parameters were as follows: 135 kV; 260 mA; 16 sections of 0.5-mm section thickness (simultaneous acquisition of 16 sections per one rotation), a helical pitch of 13; 0.5 seconds per rotation of the radiograph tube; a table speed of 9.0 mm/s; and 45 mm scan range. The scans for 3D-CT arteriography and 3D-CT venography were performed in a caudal-to-cephalic direction.

Regions of interest at the internal carotid artery (ICA), in the cavernous sinus, and the sigmoid sinus (SS) are set on the axial image. The peak times for the ICA and SS, and the peak-to-peak time are analyzed on time-attenuation curves. ICA indicates internal carotid artery; SS, sigmoid sinus; A, arterial-phase scan for 3D-CT arteriography; V, venous-phase scan for 3D-CT venography
The acquired data were reconstructed at 0.3-mm intervals and transferred to a workstation connected on-line to the MDCT scanner. 3D-CT arteriography and 3D-CT venography were generated by a volume-rendering method. On 3D-CT arteriography and 3D-CT venography, it is difficult to differentiate vessels from bone structure in the portion close to the skull base. Therefore, for reconstruction, a subtraction method was used to remove bone without deleting vascular structures. First, primary images of 3D-CT arteriography and 3D-CT venography that consisted of all pixels between −500 and 4,000 HU was created. Next, the threshold for a secondary bone image was carefully chosen from the primary image of 3D-CT arteriography with the neurosurgeon verifying that this new bone image did not include any vascular structures. Lower threshold varied from 267 to 423 HU for the bone image. The bone image was then increased in thickness by 6–8 pixel layers by using the “dilate” function of the workstation. The dilate function adds a specified number of pixel layers of original data to an image. The dilated bone image (mask; Fig 2C) was subtracted from the 3D-CT arteriogram, yielding a 3D-CT image (Fig 2A) of arteries alone. Likewise, it was subtracted from the 3D-CT venography, producing a 3D-CT image (Fig 2B) of veins alone. To facilitate the identification of arteries, veins, bone, the arteries were colored red, the veins blue, and the bones white. By using these 3D-CT images of arteries (Fig 2A), veins (Fig 2B), and bone (Fig 2C), the combined images—such as 3D-CT arteriography (3D-CT image of arteries and bone; Fig 2D), 3D-CT venography (3D-CT image of veins and bone; Fig 2E) and fused 3D-CT image (3D-CT image of arteries, veins and bone; Fig 2F)—could be developed. In the cases of tumors, the tumor was extracted by using a cutting method and the fused 3D-CT image combined tumor, arteries, veins and bone could be produced. The tumors were colored yellow-green.

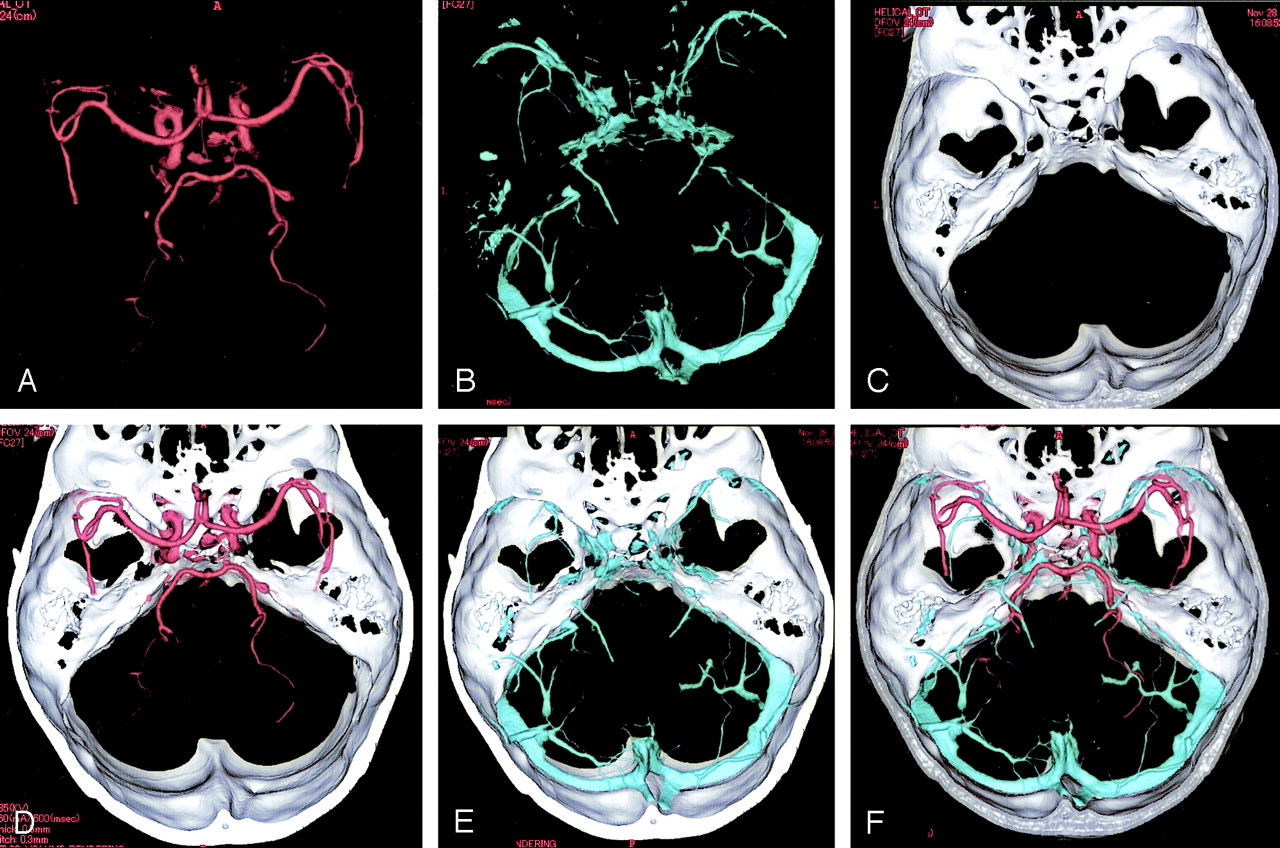
3D images produced by using MDCT.
A-F, 3D images of the intracranial arteries (A) and veins (B), and the bony structure (C), superior view, are separately demonstrated. 3D-CT arteriography (3D-CT image of arteries and bone) (D), 3D-CT venography (3D-CT image of veins and bone) (E), and fused 3D-CT image (F), superior views, showing the anatomic relationship between the intracranial arteries and veins.
Case Illustrations
Three representative cases of 25 patients with CNS disorders are demonstrated.
Case 1
A 55-year-old woman had a right internal carotid-ophthalmic artery aneurysm that was incidentally discovered on MR angiography and was admitted to our hospital for surgery. We performed the demonstration of 3D-CT arteriography and 3D-CT venography to assess the anatomic relationship between the aneurysm and its adjacent cavernous sinus. 3D-CT arteriography, 3D-CT venography, and fused 3D-CT images allowed us to understand that the aneurysm was located in the extracavernous portion, information that was useful for obtaining an accurate diagnosis and for planning the operation (Fig 3).

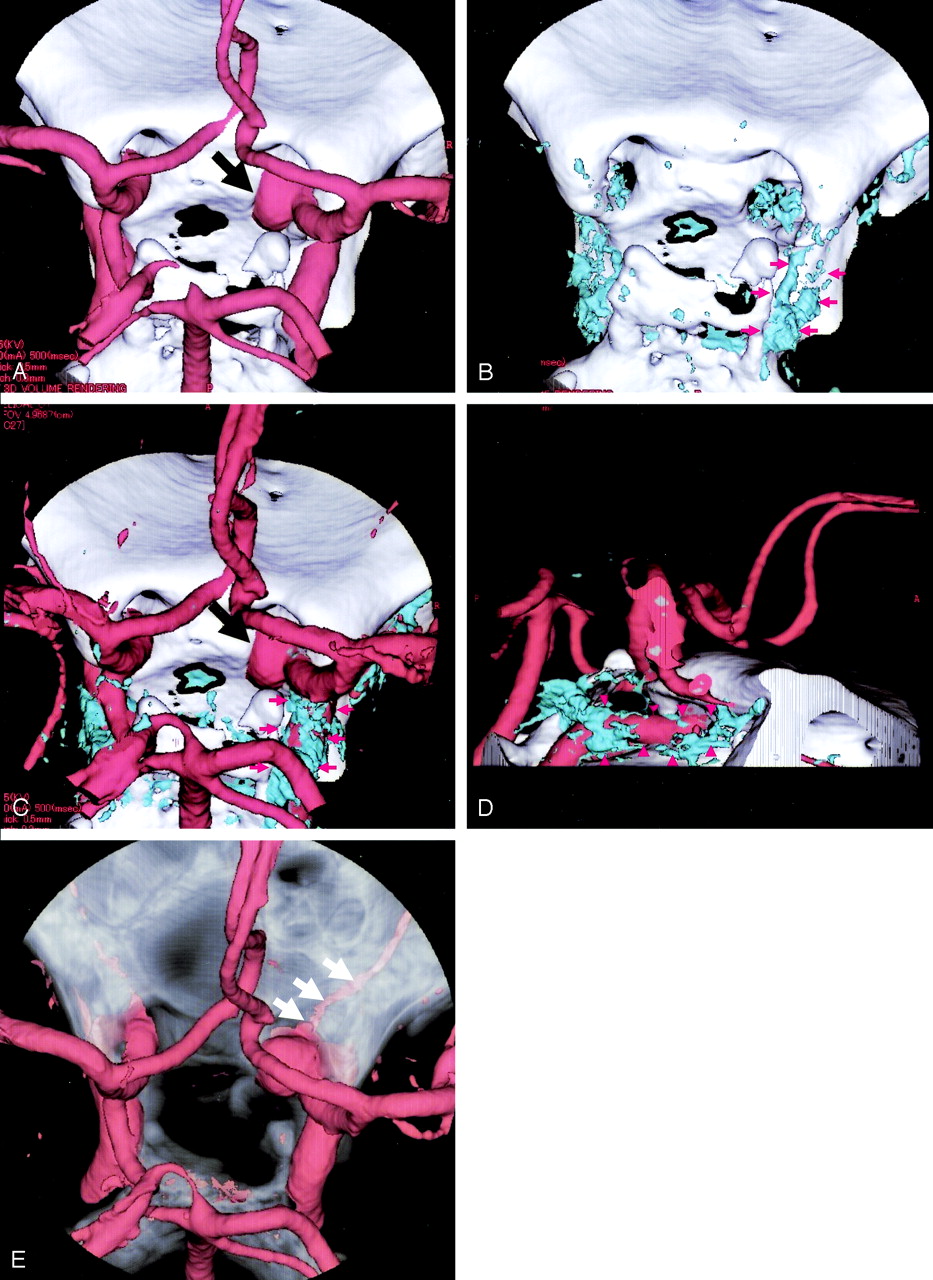
A 57-year-old woman with right internal carotid-ophthalmic artery aneurysm.
A, superior 3D-CT arteriography showing a right internal carotid arteryophthalmic artery aneurysm (black arrow) projecting medially.
B, The superior 3D-CT venography delineates the right cavernous sinus (red arrows).
C–D, The fused 3D-CT images of 3D-CT arteriography and 3D-CT venography, superior (C) and right lateral (D), demonstrates the anatomic relationship between the aneurysm (black arrow) and cavernous sinus (red arrows).
E: The right ophthalmic artery (arrows) is demonstrated on the 3D-CT arteriography with the bone of semitransparent visualization.
Case 2
A 55-year-old woman was admitted to our hospital with right facial paresis. CT and MR imaging showed a mass in the petroclival region that was diagnosed as a meningioma. 3D-CT arteriography clearly depicted a dilated feeding artery arising from the menigohypophyseal artery. The finding was not demonstrated on 3D-CT angiography. Furthermore, encasement of the superior cerebellar artery by the tumor was revealed on the fused 3D-CT images, which were consistent with the surgical findings (Fig 4).

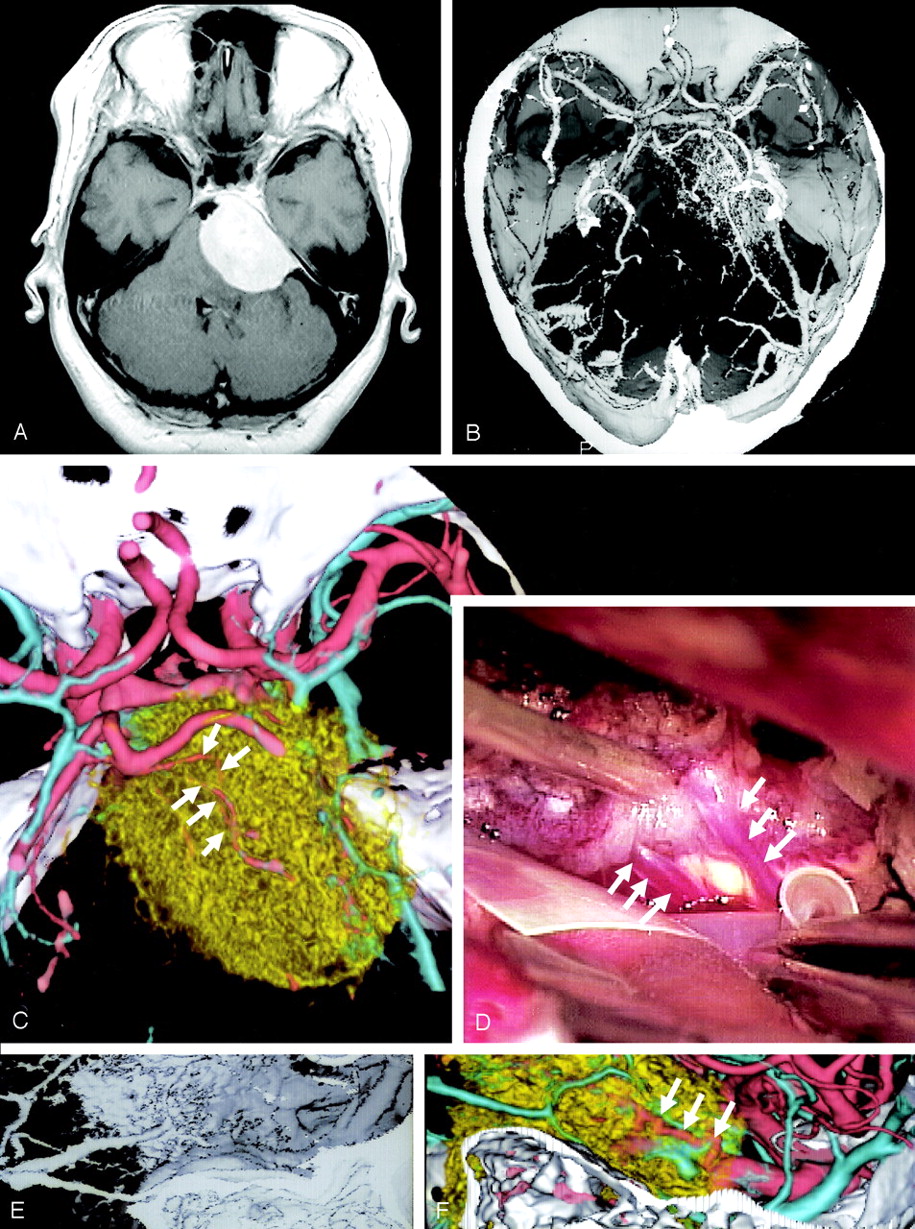
A 55-year-old woman with petroclival meningioma.
A, Axial contrast-enhanced T1-weigted image reveals a mass at the right petroclival region.
B, 3D-CT angiography showing the tumor and its adjacent vessels.
C-D, The fused 3D-CT image (C) demonstrates encasement of the superior cerebellar artery (arrows) by the tumor, which was consistent with the surgical finding (D).
E-F, The fused 3D-CT image (F) clearly demonstrates the feeding artery arising from the meningohypohyseal artery which is not visualized on 3D-CT angiography (E).
Case 3
A 28-year-old woman suffered from a generalized tonic seizure. MR imaging and MRA demonstrated a left parietal vascular malformation. DSA revealed an arteriovenous malformation (AVM) fed by branches of the left anterior cerebral artery. Although 3D-CT angiography demonstrated the AVM, it did not differentiate the arterial-phase from the venous-phase. 3D-CT arteriography and 3D-CT venography could demonstrate vascular structures with arterial or venous circulation, individually (Fig 5).

A 28-year-old woman with arteriovenous malformation in the left parietal lobe.
A, Sagittal T1-weighted image demonstrates an AVM in the parietal lobe and a hematoma in the splenium.
B, A left internal carotid artery angiogram, lateral view, reveals the AVM fed by anterior, middle and posterior cerebral arteries and drained into the vein of Galen.
C, 3D-CT angiography, superior view, showing a vascular malformation.
D-E, The 3D-CT arteriography (D) and 3D-CT venography (E), superior view, reveal the vessels on arterial-phase and venous-phase of the AVM, respectively.
F, The fused 3D-CT image, superior view, facilitates understanding of the anatomic relation of vascular structure between arterial-phase and venous-phase.
Discussion
3D-CT angiography, a valuable method for evaluating cerebrovascular diseases such as cerebral aneurysms (9) and occlusive diseases (10, 11), provides 3D anatomic information on vascular structures (2, 12). 3D-CT angiography using single detector CT cannot separately demonstrate arterial and venous phases. The separate demonstration of 3D-CT arteriography and 3D-CT venography can provide the following advantages; the improvement of diagnostic accuracy; the visualization of the vascular characteristics in the arterial-phase or venous-phase aids in the diagnosis and surgical planning. In addition, the demonstration on these images of the lesion, arteries, veins, and bony structures, and of their relationship, also aids in the surgical management.
Our method using MDCT made it possible to develop the separate demonstration of arterial system from venous system on 3D-CT angiography in a single procedure. The fused 3D-CT images facilitated the comprehension of anatomic relationship among the arteries, veins, and bony structures. Although the software made it possible to display arteries or veins separately in different colors even on 3D-CT angiography, the correct identification of the different vessels depends on the experience and subjective judgment of the investigator who identified arteries or veins, introducing the possibility to mislabel arteries as veins. The method introduced here enabled separation of arteries and veins automatically, allowing us to understand precise anatomic relation between arteries and veins. In addition, preoperative 3D arterial- and venous-system mapping by using 3D-CT arteriography and 3D-CT venography allowed the neurosurgeons to anticipate anatomic details such as the presence of any overlying major arteries, veins, dural sinuses, and encased vessels before the tumor resection.
3D-CT angiography cannot demonstrate arteries and veins, separately. 3D-CT arteriography and venography can, however, demonstrate the vessels filled with the contrast medium in the arterial-phase and the venous-phase, respectively. In the cases of AVM, 3D-CT arteriography can visualize the drainer if the drainer is demonstrated with the contrast medium in the arterial-phase as the conventional cerebral angiography, indicating that there is an arteriovenous shunt. On the other hand, if the vascular malformation is demonstrated in 3D-CT venography, it should have no arteriovenous shunt, suggesting that it is diagnosed as venous angioma. Our method may give us the information on blood circulation in the vascular malformation. The demonstration of AVM by using 3D-CT arteriography and 3D-CT venography facilitates our understanding of the 3D vascular structure with arterial- and venous-elements, which is useful information for the surgery.
3D-CT angiography does not provide the dynamic information regarding the cerebral circulation, such as early venous filling, the presence of an arteriovenous shunt or of collateral flow (2, 3). Because the study of the 3D-CT arteriography and 3D-CT venography by using a single bolus injection involves a time-dependent factor, it has the potential to provide the dynamic information. For example, if the arteries are demonstrated on the 3D-CT venography, it indicates a delayed flow in the arteries and a prolongation in the cerebral circulation. On the other hand, if the veins are seen on the 3D-CT arteriography, the presence of an arteriovenous shunt, such as an AVM, an AVF or malignant tumor with an arteriovenous shunt must be considered.
Conclusion
Helical CT scanner with 32 or 64 detectors will make it possible to obtain the 3D-CT arteriography and 3D-CT venography of the entire head from the skull base to the vertex. Furthermore, in addition to the 3D-CT arteriography and 3D-CT venography, the capillary-phase 3D-CT angiography and the 3D-CT angiographies of additional novel phases can be developed. These images provide us with the acquisition of information on detailed vasculature of tumor and cerebral hemodynamics as conventional cerebral angiography. These images will be able to replace conventional angiography in the diagnosis and preoperative evaluation.
References
- Received September 9, 2004.
- Accepted after revision September 28, 2004.
- Copyright © American Society of Neuroradiology


