
Abstract
BACKGROUND AND PURPOSE: The purpose of this study was to determine the incidence of susceptibility artifacts on functional MR imaging (fMRI) studies and their effect on fMRI readings. We hypothesized that the availability of the signal intensity maps (SIMs) changes the interpretation of fMRI studies in which susceptibility artifacts affected eloquent brain regions.
METHODS: We reviewed 152 consecutive clinical fMRI studies performed with a SIM. The SIM consisted of the initial echo-planar images (EPI) in each section thresholded to eliminate signal intensity from outside the brain and then overlaid on anatomic images. The cause of the artifact was then determined by examining the images. Cases with a susceptibility artifact in eloquent brain were included in a blinded study read by four readers, first without and then with the SIM. For each reader, the number of times the interpretation changed on viewing the SIM was counted.
RESULTS: Of 152 patients, 44% had signal intensity loss involving cerebral cortex and 18% involving an eloquent brain region. Causes of the artifacts were: surgical site artifact, blood products, dental devices, calcium, basal ganglia calcifications, ICP monitors, embolization materials, and air. When provided with the SIM, readers changed interpretations in 8–38% of patient cases, depending on reader experience and size and location of susceptibility artifact.
CONCLUSION: Patients referred for clinical fMRI have a high incidence of susceptibility artifacts, whose presence and size can be determined by inspection of the SIM but not anatomic images. The availability of the SIM may affect interpretation of the fMRI.
In fMRI, activation is detected because of the blood oxygen level–dependent (BOLD) effect as deoxyhemoglobin concentration changes in regions of increased neuronal activity. T2*-weighted images are used to detect the BOLD effects in functional MR imaging (fMRI) mapping. However, the same T2* weighting, which forms the basis for signal intensity on fMRI, is also the source of potential susceptibility artifacts. The BOLD effect may not be detected in regions of the brain with large susceptibility artifacts, caused by internal static local field gradients that distort the image or attenuate the signal intensity (1–4). Susceptibility artifacts sufficient to reduce the BOLD effect occur at tissue interfaces such as that between air and brain, and affect the sensitivity of fMRI in the inferior lateral temporal lobes (including part of fusiform gyrus) and the inferior medial frontal lobes (medial orbital gyri and gyrus rectus) (2, 4, 5). In addition, susceptibility artifacts may occur secondary to clips or sutures placed on the calvaria during surgery or due to tissues with paramagnetic effects such as blood products in tumors or vascular malformations (5). Susceptibility artifacts become more severe as higher field strengths are used (1–3).
How frequently magnetic susceptibility effects obscure activation in patients referred for fMRI is not generally known, although the possibility is recognized (1, 2, 4–19). Magnetic susceptibility effects that cause artifact and signal intensity loss on fMRI may not be evident on the anatomic reference images on which fMRI activation data are usually displayed, because conventional spin-echo images are less sensitive to susceptibility effects. Parrish et al (17) showed with computer simulations that susceptibility effects might reduce the BOLD signal intensity to undetectable levels in typical fMRI experimental designs. They described a method based on signal intensity-to-noise ratio to map regions with diminished sensitivity to the BOLD effect and illustrated the use of the map in one patient with a cerebral cavernous vascular malformation causing a magnetic susceptibility artifact.
The use of signal intensity maps (SIM) to identify regions of signal intensity loss and image distortion on the echo-planar images (EPIs) may aid in the interpretation of fMRIs. For this study, a map of voxels with a signal intensity exceeding the selected threshold was superimposed on an anatomic image in a manner similar to the way activations in fMRI are superimposed on an anatomic image. This SIM was then included as part of the fMRI file, which was reviewed by the neuroradiologists preparing the official report.
The purpose of this study was to review our experience with the SIM map. One goal of the study was to determine the incidence of regions with clinically significant susceptibility artifact in patients referred for fMRI. A second goal was to determine the effect of susceptibility artifacts on readings of fMRI by neuroradiologists. We hypothesized that the availability of the SIM to the readers would change the interpretation of some fMRI studies in which susceptibility artifacts affected eloquent brain regions.
Methods
Patients
The 152 studies performed and archived since the introduction of the SIM in June 2000 were reviewed. Medical records on these patients were also reviewed and final diagnoses determined by follow-up or from the results of surgical intervention. Patients were classified, on the basis of their final diagnosis, as having a tumor (primary or metastatic, n = 95), a vascular lesion (arteriovenous malformation, cavernous malformation, infarct, or hemorrhage; n = 42), trauma (n = 2), or other findings (nonlesional epilepsy, visual disturbance, or cognitive decline; n = 13). All patients provided written informed consent allowing us to use their image data for research purposes.
Functional MR Imaging
Imaging was performed using 1.5T commercial scanners (GE Medical Systems, Milwaukee WI) equipped with high-speed gradients. Single-shot EPIs were acquired in the coronal plane at 20–24 section locations. Technical parameters for these images included the following: 64 × 64 matrix, 85° flip angle, TR/TE of 2000/40, 24-cm FOV, 6-mm section thickness, 1-mm gap, and bandwidth of ±62.5 kHz. The number of images and length of imaging varied depending on the paradigm used. Imaging duration ranged from 3 to 5 minutes. Among other diagnostic MR imaging sequences performed in each patient was a high-resolution 3D gradient-echo sequence, a T1-weighted contrast sequences to obtain a whole-brain anatomic dataset (TR/TE of 21/6, 20° flip angle, 23-cm FOV, 256 × 256 matrix, and 1.5-mm section thickness), which was subsequently used for fMRI and SIM coregistration.
During postprocessing of the fMRI results, EPI raw data were low-pass filtered in the spatial frequency domain by using a Hamming filter (20) then reconstructed into individual section-location time-courses. These reconstructed time-course files were checked for patient head motion, and then re-aligned by using the 3Dvolreg spatial registration algorithm of the AFNI software fMRI analysis package (21). A minimum signal intensity threshold was applied to exclude extracranial voxels from further analysis. The time course plots from each unmasked EPI voxel was compared with reference functions with a generalized least-squares fitting algorithm, fitting the observed data voxel-by-voxel to sets of user-defined functions. The fitted functions included a constant (baseline signal intensity level), a ramp (to allow for possible linear signal intensity drift), a temporal smoothing filter (to compensate for the differences in image acquisition times within each 2000-ms TR), and a smoothed boxcar reference function modeling the presumed stimulus responses.
Generation of the EPI SIM
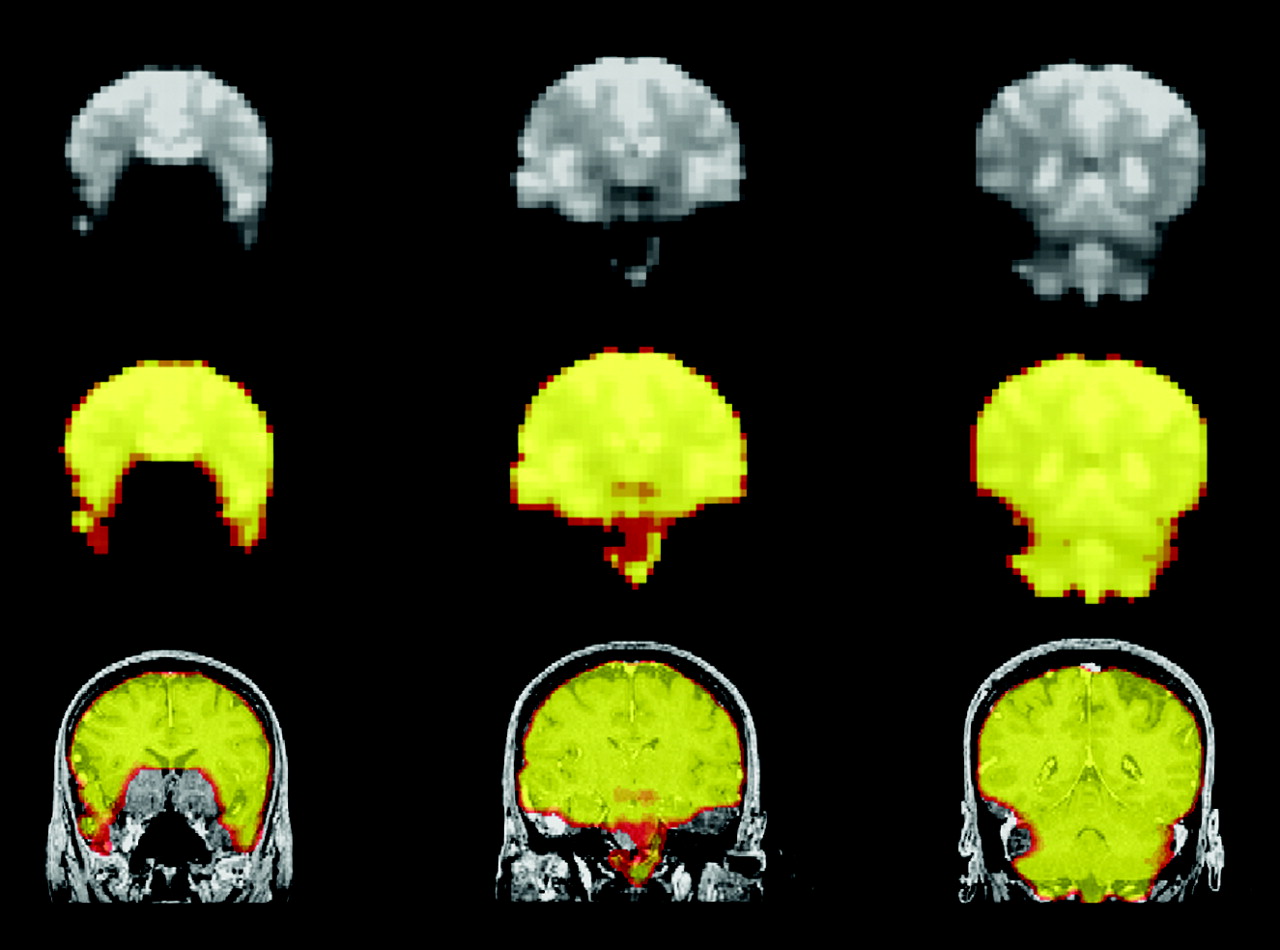
The initial EPIs from each section in the fMRI dataset were thresholded to eliminate signal intensity from regions outside the brain. These images were overlaid on the patient’s anatomic image dataset to create the SIM (Fig 1). Discrepancies due to head motion or misalignment in the SIM were corrected by means of the same linear 6-axis rigid-body translation program used to optimize the coregistration of fMRI maps to the anatomic images.

Illustration of SIM map processing. Top row, three noncontiguous coronal EPIs from an fMRI patient dataset show diminished signal intensity from the medial-inferior frontal lobes. Middle row, same sections converted to semitransparent colored masks, which can be superimposed on anatomic images. Bottom row, spatially smoothed version of the masks overlaid on coregistered high-resolution anatomic T1-weighted images. Colorization in the SIM demonstrates regions of adequate EPI signal intensity for detection of the BOLD effect.
Analysis of the SIM
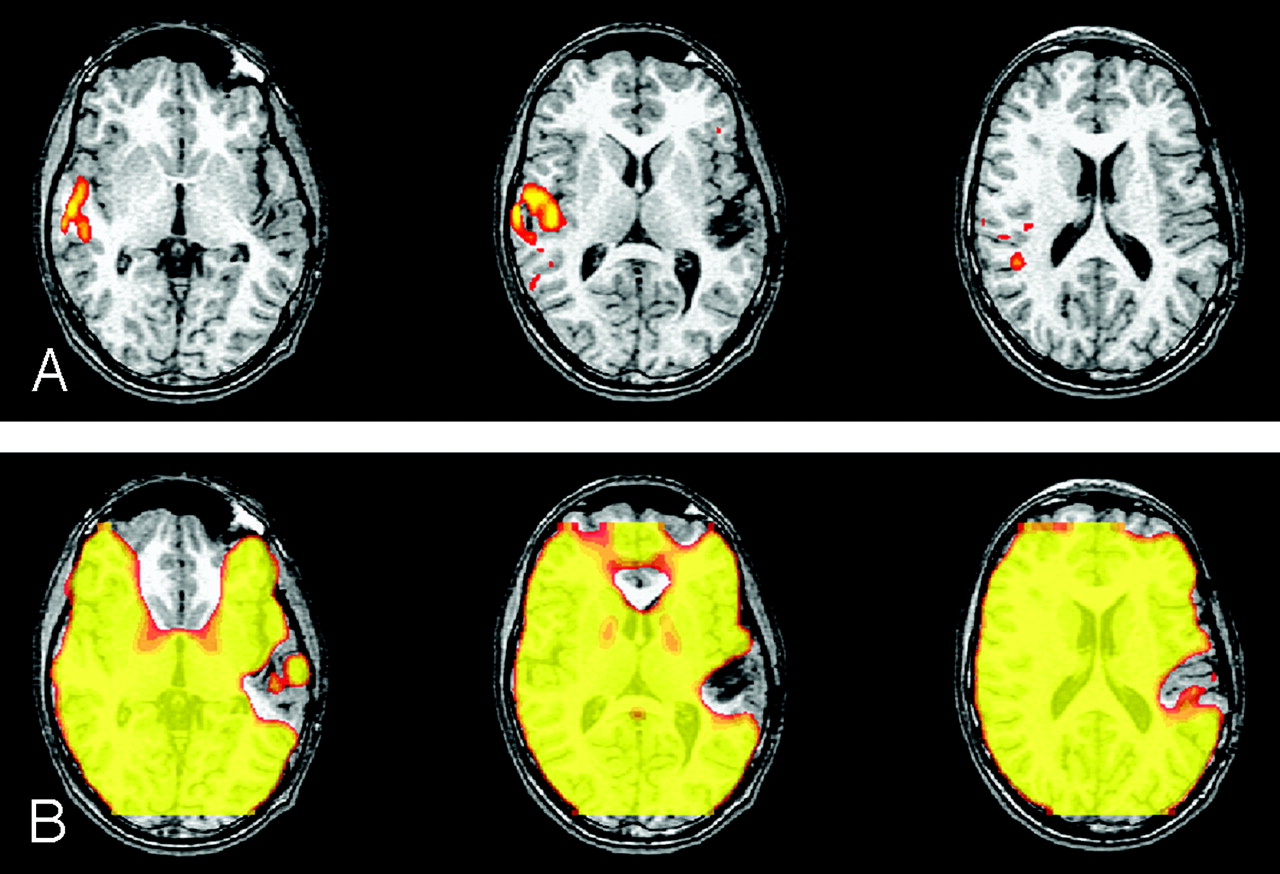
The SIMs were reviewed for evidence of regional signal intensity loss and any regions of signal intensity loss were then classified into one of three types: type I indicated signal intensity absence in the region of the sinuses or skull base; type II, signal intensity absence due to incomplete coverage of the brain with EPIs; and type III, signal intensity absence secondary to susceptibility artifact in regions distant from the sinuses and skull base (Fig 2).

Types of susceptibility artifact.
A, Type I signal intensity loss in the regions of the sinuses or skull base.
B, Type II signal intensity loss due to incomplete coverage of the brain with the EPI.
C, Type III signal intensity absence in a region of brain distant from the sinuses or skull base. In this case, a cavernous hemangioma with blood products produces the susceptibility effect.
In the cases with type II artifact, the relative amount of section cutoff was calculated as a percentage of the longitudinal dimension of the head that was not covered by the SIM on the axial image on which the cutoff was largest. In the cases with type III artifacts, the size and the location of the signal intensity dropout were tabulated. The cause of the artifact was then determined by examination of pertinent clinical images and reference to the patient’s clinical records. Artifacts caused by surgical clips, metal sutures, burr holes, and other postoperative features were grouped into a category termed surgical site artifact.
The subset of patients with type III artifacts occurring in eloquent brain regions was selected for additional blinded readings. For this purpose, the list of eloquent brain regions included the central sulcus, supplementary motor area, primary auditory cortex, Broca area, and Wernicke area, as anatomically determined by using standard parcellation methods (22). Cases were excluded from the blinded reading if a less-than-10% signal intensity void in the SIM coincided with a region of presumptive eloquent cortex or if no fMRI paradigm to activate the specified eloquent region had been performed. For each patient selected for the blinded study, a list of questions and possible answers was created to test the reader’s ability to recognize the activation with confidence. The questions addressed frontal (Broca area) and posterior (Wernicki area) language dominance, activation of the auditory cortex, and location of the sensorimotor cortex and the supplementary motor area. Questions and answers used in the study are listed in Table 1. Forty questions were posed for the 26 patients that were selected to be included in the blinded readings.
Questions and answers for the reviewers in the blinded study
Four readers participated in this study. Readers 1 and 2 were staff neuroradiologists (A.F., H.R.). For these readers, each case was reviewed without the SIM and the questions answered and then reviewed immediately afterward with the SIM and the questions answered again. Readers 1 and 2, who had discussed the study design, had knowledge of the goals of the study but were unfamiliar with the cases chosen. Readers 3 and 4 (D.W., M.H.) were second year neuroradiology fellows. To minimize bias for these readers, the entire set of images minus the SIM was submitted for review before they reviewed the images with the SIM. Readers were told that they were participating in a study to evaluate the effect of disease on fMRI activation. All readers were provided with the patient’s age, sex, reason for the fMRI, a list of the paradigms performed for the fMRI study, a list of questions with answer choices, and a file with all the fMRIs obtained in the patient.
For each reader, the number of times an answer was changed after viewing the SIM was tallied. The type of change was also noted (from specific hemispheric dominance to indeterminate, etc.). Comparisons were made between the more experienced readers (staff) and the less experienced readers (fellows).
Results
All of the 152 consecutive fMRI studies performed since June 30, 2000 were included in the review. All had fMRIs and SIMs of adequate quality for interpretation.
The SIM showed a variable degree of signal intensity loss classified as type I artifact in the region of the mesial temporal lobes in all patients. Of the 152 patients, 80 patients (53%) had type II artifact due to incomplete fMRI section coverage. Sixty-seven patients (44%) had type III signal intensity loss, which indicated signal intensity dropout with atypical location or severity. In the patients with type II artifacts, the percentage of brain not covered in the sections averaged 12%. In seven cases, it was greater than 20%. Type III artifacts varied with the type of disease. Of the cases with tumor, 40% had type III artifacts; of those with vascular malformation, 64% had type III artifacts; and of the trauma cases, two of two patients had type III artifacts (Table 2). In the diagnostic “other” category including 13 patients without focal lesions, artifacts were not encountered. Of the 67 patients with type III artifacts, 21 patients had more than one area of signal intensity loss, and eight had more than two areas of signal intensity loss (the maximum was six). Causes were most commonly from the surgical site or blood products, and less commonly from dental devices, calcifications, intracranial pressure monitors, embolization materials, basal ganglia mineralization, and air (Table 3). The amount of artifact appeared to depend on the amount and the age of prior hemorrhage, and was not easily or consistently predicted from an inspection of the routine anatomic images.
Presence of type III (susceptibility) artifacts by primary diagnosis
Causes of type III magnetic susceptibility artifacts in 67 patients
Of the 67 cases with type III artifacts, 28 patients with an artifact affecting a portion or all of an eloquent region were selected for the blinded study. One of these was excluded because the artifact did not exceed 10% of the eloquent cortex and one was excluded because a paradigm to activate the appropriate eloquent cortex had not been performed, leaving 26 for blinded analysis.
Results for the two more experienced readers (readers 1 and 2) and two less experienced readers (readers 3 and 4) were different. Reader 1 changed two answers affecting two patients (8%), and reader 2 changed three answers affecting three patients (12%) when the reading was made with the SIM in the 26 patients reviewed. Without the SIM, reader 1 had judged that the auditory cortex lacked activation in two cases and that language had left hemispheric dominance in one case. For reader 1, all three of these answers changed to indeterminate on viewing the SIM. Without the SIM, reader 2 had judged that the auditory cortex lacked activation in two cases. Both these answers changed to indeterminate upon viewing the SIM. Regarding less-experienced readers 3 and 4, reader 3 changed 12 answers affecting nine patients (35%), and reader 4 changed 15 answers affecting 10 patients (38%) when the reading was made with the SIM in the 26 patients reviewed. The questions and answers changed by the readers 3 and 4 (fellows) when provided with the SIM are detailed in Table 4. Example cases are shown in Figures 3 and 4.

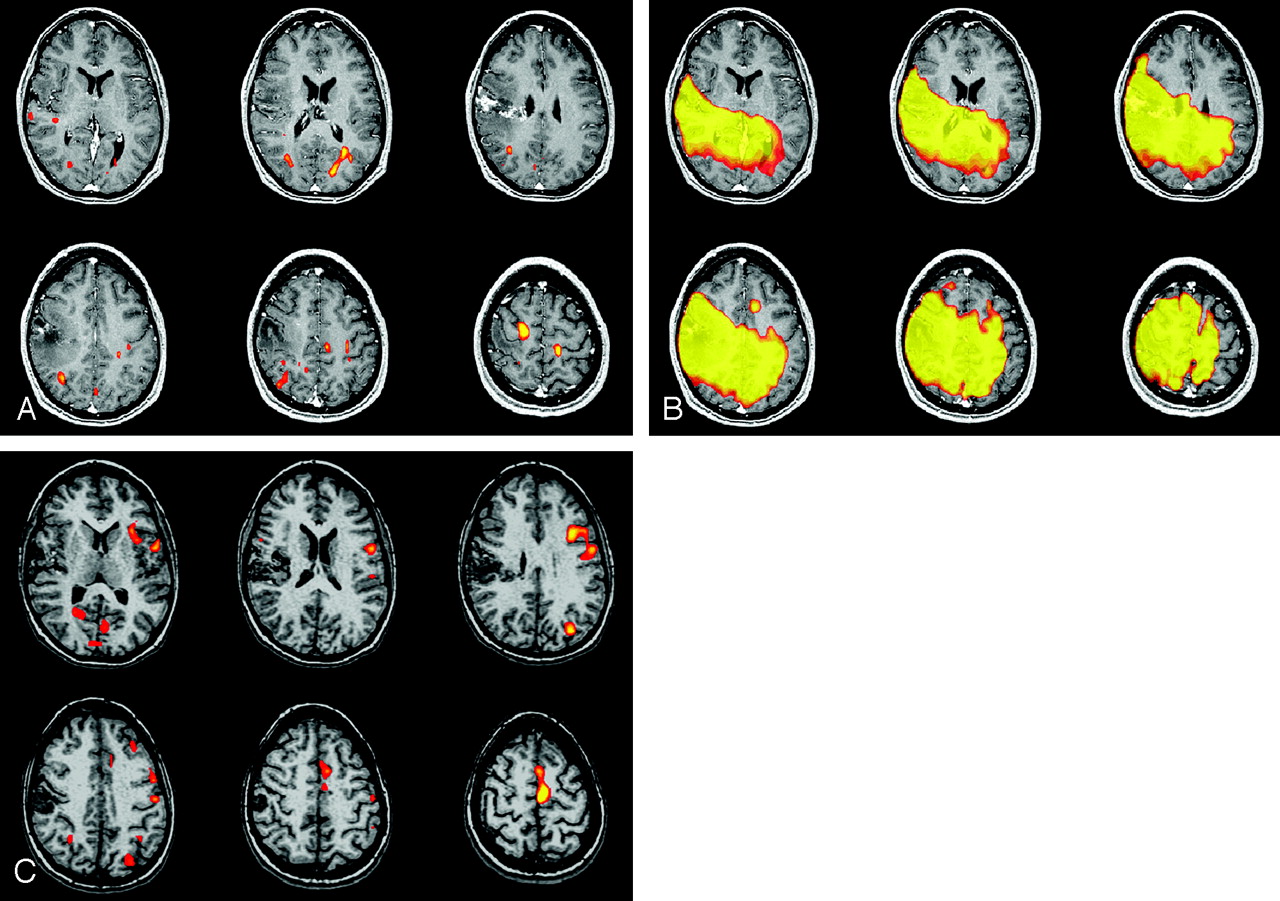
fMRIs in which three readers changed their answer when the SIM was available. (Paradigm was listening to narrated text.)
A, Readers were asked if the left auditory cortex was intact. Three responded “no,” and one responded “indeterminate.”
B, On viewing the SIM, which shows a large area of signal loss in the left temporal lobe, all four readers answered “indeterminate.” Signal intensity dropout was due to hemosiderin from an AVM.

fMRI study of language. (Paradigm was antonym word generation from visual cues).
A and B, Patient had a large susceptibility artifact, as evident on the SIM in B, due to dental braces. On the basis of the images in A, three readers considered frontal language dominance indeterminate and one fellow reader considered it right. Two staff readers considered posterior language dominance indeterminate, one fellow reader considered it right, and one fellow considered it mixed. After viewing the mask SIM, all four readers considered both frontal and posterior language dominance indeterminate.
C, Prior fMRIs obtained before the placement of dental braces clearly demonstrate left dominance for language.
Change in fMRI interpretation with SIM by neuroradiology fellows
Discussion
In this study, a susceptibility artifact distant from the skull base and not related to simple section coverage issues was present in 44% of the patients examined. The cause of the artifact was most commonly blood products, with the second most common cause being surgical site artifact. Cases with tumors and vascular malformations had a high incidence of artifacts and those cases without overt lesions had a low incidence. The artifact affected signal intensity from regions of eloquent brain in 18% of the fMRI studies performed. In 8–38% of patients, clinical interpretations changed with the availability of an SIM. Whether regions of activation were necessary or specific for the tasks was not tested in this study.
Case mix and reader biases may have affected the results of this study. The types of cases referred for fMRI may vary between institutions. In a series of patients with nonlesional epilepsy, fMRI artifacts are unlikely. In series of patients with tumors or vascular lesions, however, a high incidence of artifacts is likely. Our incidence of artifacts may differ from that in other experiences. In addition, areas of potential false activation secondary to susceptibility artifact caused by motion are not identified by the SIM. The blinded-reader study was designed to minimize the effect of reader bias. For readers who anticipated knowing that they would review cases with the SIM, the effect of the bias may have been to increase the proportion of cases that they interpreted overcautiously in the first review. As they reviewed cases with the SIM, all readers may have become more conservative in their readings as a result of seeing the extent of the artifacts. Additional studies of the effect of SIM on fMRI interpretation may be warranted to minimize biases in this study.
To our knowledge, the incidence of susceptibility artifacts in fMRI and their effect on readings has not been reported. The effect of susceptibility on BOLD effect has been measured (4, 18) and quantified for susceptibility effects related to anatomic tissue variation present in all patients (air filled sinuses, bone, etc.). A mask, based on the signal intensity-to-noise ratio rather than the signal intensity, has been described in the past and its use illustrated with one clinical case (17). In our experience, the anatomic susceptibility artifact compares well with that Ojemann et al (4) described.
The importance of this study is that patients with focal cerebral lesions have a high incidence of susceptibility artifacts, the presence and size of which cannot be determined solely by inspecting the anatomic images. These artifacts can be detected by means of the SIM. The availability of the SIM may affect interpretation of the fMRI in as many as 12% of cases with experienced readers and as many as 38% of cases for less experienced readers.
Conclusion
Although raw EPIs acquired for fMRI provide some estimate of the extent of susceptibility artifacts, the SIM facilitates the estimation and improves its accuracy because the SIM is precisely co-registered to anatomic images. This study demonstrates a high incidence of susceptibility artifact in patients referred for clinical fMRI. The SIM reveals the area and extent of artifact, helping us to avoid misinterpretation caused by attributing lack of signal intensity to cortical dysfunction instead of underlying susceptibility artifact.
Footnotes
Presented at the 42nd Annual Meeting of the American Society of Neuroradiology, Seattle, WA, June 5–11, 2004.
References
- Received May 28, 2004.
- Accepted after revision August 27, 2004.
- Copyright © American Society of Neuroradiology
In this issue


Jump to section
Related Articles
Cited By...
- No citing articles found.