Advertisement

Main menu

  • Home
  • Content
    • Current Issue
    • Accepted Manuscripts
    • Article Preview
    • Past Issue Archive
    • Video Articles
    • AJNR Case Collection
    • Case of the Week Archive
    • Case of the Month Archive
    • Classic Case Archive
  • Special Collections
    • AJNR Awards
    • Low-Field MRI
    • Alzheimer Disease
    • ASNR Foundation Special Collection
    • Photon-Counting CT
    • View All
  • Multimedia
    • AJNR Podcasts
    • AJNR SCANtastic
    • Trainee Corner
    • MRI Safety Corner
    • Imaging Protocols
  • For Authors
    • Submit a Manuscript
    • Submit a Video Article
    • Submit an eLetter to the Editor/Response
    • Manuscript Submission Guidelines
    • Statistical Tips
    • Fast Publishing of Accepted Manuscripts
    • Graphical Abstract Preparation
    • Imaging Protocol Submission
    • Author Policies
  • About Us
    • About AJNR
    • Editorial Board
    • Editorial Board Alumni
  • More
    • Become a Reviewer/Academy of Reviewers
    • Subscribers
    • Permissions
    • Alerts
    • Feedback
    • Advertisers
    • ASNR Home

User menu

  • Alerts
  • Log in

Search

  • Advanced search
American Journal of Neuroradiology

American Journal of Neuroradiology

ASHNR American Society of Functional Neuroradiology ASHNR American Society of Pediatric Neuroradiology ASSR
  • Alerts
  • Log in

Advanced Search

  • Home
  • Content
    • Current Issue
    • Accepted Manuscripts
    • Article Preview
    • Past Issue Archive
    • Video Articles
    • AJNR Case Collection
    • Case of the Week Archive
    • Case of the Month Archive
    • Classic Case Archive
  • Special Collections
    • AJNR Awards
    • Low-Field MRI
    • Alzheimer Disease
    • ASNR Foundation Special Collection
    • Photon-Counting CT
    • View All
  • Multimedia
    • AJNR Podcasts
    • AJNR SCANtastic
    • Trainee Corner
    • MRI Safety Corner
    • Imaging Protocols
  • For Authors
    • Submit a Manuscript
    • Submit a Video Article
    • Submit an eLetter to the Editor/Response
    • Manuscript Submission Guidelines
    • Statistical Tips
    • Fast Publishing of Accepted Manuscripts
    • Graphical Abstract Preparation
    • Imaging Protocol Submission
    • Author Policies
  • About Us
    • About AJNR
    • Editorial Board
    • Editorial Board Alumni
  • More
    • Become a Reviewer/Academy of Reviewers
    • Subscribers
    • Permissions
    • Alerts
    • Feedback
    • Advertisers
    • ASNR Home
  • Follow AJNR on Twitter
  • Visit AJNR on Facebook
  • Follow AJNR on Instagram
  • Join AJNR on LinkedIn
  • RSS Feeds

AJNR Awards, New Junior Editors, and more. Read the latest AJNR updates

Research ArticlePediatric Neuroimaging

Brain Volume in Pediatric Patients with Sickle Cell Disease: Evidence of Volumetric Growth Delay?

R. Grant Steen, Temitope Emudianughe, Michael Hunte, John Glass, Shengjie Wu, Xiaoping Xiong and Wilburn E. Reddick
American Journal of Neuroradiology March 2005, 26 (3) 455-462;
R. Grant Steen
  • Find this author on Google Scholar
  • Find this author on PubMed
  • Search for this author on this site
Temitope Emudianughe
  • Find this author on Google Scholar
  • Find this author on PubMed
  • Search for this author on this site
Michael Hunte
  • Find this author on Google Scholar
  • Find this author on PubMed
  • Search for this author on this site
John Glass
  • Find this author on Google Scholar
  • Find this author on PubMed
  • Search for this author on this site
Shengjie Wu
  • Find this author on Google Scholar
  • Find this author on PubMed
  • Search for this author on this site
Xiaoping Xiong
  • Find this author on Google Scholar
  • Find this author on PubMed
  • Search for this author on this site
Wilburn E. Reddick
  • Find this author on Google Scholar
  • Find this author on PubMed
  • Search for this author on this site
  • Article
  • Figures & Data
  • Info & Metrics
  • Responses
  • References
  • PDF
Loading

Article Figures & Data

Figures

  • Tables
  • Fig 1.
    • Download figure
    • Open in new tab
    • Download powerpoint
    Fig 1.

    Images obtained in a 7.8-year-old girl with SCD show how image segmentation was performed.

    A and B, T1-weighted (A) and T2-weighted (B) MR images obtained at the same section level.

    C, Segmented image made by combining T1-weighted, T2- or proton density-weighted, and FLAIR images shows 16 types of tissue as nine different gray scale levels.

    D, Segmented and classified image shows gray matter (yellow), white matter (green), blood vessels and membranes (dark blue), and CSF (light blue). To calculate central gray matter (basal ganglia) volume separate from cortical volume, all tissues external to the basal ganglia were erased. The cortical gray matter volume was then calculated as a function of total gray matter volume minus central gray matter volume.

  • Fig 2.
    • Download figure
    • Open in new tab
    • Download powerpoint
    Fig 2.

    Scatterplot shows volume of all tissues in patients with SCD and in healthy control children.
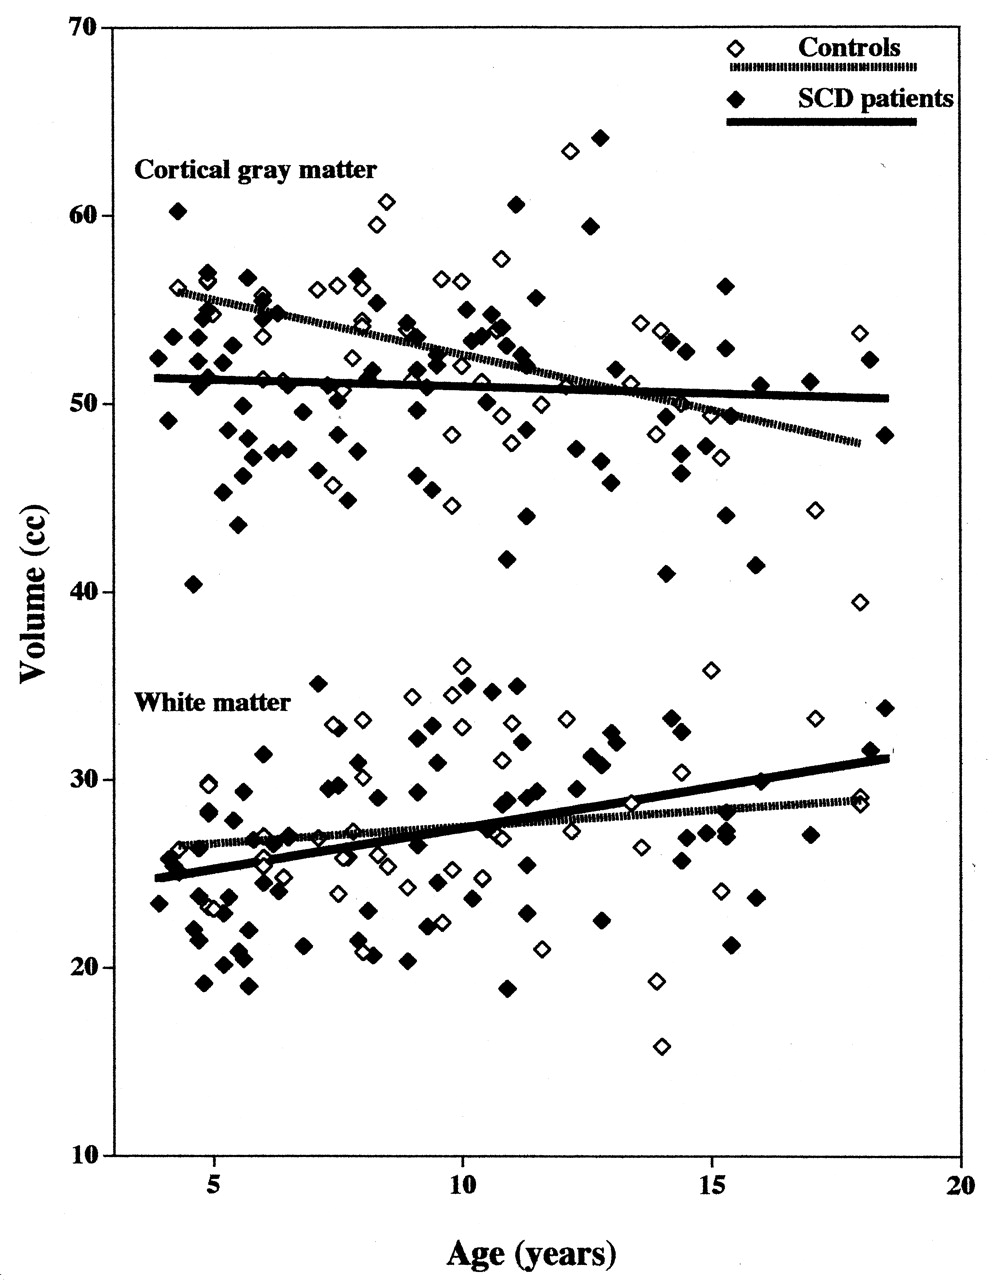
  • Fig 3.
    • Download figure
    • Open in new tab
    • Download powerpoint
    Fig 3.

    Scatterpolots show cortical gray matter volume (top) and white matter volume (bottom) in patients with SCD and in healthy control children.

Tables

  • Figures
    • View popup
    TABLE 1:

    Validation of the methods for measuring brain volume performed in five volunteers

    StructureVolume (mL) Measured by 5-mm Thick SectionsVolume (mL) Measured by 3-mm Thin Sections
    White matter33.86 ± 3.3334.00 ± 3.02
    Gray matter58.28 ± 3.7758.44 ± 3.60
    CSF9.68 ± 3.269.54 ± 3.18
    • Note.—Data are mean ± SD. The mean difference between the two methods was 0.053 mL. A paired t test comparing 15 measurements made on thick sections to the same measurements made on thin sections was not significant (t statistic = 0.5524 with 14 degrees of freedom; P = .589).

    • View popup
    TABLE 2:

    Comparison of descriptive data in patients with SCD and control subjects without controlling for age

    ComparisonPatients (n = 83)*Controls (n = 43)*% DifferenceP value†
    Subject age (y)9.36 ± 3.8310.02 ± 3.61−6.40NS
    Proportion male (%)56.658.1−2.60NS
    Volume (mL)
        Total brain94.72 ± 8.1197.24 ± 6.10−2.60.04
        White matter27.16 ± 4.5527.52 ± 4.59−1.30NS
        Gray matter61.30 ± 6.1063.99 ± 5.18−4.20.01
        Central gray matter10.60 ± 1.4611.32 ± 1.51−6.40.01
        Cortical gray matter50.96 ± 4.3752.58 ± 4.59−3.10.03
        CSF6.26 ± 2.555.73 ± 1.909.20NS
    • Note.—NS indicates not significant. Age did not differ significantly between patients and controls, so this approach may be valid.

    • * Data are mean ± SD.

    • † Statistical testing was performed with a two-sample t test.

    • View popup
    TABLE 3:

    Least-squares means of brain volumes between the 83 patients with SCD and 43 control subjects as a function of age

    Volume and Group5.0 Years OldP Value9.5 Years OldP Value11.50 YearsP Value
    Total brain
        Control98.29 ± 1.94.012797.35 ± 1.13NS96.93 ± 1.21NS
        SCD92.49 ± 1.2294.79 ± 0.8095.82 ± 0.92
    White matter
        Control26.63 ± 1.16NS27.43 ± 0.68NS27.79 ± 0.72NS
        SCD25.25 ± 0.7227.22 ± 0.4828.10 ± 0.55
    Gray matter
        Control67.47 ± 1.50.000464.35 ± 0.87.005262.96 ± 0.94NS
        SCD61.07 ± 0.9461.30 ± 0.6261.41 ± 0.71
    Central gray matter
        Control11.98 ± 0.38.001411.39 ± 0.22.004511.13 ± 0.24NS
        SCD10.51 ± 0.2410.60 ± 0.1610.64 ± 0.18
    Cortical gray matter
        Control55.54 ± 1.14.002152.89 ± 0.67.019551.71 ± 0.72NS
        SCD51.29 ± 0.7250.95 ± 0.4850.80 ± 0.54
    CSF
        Control4.18 ± 0.61.00675.56 ± 0.36NS6.18 ± 0.38NS
        SCD6.17 ± 0.386.27 ± 0.266.31 ± 0.29
    • Note.—NS indicates not significant. Data are mean ± standard error.

    • View popup
    TABLE 4:

    Age-related change in brain volume in 83 patients with SCD and 43 control subjects

    EffectEstimate*Standard ErrorP Value†
    Total brain volume
        Intercept for controls99.343.36<.0001
        Intercept for SCD89.932.12<.0001
        Age × controls−0.210.32NS
        Age × SCD patients0.510.21.0162
    White matter
        Intercept for controls25.742.00<.0001
        Intercept for SCD23.061.27<.0001
        Age × controls0.180.19NS
        Age × SCD patients0.440.13.0007
    Gray matter
        Intercept for controls70.952.59<.0001
        Intercept for SCD60.811.63<.0001
        Age × controls−0.690.24.0050
        Age × SCD patients0.050.16NS
    Central gray matter
        Intercept for controls12.640.66<.0001
        Intercept for SCD10.410.42<.0001
        Age × controls−0.130.06.0360
        Age × SCD patients0.020.04NS
    Cortical gray matter
        Intercept for controls58.491.98<.0001
        Intercept for SCD51.661.25<.0001
        Age × controls−0.590.19.0019
        Age × SCD patients−0.070.12NS
    CSF
        Intercept for controls2.651.05.0130
        Intercept for SCD6.050.66<.0001
        Age × controls0.310.10.0024
        Age × SCD patients0.020.07NS
    • * Estimates of fitted model between groups.

    • † The P value for the “Intercept for controls” and the “Intercept for SCD” tests whether the respective intercept is significantly different from zero. The P value for “Age × controls” and “Age × SCD patients” tests whether there is a significant effect of age in controls and patients, respectively, by testing whether the slope is significantly different from zero slope.

    • View popup
    TABLE 5:

    Least-squares means of brain volumes as a function of genotype in 70 patients with hemoglobin SS, 20 control subjects with hemoglobin AS, and 23 control subjects with hemoglobin AA

    Volume and Genotype5.0 Years Old9.5 Years Old11.5 Years Old
    Total brainMeans ± SE
        AA98.79 ± 2.5097.51 ± 1.5796.95 ± 1.66
        AS97.37 ± 3.2897.12 ± 1.7097.01 ± 1.87
        SS92.18 ± 1.3494.59 ± 0.8995.66 ± 1.00
    P Value
        AA vs SS0.0217NSNS
        AS vs SSNSNSNS
        AA vs ASNSNSNS
    White matterMeans ± SE
        AA25.61 ± 1.4726.53 ± 0.9226.94 ± 0.98
        AS27.90 ± 1.9328.48 ± 0.9928.73 ± 1.10
        SS25.00 ± 0.7926.96 ± 0.5327.83 ± 0.59
    P Value
        AA vs SSNSNSNS
        AS vs SSNSNSNS
        AA vs ASNSNSNS
    Gray matterMeans ± SE
        AA68.95 ± 1.9565.55 ± 1.1964.03 ± 1.26
        AS65.52 ± 2.4962.95 ± 1.2961.82 ± 1.40
        SS60.70 ± 1.0261.17 ± 0.6861.37 ± 0.77
    P Value
        AA vs SS0.00020.0018NS
        AS vs SSNSNSNS
        AA vs ASNSNSNS
    Central gray matterMeans ± SE
        AA11.99 ± 0.4911.37 ± 0.3111.09 ± 0.32
        AS11.94 ± 0.6411.41 ± 0.3311.17 ± 0.37
        SS10.48 ± 0.2610.61 ± 0.1810.66 ± 0.20
    P Value
        AA vs SS0.00780.0340NS
        AS vs SS0.03740.0343NS
        AA vs ASNSNSNS
    Cortical gray matterMeans ± SE
        AA56.96 ± 1.4554.18 ± 0.9152.94 ± 0.96
        AS53.80 ± 1.9051.40 ± 0.9850.33 ± 1.08
        SS51.07 ± 0.7850.86 ± 0.5250.77 ± 0.58
    P Value
        AA vs SS0.00050.0019NS
        AS vs SSNSNSNS
        AA vs ASNS0.0397NS
    CSFMeans ± SE
        AA4.22 ± 0.775.44 ± 0.485.98 ± 0.51
        AS3.95 ± 1.005.70 ± 0.526.47 ± 0.58
        SS6.48 ± 0.416.46 ± 0.286.45 ± 0.31
    P Value
        AA vs SS0.0111NSNS
        AS vs SS0.0221NSNS
        AA vs ASNSNSNS
    • Note.—NS indicates not significant; SE, standard error.

PreviousNext
Back to top

In this issue

American Journal of Neuroradiology: 26 (3)
American Journal of Neuroradiology
Vol. 26, Issue 3
1 Mar 2005
  • Table of Contents
  • Index by author
Advertisement
Print
Download PDF
Email Article

Thank you for your interest in spreading the word on American Journal of Neuroradiology.

NOTE: We only request your email address so that the person you are recommending the page to knows that you wanted them to see it, and that it is not junk mail. We do not capture any email address.

Enter multiple addresses on separate lines or separate them with commas.
Brain Volume in Pediatric Patients with Sickle Cell Disease: Evidence of Volumetric Growth Delay?
(Your Name) has sent you a message from American Journal of Neuroradiology
(Your Name) thought you would like to see the American Journal of Neuroradiology web site.
CAPTCHA
This question is for testing whether or not you are a human visitor and to prevent automated spam submissions.
Cite this article
R. Grant Steen, Temitope Emudianughe, Michael Hunte, John Glass, Shengjie Wu, Xiaoping Xiong, Wilburn E. Reddick
Brain Volume in Pediatric Patients with Sickle Cell Disease: Evidence of Volumetric Growth Delay?
American Journal of Neuroradiology Mar 2005, 26 (3) 455-462;

Citation Manager Formats

  • BibTeX
  • Bookends
  • EasyBib
  • EndNote (tagged)
  • EndNote 8 (xml)
  • Medlars
  • Mendeley
  • Papers
  • RefWorks Tagged
  • Ref Manager
  • RIS
  • Zotero
0 Responses
Respond to this article
Share
Bookmark this article
Brain Volume in Pediatric Patients with Sickle Cell Disease: Evidence of Volumetric Growth Delay?
R. Grant Steen, Temitope Emudianughe, Michael Hunte, John Glass, Shengjie Wu, Xiaoping Xiong, Wilburn E. Reddick
American Journal of Neuroradiology Mar 2005, 26 (3) 455-462;
del.icio.us logo Twitter logo Facebook logo Mendeley logo
  • Tweet Widget
  • Facebook Like
  • Google Plus One

Jump to section

  • Article
    • Abstract
    • Methods
    • Results
    • Discussion
    • Conclusion
    • In Memoriam
    • Acknowledgments
    • Footnotes
    • References
  • Figures & Data
  • Info & Metrics
  • Responses
  • References
  • PDF

Related Articles

  • No related articles found.
  • PubMed
  • Google Scholar

Cited By...

  • Differences in Activation and Deactivation in Children with Sickle Cell Disease Compared with Demographically Matched Controls
  • A Prospective Longitudinal Brain Morphometry Study of Children with Sickle Cell Disease
  • White Matter Damage in Asymptomatic Patients with Sickle Cell Anemia: Screening with Diffusion Tensor Imaging
  • Crossref
  • Google Scholar

This article has not yet been cited by articles in journals that are participating in Crossref Cited-by Linking.

More in this TOC Section

  • Clinical SVR of Fetal Brain MRI
  • Sodium MRI in Pediatric Brain Tumors
  • FRACTURE MR in Congenital Vertebral Anomalies
Show more Pediatric Neuroimaging

Similar Articles

Advertisement

Indexed Content

  • Current Issue
  • Accepted Manuscripts
  • Article Preview
  • Past Issues
  • Editorials
  • Editor's Choice
  • Fellows' Journal Club
  • Letters to the Editor
  • Video Articles

Cases

  • Case Collection
  • Archive - Case of the Week
  • Archive - Case of the Month
  • Archive - Classic Case

More from AJNR

  • Trainee Corner
  • Imaging Protocols
  • MRI Safety Corner
  • Book Reviews

Multimedia

  • AJNR Podcasts
  • AJNR Scantastics

Resources

  • Turnaround Time
  • Submit a Manuscript
  • Submit a Video Article
  • Submit an eLetter to the Editor/Response
  • Manuscript Submission Guidelines
  • Statistical Tips
  • Fast Publishing of Accepted Manuscripts
  • Graphical Abstract Preparation
  • Imaging Protocol Submission
  • Evidence-Based Medicine Level Guide
  • Publishing Checklists
  • Author Policies
  • Become a Reviewer/Academy of Reviewers
  • News and Updates

About Us

  • About AJNR
  • Editorial Board
  • Editorial Board Alumni
  • Alerts
  • Permissions
  • Not an AJNR Subscriber? Join Now
  • Advertise with Us
  • Librarian Resources
  • Feedback
  • Terms and Conditions
  • AJNR Editorial Board Alumni

American Society of Neuroradiology

  • Not an ASNR Member? Join Now

© 2025 by the American Society of Neuroradiology All rights, including for text and data mining, AI training, and similar technologies, are reserved.
Print ISSN: 0195-6108 Online ISSN: 1936-959X

Powered by HighWire