
Abstract
BACKGROUND AND PURPOSE: Despite the large body of data available about somatic growth delay in patients with sickle cell disease (SCD), virtually nothing is known about the effect of the disease on volumetric growth of the brain. This study was designed to test a hypothesis that children with SCD have a disease-related delay in brain volumetric growth compared with healthy children.
METHODS: A cross-sectional study design was used to evaluate 83 children with SCD and 43 age-similar healthy children, including 27 patient siblings. Brain volume was measured by segmenting and classifying MR imaging data, by using at least three separate image sets (T1-, T2-, and proton density-weighted MR images). A linear model was used to compare the various brain volumes with the covariates of group (patient versus control) and age, with age treated as a continuous variable.
RESULTS: With age controlled for, no significant difference was noted in total brain volume between patients and control subjects at age 9.5 years. However, patients showed a deficit specifically in gray matter volume (P = .005), without significant differences in white matter or ventricular volume. The deficit in patient gray matter was greater in central gray matter (P < .005) than in cortical gray matter (P < .02). In healthy control subjects, gray matter volume decreased significantly with age (P < .005), probably due to myelination of white matter tracts. In patients with SCD, gray matter volume did not change with age.
CONCLUSION: Volumetric growth of brain gray matter may be delayed in children with SCD, suggesting that there may be neurodevelopmental consequences of this disease.
Children with sickle cell disease (SCD) tend to have impaired somatic growth, delayed puberty (1–3), and reduced bone mineral density (4). Neonates with SCD are of normal height and weight at birth, but they lag behind their peers by the 6th month of life (5). Patients with hemoglobin SS, the most severe form of SCD, have progressive deficits in weight and height by 2 years of age, relative to children with normal hemoglobin (6). Deficits in body weight and body mass index persist throughout childhood (1, 7–9), with an increasing deficit into adulthood in both sexes (3, 6, 10–13). Reduced body size is often associated with low hematocrit values (13, 14), suggesting that somatic growth may be impaired by chronic anemia (13).
Despite the large body of data available on somatic growth delay in patients with SCD, virtually nothing is known about the effect of the disease on volumetric growth of the brain. Preliminary data suggest that the volume of the caudate head is smaller in patients with SCD (15), but this was an anecdotal observation. Because both somatic growth (1–13) and cognitive ability (16, 17) tend to be impaired in patients with SCD, this suggests a hypothesis of impairment in brain volumetric growth in these patients. To test this hypothesis, we analyzed clinical MR imaging data from children with SCD and compared them to the data from age-similar healthy children. Because SCD has been shown to have a diffuse effect on the brain (15–17), we took the approach of segmenting an anatomically defined subsample of the brain; this approach has been validated in our laboratory as a way to minimize processing time without sacrificing accuracy (18).
Methods
Study Subjects
All patients with SCD and control subjects were enrolled on a protocol approved by the Institutional Review Board at St. Jude Children’s Research Hospital. Patients or guardians of all children signed an informed consent form after a brief description of the protocol, whereas adult subjects (older than 18 years) signed their own informed consent form. All children assented to participation.
We imaged a total of 87 patients with SCD between October 1999 and March 2003. Four patients were excluded from further analysis because they had a clinically documented stroke. Among the remaining 83 patients (47 male [57%] and 36 female [43%] patients), their ages ranged from 3.9 to 18.5 years (mean age, 9.4 ± 3.8 years [SD]). The patients mostly had hemoglobin SS (n = 70), the most serious form of SCD, although there were 11 patients with hemoglobin SC, one with hemoglobin Sβ+, and one whose hemoglobin phenotype was unknown.
We also imaged 43 healthy control subjects during the same period (26 male [61%] and 17 female [39%] subjects whose ages ranged from 4.3 to 18.0 years (mean age, 10.0 ± 3.6 years). The control group included 27 healthy siblings of the patients with SCD, as well as 16 healthy subjects who were either the healthy siblings of other hospital patients or the children of hospital personnel. Among the control subjects, there were 23 subjects with hemoglobin AA and 20 subjects with hemoglobin AS (sickle cell trait).
MR Imaging
MR imaging evaluations were performed with a 1.5T Vision (Siemens Medical Systems, Iselin, NJ) whole-body imager by using a standard head coil. Weekly quality assurance monitoring of field homogeneity and eddy current compensation was performed, and image quality was monitored daily as a part of the clinical imaging program.
A standard protocol for all subjects included a T1-weighted gradient-echo sequence (Fig 1A) and a T2- or proton density-weighted dual spin-echo sequence (Fig 1B). A fluid-attenuated inversion-recovery (FLAIR) sequence was added in March 2000. All images were acquired in the transverse imaging plane, with the central section of each sequence angled so that the bottom of the section was congruent with the bottom of the genu and splenium on the sagittal scout image. Setting up the acquisition in this way is a highly reproducible way to sample the brain in children (15, 18). Before March 2000, all images were acquired at 5-mm section thickness with a 1-mm gap, to avoid cross talk between section excitations. Beginning in March 2000, all images were acquired as 3-mm sections with a 3-mm gap, then each sequence was repeated with a 3-mm offset, to give 100% coverage of the brain volume. To determine whether the two methods of measuring brain volume gave equivalent results, we undertook a small study comparing the brain volume of five volunteers by using both methods.

Images obtained in a 7.8-year-old girl with SCD show how image segmentation was performed.
A and B, T1-weighted (A) and T2-weighted (B) MR images obtained at the same section level.
C, Segmented image made by combining T1-weighted, T2- or proton density-weighted, and FLAIR images shows 16 types of tissue as nine different gray scale levels.
D, Segmented and classified image shows gray matter (yellow), white matter (green), blood vessels and membranes (dark blue), and CSF (light blue). To calculate central gray matter (basal ganglia) volume separate from cortical volume, all tissues external to the basal ganglia were erased. The cortical gray matter volume was then calculated as a function of total gray matter volume minus central gray matter volume.
Quantitative Analysis of MR Imaging Data
Image registration was performed for each examination (19), to align features in one image set to correspond to features in a related image set, by matching voxels that contain high-intensity gradient magnitudes. A postprocessing algorithm to correct radio-frequency inhomogeneity in the imaging sets was used to ensure uniform signal intensity throughout the brain volume (20). An added advantage of the radio-frequency correction method is the automated removal of extrameningeal tissues, which reduces the amount of postprocessing necessary on the segmented images.
A semi-automated hybrid neural network method (21) was used to segment and classify images, to objectively categorize gray matter and white matter. A sample image (Fig 1C) shows the 16 gray-scale levels in a segmented image. These 16 classifications were mapped in four colors (corresponding to gray matter, white matter, CSF, and vessels or membranes) (Fig 1D), by using a color scheme similar to that used for positron emission tomography. This image was then imported into PhotoShop running on a Macintosh, and the histogram feature was used to measure the number of pixels of each tissue type. To separately determine the number of pixels in central gray matter (basal ganglia) and cortical gray matter, cortical gray matter pixels were erased in the PhotoShop image, and the histogram feature was used to count the number of central gray matter pixels. The number of cortical gray matter pixels was then calculated by subtracting central gray matter pixels from total gray matter pixels. Previous work (18, 20–22) has established that these methods are valid and robustly reliable.
The volume of brain parenchyma was calculated by multiplying the number of pixels of each tissue type by the known pixel volume. Pixel volumes were summed across the full volume of interest, and the following equation was used to calculate brain volume: Brain Volume (mL) = (Pixel Count • [FOV/256]2 • Section Thickness)/1000, where FOV was either 210 or 230 mm and section thickness was either 3 or 5 mm. In the earlier examinations in which a 5-mm section thickness was used, this section was interpolated to an effective section thickness of 6 mm. In the later examinations in which a 3-mm section thickness was used, two adjacent sections were summed to obtain an effective section thickness of 6 mm.
Volume calculations are thus based on a 6-mm slab through the basal ganglia (Fig 1), regardless of which section thickness was used during imaging. Volume estimation from such an anatomically defined subset of a full clinical examination significantly correlated with the whole cerebrum (r ≈ 0.94), with an average error of 2% in total gray matter volume and 6% in total white matter volume (18).
Effects of Blood Phenotype on Brain Volume
Hemoglobin phenotype (AA, AS, SS) data were obtained concurrent with imaging. For this secondary analysis, we excluded 13 patients with a hemoglobin phenotype other than SS. Our hypothesis was that there would be a relationship between hemoglobin phenotype and brain volume, such that patients with hemoglobin SS would have a smaller brain volume than that of children with hemoglobin AA or AS.
Statistical Analysis
A general linear model was used to estimate mean brain volume as a linear function of age at MR imaging, with separate analyses for volume of all tissues, white matter, gray matter, and CSF. In this model, brain volume was the response variable, whereas the subject group (patient versus control) and the age at MR imaging were covariates. We also used gender as a covariate, but preliminary analysis suggested that gender did not have a significant effect on brain volume in these children. Since boys and girls were equally represented in the two subject groups, we did not include gender in the final analysis. Brain volume was fitted as a function of the following equation: Volume = (Intercept for Group) + (Age • Group), where group is the subject group (patients with SCD versus control subjects). We compared baseline brain volume (intercept) and the rate of change of brain volume (slope) between the two groups, and we also compared the mean volume between groups at various ages. All analyses were performed using the SAS/STAT statistical package (23).
Results
Method Validation
A comparison of brain volume measured in five subjects by the two different methods (3-mm thin section versus 5-mm thick section) showed no significant differences that could be attributed to the method itself (Table 1). This suggests that comparing results from the two methods is legitimate.
Validation of the methods for measuring brain volume performed in five volunteers
Descriptive Comparison of Brain Volume
Patients and healthy control subjects did not differ significantly in age, suggesting that age-related differences between patients and control subjects should be negligible (Table 2). Total brain volume was significantly less (P < .04) in patients than in healthy control subjects. There was 4% less gray matter volume in patients (P < .01), with a greater deficit in central gray matter (basal ganglia) volume (6%, P < .01) than in cortical gray matter volume (3%, P < .03). No significant difference was noted in either white matter volume or ventricular volume between patients with SCD and control subjects (Table 2).
Comparison of descriptive data in patients with SCD and control subjects without controlling for age
Modeling Brain Volume Differences
A scatterplot of total brain volume (Fig 2) suggests that age-related trends in growth may differ between patients and control subjects. Even though patient and control ages were not significantly different, patients were about 8 months younger than control subjects (Table 2). Thus, it is possible that the age difference between patients and control subjects is clinically significant, even though it is not statistically significant.

Scatterplot shows volume of all tissues in patients with SCD and in healthy control children.
Therefore, we controlled for differences in age between patients and control subjects by modeling brain volume as a function of age at 9.5 years, the grand mean age, or the average age across all subjects (Table 3). This approach should maximize sensitivity to volume differences between patients and control subjects, since the grand mean age is the age at which results are statistically the most robust. When age was controlled for in this way, there was no longer a difference in total volume of all tissues between patients and control subjects. Yet the difference in gray matter volume between patients and control subjects became more robustly significant (P = .005). The deficit in patient gray matter was larger and more significant in central gray matter (P < .005) than in cortical gray matter (P < .02). No significant differences were noted between patients and control subjects in white matter or ventricular volume (Table 3).
Least-squares means of brain volumes between the 83 patients with SCD and 43 control subjects as a function of age
A least-squares approach was then used to compare brain volume in patients and control subjects at age 5 years and at age 11.5 years (Table 3). At age 5 years, patients showed volume deficits in total brain volume (P = .01), in total gray matter volume (P = .0004), in central gray matter volume (P = .001), and in cortical gray matter volume (P = .002). There was an excess of CSF volume in patients (P < .007). By age 11.5 years, all of these differences had become nonsignificant.
We modeled the effects of SCD and subject age on brain volume by using a univariate approach (Table 4). For healthy control subjects, total brain volume was Volume = 99.34 + (−0.21 • Age), whereas for patients with SCD, total brain volume was Volume = 89.93 + (0.51 • Age).
Age-related change in brain volume in 83 patients with SCD and 43 control subjects
No significant interaction was noted between age and total brain volume in control subjects, suggesting that volumetric growth of the brain is complete in children by about age 5 years (Table 4). However, among control subjects, a significant age-related decrease was noted in volume of gray matter (P = .005), central gray matter (P < .04), and cortical gray matter (P < .002), whereas volumes of total brain volume and white matter in the control subjects did not change as a function of age (Table 4).
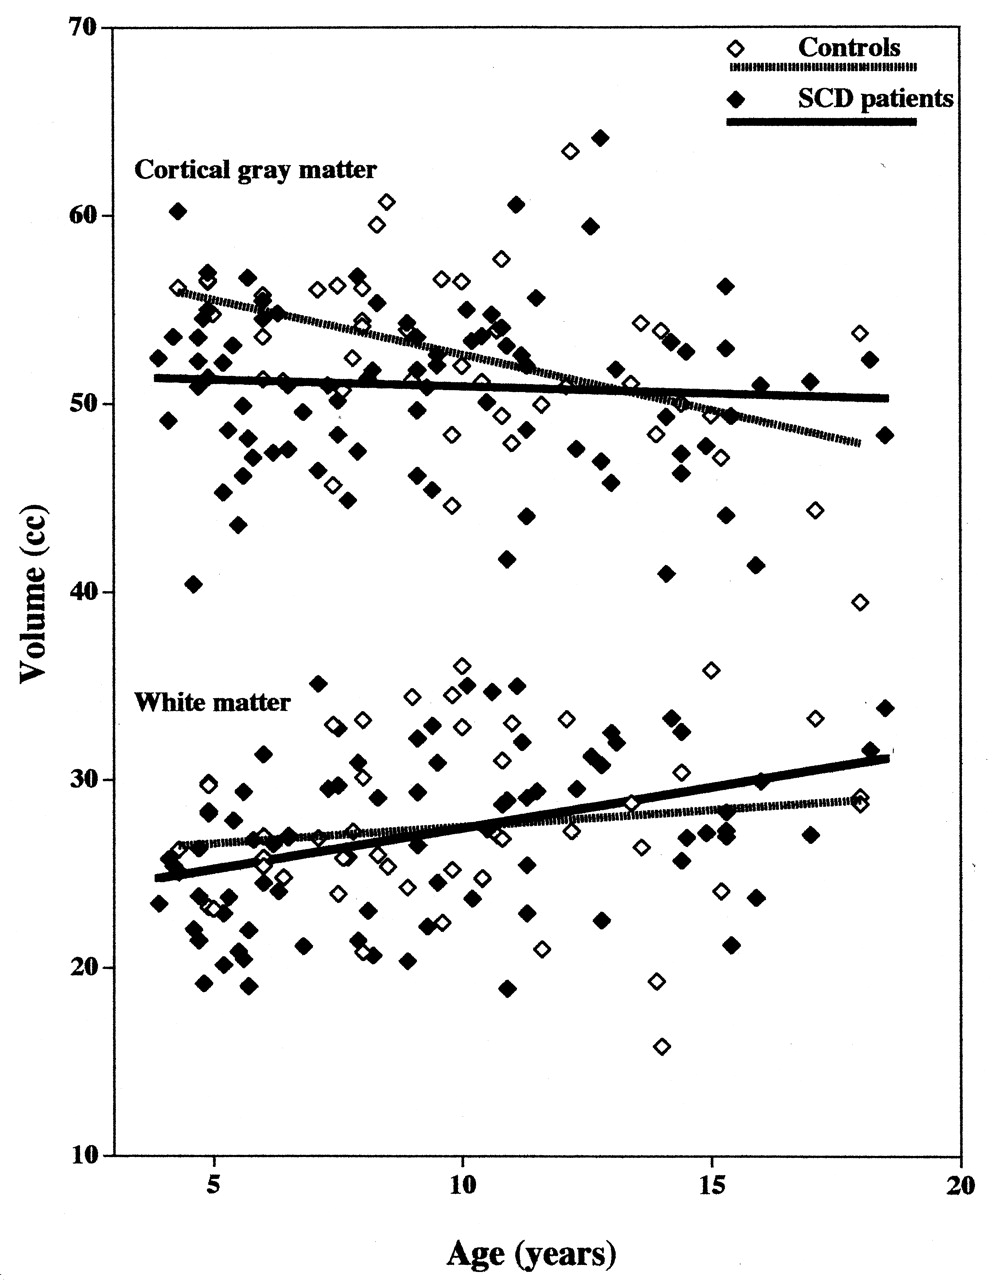
Conversely, among patients, a significant age-related increase was noted in total brain volume (P < .02) and volume of white matter (P = .0007), suggesting that the brain is still growing and myelinating in patients of the age range studied. No significant change was noted in volume of gray matter, central gray matter, or cortical gray matter (Table 4). Thus, there are significant trend differences between patients and control subjects (Fig 3). The finding that brain volume trends are in opposite directions in patients and control subjects could account for the fact that differences between patients and control subjects disappear by age 11.5 years (Table 3).

Scatterpolots show cortical gray matter volume (top) and white matter volume (bottom) in patients with SCD and in healthy control children.
Effects of Hemoglobin Phenotype on Brain Volume
Patients with hemoglobin SS were significantly different fromcontrol children with hemoglobin AA in many ways (Table 5). At age 5 years, patients had smaller brain volume (P = .02), smaller gray matter volume (P = .0002), smaller central gray matter volume (P < .008), smaller cortical gray matter volume (P = .0005), and larger CSF volume (P = .01). By age 9.5 years, some of these differences had disappeared, but patients still had smaller gray matter volume (P < .002), smaller central gray matter volume (P = .03), and smaller cortical gray matter volume (P < .002). By age 11.5 years, all of these differences had disappeared.
Least-squares means of brain volumes as a function of genotype in 70 patients with hemoglobin SS, 20 control subjects with hemoglobin AS, and 23 control subjects with hemoglobin AA
We also assessed whether brain volumes differed between control children with hemoglobin AS (sickle cell trait) and patients with hemoglobin SS (Table 5). This comparison is particularly important because AS control subjects were all siblings of the patients. Therefore, this comparison should control for variables such as family or genetic influences and for socioeconomic factors that can potentially impact brain volume growth. Despite the reduced sample size of control subjects available for comparison, patients had a smaller central gray matter volume at age 5 years (P < .04) and at age 9.5 years (P = .03), and a larger CSF volume at age 5.0 years (P = .02).
Finally, we assessed whether sickle cell trait itself had an effect on brain volume, by separately modeling control children with sickle trait (hemoglobin AS) and control children with hemoglobin AA (Table 5). Children with sickle trait typically do not have severe anemia (24) but they had a significantly smaller cortical gray matter volume at age 9.5 years than that of children with hemoglobin AA (P < .04), despite the reduced sample size. No other significant differences were noted between children with hemoglobin AA and those with AS.
Discussion
We report that gray matter volume is significantly smaller in patients with SCD than in healthy children (Table 2), especially when age effects are modeled (Tables 3 and 4). Volumetric deficits in patients are larger and more significant in central gray matter than in cortical gray matter (Table 3), and gray matter deficits appear to be a function of different patterns of volumetric growth in patients and healthy children (Table 4). Specifically, patient total brain volume significantly increases at an age when control brain volume has already stabilized (Fig 2, Table 4). The changes that we describe could be the result of normal developmental processes that are occurring at a slower-than-normal rate (Table 4), as a function of hemoglobin type (Table 5). Alternatively, patients with SCD may be showing subtle neurodevelopmental effects of their disease.
The limitations of this study arise mostly from the cross-sectional study design. All the data we report are cross-sectional, yet we are using these data to infer patterns of growth over time (Fig 3). This can be risky if there are significant differences in the composition of the patient and control groups, or if volumetric growth of brain tissues is not linear. We are reasonably confident that the composition of the patient and control groups is comparable (Table 2), both in terms of gender and in terms of age distribution. However, we cannot be sure that brain volumetric growth is linear, even though we have chosen to fit our data with a linear model. We elected to use a simple linear fit since such a model is more easily disproven than either a model with more terms or a model with quadratic functions (25). However, if more data were available, it might become preferable to use a more sophisticated model. A nonlinear model might be especially important if there are subtle interactions between age and disease. Because patients with SCD tend to be at greatest risk of stroke in the age range of 4–9 years (26), it is reasonable to propose that there is an increase in the rate of brain volumetric growth during this period (16). A linear model would not be an adequate description of such a growth spurt, particularly if healthy children do not have a similarly timed spurt (27).
Another potential limitation of this study is that we measured brain volume in a single slab, rather than in the entire brain volume. We believe that this approach is justified in these patients by the finding that SCD has a diffuse effect on the entire brain (15–17). There is compelling evidence that every gray matter tissue is impacted by SCD, both in terms of the risk of focal injury (15) and in terms of diffuse effects on gray matter T1 (16, 25). Furthermore, the approach of evaluating a subsample of the brain has been validated in our laboratory as a way to minimize image-processing time without sacrificing accuracy (18).
A third potential limitation of our study is that we did not incorporate sex into the final analysis. A preliminary analysis of our data found significant effects of age on brain volume, but interactions with covariates (group x gender) and (group x age x gender) were not statistically significant. Therefore, we elected to leave gender out of the final analysis, since the proportion of boys was nearly equivalent in the patient and control groups. We are aware that cerebral volume is roughly 9% larger in male than in female subjects (28, 29), but earlier studies have shown that there are no sex-related differences in patterns of gray matter or white matter growth, after correcting for brain volume (29). Similarly, we elected to leave race out of the final analysis, since brain volumetric growth in black and white infants is equivalent, and brain growth rate in young children is related neither to race nor to gender (30).
The pattern of volumetric growth in healthy children has been moderately well characterized. Intracranial volume increases by only ∼300 mL from age 3 months to 10 years (31), and there is little change in total cerebral volume after the age of 5 years (32, 33). Cortical gray matter volume peaks at age 4 years and decreases thereafter, whereas cortical white matter volume increases until at least age 20 years (31), due to the ongoing process of brain myelination. At age 9 years, white matter volume is only 85% of adult volume, whereas gray matter volume is actually larger than the adult volume, since white matter myelination is not complete until well past age 9 years (34). In general, white matter volume increases at a faster rate than gray matter volume throughout early childhood, as myelination proceeds (34, 35). Cross-sectional data in healthy children had suggested a plateau in gray matter volume by about age 13 years (36), but recent longitudinal data suggest that gray matter volume actually peaks at age 12 years and begins to decline thereafter (37). There is no significant difference in rate of volume loss as a function of sex (37).
Our data suggest that there is a decrease in cortical gray matter volume in healthy children between the ages of 5 and 11.5 years (Tables 3 and 4), which is consistent with the literature (31). Many studies have shown that gray matter volume decreases with age in adults (31, 38–41), although fewer studies have documented loss of gray matter volume in adolescents (31, 42–45) or children (29, 31, 43, 45). Our study is actually more unusual in reporting that patients with SCD do not show an age-related decrement in gray matter.
Our results suggest that brain volume in young patients is smaller than normal because brain growth processes are delayed or impaired in children with SCD (Tables 3 and 4). In particular, we note that total brain volume is still increasing significantly in patients at an age when brain volumetric growth has already ceased in control subjects (Table 4). Furthermore, patients had 9% less gray matter than control subjects at age 5.0 years (P = .0004) and 5% less gray matter than control subjects at age 9.5 years (P = .0052) (Table 3). The volumetric deficit in gray matter of patients cannot be accounted for by encephalomalacia, since this should result in a progressive decrease in the volume of white matter over time, whereas a significant increase in white matter was actually seen in patients (Table 4). Although our prior work shows that patients with SCD can have an age-related increase in encephalomalacia (46), we excluded patients with clinical stroke from this analysis. Furthermore, if encephalomalacia had caused a significant gray matter volume loss in patients, one would expect the CSF volume to increase with age, but no significant age-related increase in patient CSF volume was seen (Table 4). We noted a significant age-related increase in CSF volume in the control subjects, which may result from the significant age-related decrease in volume of central and cortical gray matter in control subjects (Table 4). Thus, the simplest explanation for the gray matter deficit in patients at age 9.5 years (Table 3) is that central gray matter does not reach a maximal volume as early in patients as it does in control subjects.
An alternative possibility is that central gray matter atrophy occurred at a very young age in our patients (< 5 years). In support of this possibility, we note that CSF volume was larger in patients than in control subjects at age 5 years (Table 3). Furthermore, control subjects showed a significant loss of central gray matter (Table 4), but still had more central gray matter than patients at age 5 and 9.5 years (Table 3). It will be critical in future work to characterize the pattern of volumetric brain growth in very young patients (< 5 years old), to determine whether atrophy or growth delay is a better explanation for the volume deficit in central gray matter noted at age 5 years (Table 3).
Conclusion
We describe volumetric deficits specific to gray matter, in patients with SCD, whereas there is no evidence of a volumetric deficit in white matter. These findings appear to be consistent with measurements that show reduction of brain tissue T1 specifically in gray matter, with no T1 abnormality in the white matter of patients with SCD (15, 16, 25, 46). Our results thus suggest that gray matter is selectively vulnerable to injury in children with SCD, perhaps because of the severe anemia that can be present in these patients (16, 17). Our results show that children with SCD can experience neurodevelopmental consequences of their disease.
In Memoriam
This article is dedicated to the memory of our good friend and valued colleague, Dr. Temitope Emudianughe-Okponobi, who died recently from complications of cancer. She was a wonderful person, a fine physician, and a clear-thinking scientist. She fought against great odds, and she will be deeply missed.
Acknowledgments
We thank Mary Freeman, Crystal Manchester, Carolyn Phillips, and Mark Summers, who performed all of the MR imaging, and the patients and families of St. Jude who dedicated their time and effort.
Footnotes
Supported by the National Heart, Lung, and Blood Institute (grant RO1 HL60022 to R.G.S.) and by the American Lebanese Syrian Associated Charities.
References
- Received March 12, 2004.
- Accepted after revision July 6, 2004.
- Copyright © American Society of Neuroradiology
In this issue


Jump to section
Related Articles
Cited By...
- Differences in Activation and Deactivation in Children with Sickle Cell Disease Compared with Demographically Matched Controls
- A Prospective Longitudinal Brain Morphometry Study of Children with Sickle Cell Disease
- White Matter Damage in Asymptomatic Patients with Sickle Cell Anemia: Screening with Diffusion Tensor Imaging