
Abstract
BACKGROUND AND PURPOSE: MR imaging is increasingly used to assess maturation and disease in the preterm brain. Knowledge of the changes in T2 values with increasing postmenstrual age (PMA) will aid image interpretation and help in the objective assessment of maturation and disease of the brain in infants. The aim of this study was to obtain T2 values in the preterm brain from 25 weeks’ gestational age (GA) until term-equivalent age in infants who had normal neurodevelopmental findings at a minimum corrected age of 1 year.
METHODS: The study group consisted of 18 preterm infants, born at 33 weeks’ GA or sooner. The median GA of the infants at birth was 27 weeks (range, 23–33 weeks), and the median PMA at imaging was 31 weeks (range, 25–41 weeks). T2 measurements were obtained using a 1.0-T MR system and a four-echo pulse sequence (TR/TE, 2500/ 30, 60, 110, and 600). T2 values were measured in the thalami, lentiform nuclei, frontal white matter, occipital white matter, and central white matter at the level of the centrum semiovale.
RESULTS: A significant negative linear correlation between T2 values and PMA was demonstrated in the lentiform nuclei (P = .003), frontal white matter (P < .0001), occipital white matter (P < .0001), and central white matter at the level of the centrum semiovale (P < .0001). T2 values were not significantly reduced with increasing PMA in the thalami (P = .06).
CONCLUSION: T2 values decrease with increasing PMA in the preterm brain.
MR imaging has proved to be a useful tool for investigating the developing preterm brain (1–5), and an increasing number of centers are using MR imaging to assess cerebral disease in preterm infants. In addition to the qualitative assessment of MR images, quantitative MR techniques are available, including the measurement of T2 values. T2 values are related to the tissue water content and higher in free water than in water bound to macromolecules, such as myelin lipids and proteins. While cerebral T2 values have been investigated in neonates born at term (6) and in preterm infants at term (7), little is known about T2 values in the developing preterm brain. Knowledge of the changes in T2 values with increasing postmenstrual age (PMA) in the preterm period will aid the evaluation of MR images in this group of patients, and T2 measurements may provide a quantitative method of assessing maturation and disease in the preterm brain.
The aim of this study was to obtain T2 values in the preterm brain from 25 weeks’ gestational age (GA) until term-equivalent age to establish the relationship between PMA and T2 values in preterm infants with no evidence of disease in the cerebral white matter on MR images and with normal neurologic findings at a minimum corrected age of 1 year.
Methods
Approval of this study was granted by the local research ethics committee, and written informed parental consent was obtained for each infant.
Pulse Sequence Verification
Verification tests were performed on a gel phantom. The phantom was imaged by using nine separate conventional spin-echo (CSE) pulse sequences with a TR/TE of 2500/10, 20, 50, 100, 200, 300, 400, 500, and 600. Measurements were taken from a 865-mm2 circular region of interest (ROI) positioned in the center of the phantom images. T2 values were calculated by fitting the data with the following equation: y = M0 × exp(−x/T2), where y is the signal intensity, M0 is the proton density, and x is the TE.
Additionally, the phantom was imaged by using a purposely designed four-echo CSE pulse sequence (2500/30, 60, 110, and 600), and T2 was calculated by using the same method. In both cases, four transverse sections were obtained with a field of view of 20 cm, a section thickness of 4 mm, and a section gap of 4 mm to reduce interference between sections. The T2 values obtained by using these two sequences were compared.
Subjects
The study group consisted of 18 preterm infants, nine male and nine female, born at 33 weeks’ GA or sooner. None of the infants had evidence of a genetic, metabolic, or viral infective disorder. No infant had neurologic complications in the neonatal period. The median GA of the infants was 27 weeks (range, 25–33 weeks) at birth, and the median birth weight of the infants was 986 g (range, 696–2040 g). The median PMA of the infants at imaging was 31 weeks (range, 25–41 weeks), and the median postpartum age at imaging was 1 week (range, 0–15 weeks). Four infants were imaged twice between birth and term-equivalent age. GA was calculated from the date of the mother’s last menstrual period and confirmed with early antenatal sonograms.
Outcome Assessments
Two experienced neurodevelopmental pediatricians who were unaware of the imaging findings (F.M.C., B.E.) assessed all of the children. All had a developmental quotient of ≥85 (median, 98.5; range, 85–114), which was obtained by using the revised Griffiths scales (8) at a corrected age of between 1 and 2 years. They all achieved an optimality score of ≥64 (median, 74; range, 65–78) on a standardized infant neurologic examination (9); this score was compatible with independent walking by 2 years of age (10). None had cerebral palsy. All showed head growth within 1 SD of their birth measurements.
MR Imaging
MR imaging was performed using a 1.0-T MR system (Philips Medical Systems, Best, the Netherlands) situated in the neonatal intensive care unit, which allowed very preterm infants to be imaged without compromising their intensive care (11). This system had a short bore that allowed access to the infants at all times during imaging with a relatively small area of homogeneous field (central volume of 120-mm diameter and 50-mm thickness at ± 2.9 ppm) (12). The patients’ pulse oximetry readings, electrocardiographic findings, and temperature were monitored, and an experienced neonatologist (N.L.K., M.C.H.) remained in the imaging room throughout the procedure. In the early neonatal period, seven infants were ventilated or received continuous positive airways pressure at the time of their MR examination. When possible, infants were imaged during postprandial sleep; however, oral chloral hydrate (20–30 mg/kg) was usually required to successfully image the infants at term-equivalent age.
Transverse T1-weighted CSE (600/20) and T2-weighted fast spin-echo (TR/TEeff, 3500/208) images were obtained in each case. To obtain MR images of the whole head within the constraints of the homogeneous field, infants were initially positioned so that the level of the basal ganglia was at the isocenter, and images were obtained at this level. The bed of the imager was then moved out of the bore of the magnet so that the central white matter region was at the isocenter, and images were acquired at this level. Finally, the bed was moved toward the bore so that the cerebellum was at the isocenter (infants ≤30 weeks’ GA were imaged in two sections).
T2 measurements were obtained by using the purposely designed four-echo CSE pulse sequence described before (2500/30, 60, 110, and 600). As in the pulse sequence verification tests, four transverse sections were obtained with a field of view of 20 cm, a section thickness of 4 mm, and a section gap of 4 mm. To ensure that the central white matter and basal ganglia regions were within the area of the homogeneous field, the infants were positioned so that the midventricular region was at the isocenter for the T2 measurement sequence. The acquisition time for this sequence was 5 minutes 35 seconds.
Region of Interest Analysis
ROIs were placed in the thalami, lentiform nuclei, frontal white matter, occipital white matter, and central white matter at the level of the centrum semiovale, bilaterally (Figs 1–3). ROI measurements were not obtained from the cortical gray matter, as it was not possible to avoid partial volume averaging from adjacent CSF or subcortical white matter. Because of section positioning error, T2 measurements were not obtained at the level of the centrum semiovale in two subjects. The ROIs (area, 10.09–23.97 mm2) were initially positioned on the images obtained with a TE of 30 ms, as this provided the best image contrast, and then copied onto the other three images. Consistency of positioning was ensured by having a single investigator (S.J.C) place all ROIs. This investigator was unaware of the infant’s PMA. ROIs were positioned to prevent partial volume averaging from cortical gray matter or CSF. T2 values were calculated by using the fitting equation described earlier.

MR images in an infant at 30 weeks’ PMA demonstrate positioning of the ROIs in the thalami (T), lentiform nuclei (L), and occipital white matter (W) on the left side.
A, TE of 30 ms.
B, TE of 60 ms.
C, TE of 110 ms.
D, TE of 600 ms.

MR images in an infant at 27 weeks’ PMA with minimal ventricular dilatation demonstrate positioning of the ROI in the frontal white matter on the left side.
A, TE of 30 ms.
B, TE of 60 ms.
C, TE of 110 ms.
D, TE of 600 ms.

Images in an infant at 27 weeks’ PMA demonstrate positioning of the ROI in the central white matter of the centrum semiovale on the left side.
A, TE of 30 ms.
B, TE of 60 ms.
C, TE of 110 ms.
D, TE of 600 ms.
The analysis was repeated, including the placement of the ROIs, and test-retest consistency was evaluated by means of the coefficient of reliability (13). Statistical analysis of the data were performed by using STATA version 7 (STATA Corporation, College Station, TX). Unpaired t tests showed no significant difference between the right and left hemispheres (P > .05). Therefore, a mean figure was calculated from the bilateral measurements to provide T2 values for each region. Linear regression analysis was performed to test the relationship between PMA and T2. Because four infants were imaged twice, robust variance estimates were used to account for the repeated measures. (Robust specifies that the Huber/white/sandwich estimator of variance is used in place of the conventional estimator of variance and adjusts the significance values obtained to take multiple measurements in individual infants into account [14]). Additionally, the data were divided into three groups on the basis of patient age: ≤30 weeks’ PMA, 31–36 weeks’ PMA, and term-equivalent age 37–41 weeks’ PMA. Regional variation within each age group was assessed by using a one-way analysis of variance with a Bonferroni test for multiple comparisons.
Results
Phantom Tests
The T2 value of the gel phantom obtained by using nine separate CSE sequences was 315 ms ± 11, and the T2 value obtained by using the four-echo CSE sequence was 311 ms ± 18. The measured variability of the four-echo CSE sequence was <3%.
MR Images
No complications occurred during or immediately after the MR imaging studies. Fifteen infants had normal MR images; one infant had a unilateral germinal-layer hemorrhage; one had unilateral germinal layer-intraventricular hemorrhage; and one infant had minimal, bilateral ventricular dilatation. No infants had parenchymal white matter lesions.
T2 Values
The mean T2 values at ≤30 weeks’ PMA, 31–36 weeks’ PMA, and at term-equivalent age are shown in Table 1.
Mean T2 values
Relationship between T2 Values and PMA
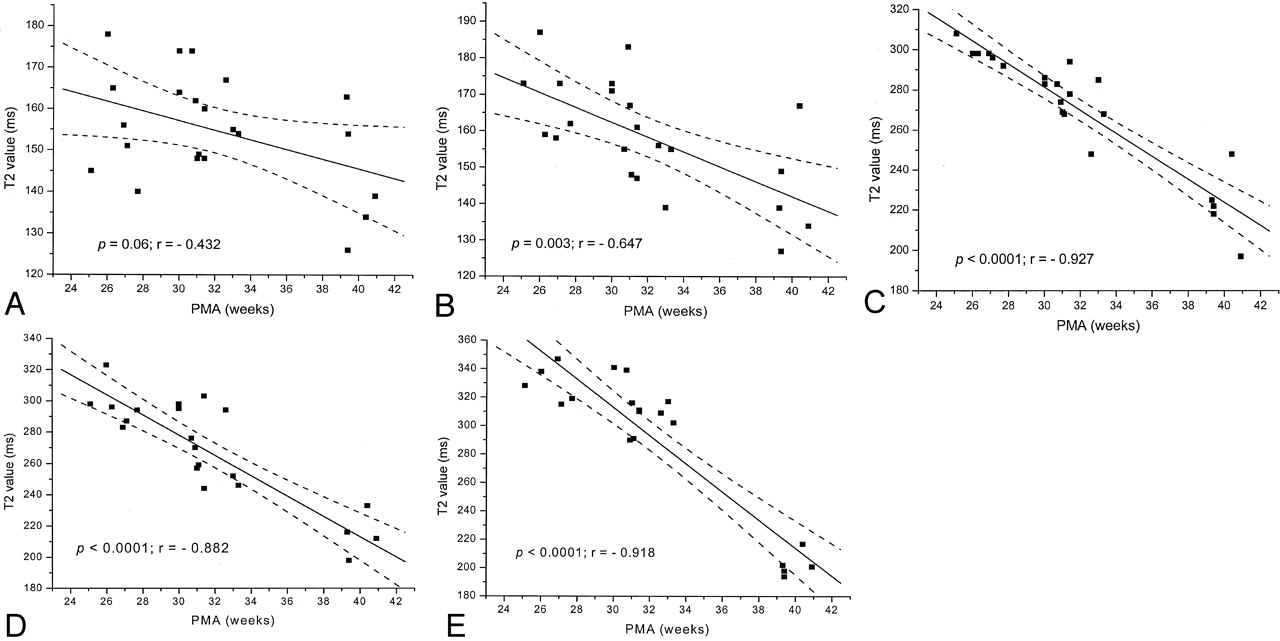
A significant negative linear correlation between T2 values and PMA was demonstrated in the lentiform nuclei (P = .003; r = −0.65), the frontal white matter (P < .0001; r = −0.93), the occipital white matter (P < .0001; r = −0.88), and the central white matter at the level of the centrum semiovale (P < .0001; r = −0.92). The reduction in T2 values with increasing PMA in the thalami was not significant (P = .06; r = −0.43). Figure 4 shows the relationship between T2 and PMA for each region examined. Table 2 demonstrates the results of linear regression for each region.

Graphs demonstrating the relationship between PMA and T2 values.
A, Thalami.
B, Lentiform nuclei.
C, Frontal white matter.
D, Occipital white matter.
E, Central white matter at the level of the centrum semiovale.
Results of linear regression
Regional Variation
There was no significant difference in T2 values between the thalamus and lentiform nuclei for any of the three age groups (P >.999). However, T2 values in both the thalami and the lentiform nuclei were significantly lower than those in all white matter regions for all three age groups (P < .001 for all regions). Within the white matter regions, there was no significant difference between T2 values in the frontal and those in the occipital white matter (P .999 for all age groups). Before term-equivalent age, T2 values in the central white matter of the centrum semiovale were significantly higher than those in both the frontal white matter (P < .001 for ≤30 weeks’ and 31–36 weeks’ PMA) and the occipital white matter (P < .001 for ≤30 weeks’ and 31–36 weeks’ PMA). At term-equivalent age, however, there was no significant difference in T2 values between the central white matter of the centrum semiovale and those of either the frontal white matter (P = .49) or the occipital white matter (P .999).
Test-retest variability was low for each region. Values were as follows: thalami, 2.8%; lentiform nuclei, 3.4%; frontal white matter, 3.2%; occipital white matter, 3.9%; and the central white matter at the level of the centrum semiovale, 2.7%.
Discussion
The results of this study demonstrated that T2 values in the developing cerebral white matter and central gray matter structures decrease with increasing PMA in preterm infants. T2 relaxation times are time constants governing the decay of transverse magnetization after the application of a radio-frequency pulse, due to spin-spin interactions and local magnetic field inhomogeneities. Additionally, the diffusion of water molecules reduces T2 relaxation times. T2 values are related to the water content and whether the water is free or bound to macromolecules. The values are longer in free water, in which interactions between protons are weaker, than in bound water.
The four-echo CSE pulse sequence used in this study did not have built-in crusher gradients. Although this lack is potentially a source of error, the results obtained by using the gel phantom showed that this sequence was accurate when compared with several single-echo sequences. Additionally, insufficient TEs were acquired to examine multiexponential components of the T2 decay curves. The main advantage of this four-echo sequence was that T2 values of the preterm brain could be determined in a clinically acceptable time, which is extremely important in imaging this vulnerable patient group. The pulse sequence used in this study allowed only four sections; therefore, we positioned the sections to cover most of the cerebral white matter, as preterm birth is frequently associated with white matter disease (15, 16).
The T2 values obtained in the preterm brain in this study were higher than those reported in adults (17–22), and T2 values in the unmyelinated white matter were higher than those in central gray matter structures, which is the reverse of the values in the adult brain. Maturational decreases in T2 have been observed in other studies (6, 7, 23–27). The findings cannot be directly compared because different field strengths were used. However, the results of this study were similar to those of preterm infants at 37 weeks’ PMA who underwent imaging at 2.35 T (thalamus, 151 ms ± 11; frontal white matter, 266 ms ± 35; occipital white matter, 213 ms ± 28) (7) and to those in term-born neonates in the early neonatal period who underwent imaging at 2.4 T (thalamus, 135.5 ms ± 12.9; frontal white matter, 228.1 ms ± 32.3) (6). Additionally, in their MR spectroscopic study, Cady et al (28) reported T2 values of 165 ms ± 18 in the thalamus and 223 ms ± 32 in the parieto-occipital white matter in infants imaged at 32–42 weeks’ PMA at 2.4 T.
In this study, the reduction in T2 values in the cerebral white matter over time in the very preterm brain is unlikely to be due to myelination, because myelination is not evident in the white matter of the cerebral hemispheres before 34 weeks’ GA, as assessed at histologic examination (29). In addition, this finding is not demonstrated on MR images obtained before 36 weeks’ PMA (30). Glycolipid, cholesterol, and protein in the brain increases as the neonatal brain matures, and the water decreases (31). The reduction in T2 with increasing PMA in the very preterm brain most likely reflects a reduction in the free water content. Additionally, premyelination changes, including the development of myelin precursors, may also contribute to the decrease in T2 values (32). Perinatal factors such as the time from delivery, the method of delivery, and the intravenous administration of fluid may exert an acute effect on the water content of the brain and, therefore, on the T2 value. However, too few patients were assessed in this study to allow us to address this issue.
Although Thornton et al (6) observed a significant negative linear correlation between T2 and PMA in the thalamus in term infants, the decrease in T2 with increasing PMA in this study just failed to reach significance. In addition, the rate of decrease in T2 values with increasing age in the lentiform nuclei was less than that of the cerebral white matter. This observation probably reflects the earlier commencement of myelination in central gray matter structures and that myelination is still underway at the PMAs studied here. Indeed, microscopy shows myelination in the globus pallidus, the pallidothalamic fibers of the posterior limb of the internal capsule, and the ventrolateral nuclei of the thalamus at 25 weeks’ GA (33). Other fibers and nuclei become myelinated later. For example, ascending thalamocortical fibers do not demonstrate histologic evidence of myelination before 32 weeks’ GA (33), and the cycle of myelination of the fibers of the outer segment of the globus pallidum continues beyond 1 year post term (34). In this study, we did not attempt to differentiate separate nuclei and fiber bundles of the thalamus and lentiform nuclei, as these structures are too small in the preterm brain for us to confidently avoid positioning error and partial volume averaging. In addition to myelination, the maturation of astrocytes and neurons within the thalami may also contribute to a reduction in T2 values. As neurons enlarge, the extracellular space—and therefore the free water content—decreases. Increasing neuronal complexity results in more bound molecules, which may also contribute to a reduction in T2 values.
Before term-equivalent age, T2 values in the white matter of the centrum semiovale were higher than those in the frontal or occipital white matter. However, at term-equivalent age, we did not find a regional variation in T2 values in the white matter. A regional variation in T2 values in the white matter at this age has been reported previously and attributed to regional variations in myelination and premyelination events (7). In most term neonates, myelin is evident in the corticospinal tracts at the level of the centrum semiovale on MR images; myelin is rarely evident in the optic radiations, and it is not evident in the frontal white matter (35). Furthermore, myelination is evident in the corona radiata and corticospinal tracts at the level of the centrum semiovale in preterm infants at term-equivalent age, but it is not demonstrated in the optic radiations or frontal white matter (30). Therefore, one would expect T2 values to be lower in the central white matter of the centrum semiovale than in the frontal or occipital white matter. While the mean T2 values in the central white matter of the centrum semiovale at term-equivalent age were slightly lower than those in the other white matter regions, these values were not significantly different. This finding may have been due to the small number of infants studied at this age (n = 5).
In this study, we included only apparently healthy but extremely preterm infants who had brain MR images without any focal changes of known pathologic importance. We also included only infants whose outcome was considered normal in terms of their developmental quotient, neurologic status, and head growth between 1 and 2 years. Therefore, we consider these infants optimal within the limits of our ability to assess them at this young age. We accept the fact that the concept of normality in this extremely preterm population is relative and that they may have some neurodevelopmental problems that become apparent only at an older age (36, 37). Within these caveats, our T2 data may be representative of normal findings. Knowledge of the changes in T2 values with development in such preterm infants is essential to the assessment of MR images in this group of infants.
Conclusion
T2 values in the cerebral white matter and central gray matter structures decrease from 25 weeks’ GA to term. This rate of decrease is greatest in the central white matter at the level of the centrum semiovale and least in the thalamus. In the cerebral white matter, these reductions in T2 commence before myelinogenesis and probably reflect a reduction in the cerebral water content.
Footnotes
Funding from the Medical Research Council, Philips Medical Systems, and the Garfield Weston Foundation.
This work was presented at the Annual Meeting of the International Society of Magnetic Resonance in Medicine, Glasgow, Scotland, 2001.
References
- Received December 17, 2002.
- Accepted after revision April 28, 2003.
- Copyright © American Society of Neuroradiology
In this issue


Jump to section
Related Articles
Cited By...
- Cerebral Oxygenation Measurements by Magnetic Resonance Imaging in Fetuses With and Without Heart Defects
- Comparison of Spin-Echo and Gradient-Echo T1-Weighted and Spin-Echo T2-Weighted Images at 3T in Evaluating Term-Neonatal Myelination
- Acquisition Guidelines and Quality Assessment Tools for Analyzing Neonatal Diffusion Tensor MRI Data
- Improving head growth in preterm infants - a randomised controlled trial II: MRI and developmental outcomes in the first year