
Abstract
Summary: We herein report the case of a 53-year-old woman with Behcet’s disease and an acute T2-hyperintense lesion in left side of the pons. Echo-planar “trace” diffusion MR imaging revealed high signal intensity changes at the lesion site on b = 1000 s/mm2 images, initially suggesting restricted diffusion. On corresponding apparent diffusion coefficient maps, however, the lesion had high signal intensity and high apparent diffusion coefficient values (1.22 × 10⁻³ mm2/s), compared with the contralateral normal side of the pons (0.86 × 10⁻³ mm2/s) and compared with the normal temporal white matter (0.80 × 10⁻³ mm2/s). This was consistent with the presence of increased diffusion, hence vasogenic edema. Proton MR spectroscopy excluded acute infarction. This particular pattern (high signal intensity on b = 1000 s/mm2 images in association with high apparent diffusion coefficient values) likely represented the acute inflammatory process associated with disrupted brain-blood barrier in the fulminant form of neuro-Behcet’s disease. Follow-up examinations ≤2 years later revealed a remaining gliotic lesion.
Behcet’s disease involves the CNS in approximately 5% to 10% of cases. The brain stem is the most common location of involvement (1, 2). Two recently published articles (3, 4) dealt with diffusion MR imaging findings of the disease, but no proton MR spectroscopy report is available. We herein present the report of a patient who was studied and followed up with these techniques.
Case Report
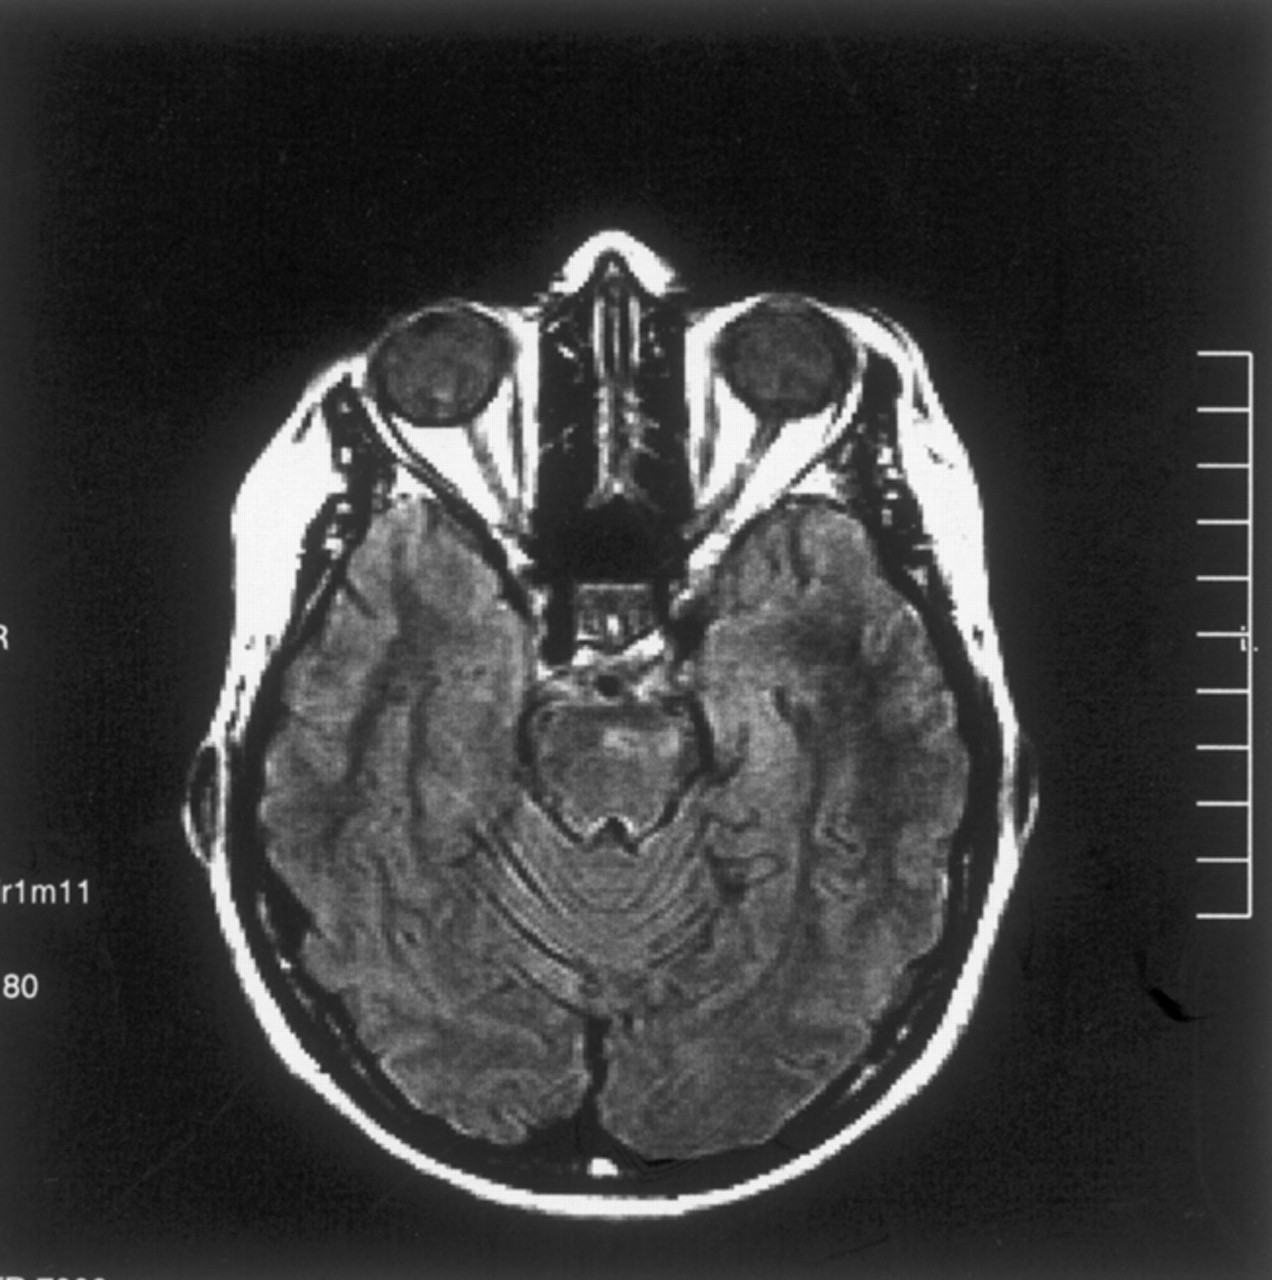
The patient was a 53-year-old woman with known Behcet’s disease diagnosed 12 years before her presentation to the hospital with acute right-sided hemiparesis. An MR imaging study was performed with a 1.5-T MR imaging unit. T2-weighted and fluid-attenuated inversion recovery images revealed a left-sided hyperintense lesion in the pons (Fig 1A). On T1-weighted images, there was a focal high signal intensity change within the lesion, suggesting hemorrhage or presence of myelin breakdown products (Fig 1B). T1-weighted images obtained after the IV administration of paramagnetic contrast medium revealed enhancement in the corresponding region (Fig 1C). Diffusion MR imaging was obtained with the echo-planar “trace” protocol (5700/139 [TR/TE]). On b = 1000 s/mm2 images, high signal intensity changes were evident at the lesion site in the left side of the pons, initially suggesting restricted diffusion (Fig 1D). On corresponding apparent diffusion coefficient (ADC) maps, however, this had high signal intensity and high ADC values (1.22 × 10⁻³ mm2/s), compared with the contralateral normal side of the pons (0.86 × 10⁻³ mm2/s) and compared with the temporal white matter (0.80 × 10⁻³ mm2/s). This was consistent with the presence of increased diffusion, hence vasogenic edema (Fig 1E). Proton MR spectroscopy (1500/40) of the lesion site revealed no lactic acid peak, presumably excluding acute infarct (Fig 1F). The major peaks—N-acetylaspartate, choline, and creatine—were normal. The clinical condition of the patient improved dramatically with IV administration of steroid treatment.

Images obtained during the acute stage.
A, Fluid-attenuated inversion recovery image reveals a left-sided hyperintense lesion in the pons.
B, T1-weighted image reveals a focal high signal intensity change, suggesting hemorrhage or presence of myelin breakdown products.
C, Contrast-enhanced T1-weighted image shows enhancement in the corresponding region.
D, Diffusion-weighted (b = 1000 s/mm2) image reveals high signal intensity in the lesion, suggesting restricted diffusion (see E).
E, ADC map (same section as that shown in D) reveals high signal intensity and a high ADC value (1.22 × 10⁻³ mm2/s), compared with the normal side of the pons (0.86 × 10⁻³ mm2/s) and compared with the temporal white matter (0.80 × 10⁻³ mm2/s). This is consistent with presence of increased diffusion, hence vasogenic edema.
F, Proton MR spectroscopy (1500/40) reveals that there is no lactic acid peak, excluding acute infarct. Major peaks are normal.
The patient was reexamined at this institution 16 months later. T2-weighted images revealed a markedly smaller focus of hyperintensity at the original lesion site in the left part of the pons (Fig 2A). For diffusion MR imaging, the three-gradient protocol (4000/110) was used. The b = 1000 s/mm2 image appeared normal (Fig 2B), whereas the ADC map revealed high signal intensity and a high ADC value (1.20 × 10⁻³ mm2/s), suggesting presence of gliosis at this stage of the disease (Fig 2C). Another study of the patient was available 9 months later (2 years after initial examination). The fluid-attenuated inversion recovery images from that study revealed similar sequelae changes, further suggesting presence of gliosis (Fig 3).

Images obtained at the 16-month follow-up examination.
A, T2-weighted image reveals a small remaining focus of gliosis.
B, Diffusion-weighted (b = 1000 s/mm2) image is normal appearing.
C, ADC map (same section as that shown in B) reveals high signal intensity and a high ADC value (1.20 × 10⁻³ mm2/s), consistent with tissue disintegration due to gliosis.

Fluid-attenuated inversion recovery image obtained at the 2-year follow-up examination reveals focal high signal intensity secondary to presumed gliosis.
Discussion
Behcet’s disease is a multisystemic inflammatory disorder with relapsing courses. Two main patterns of CNS involvement occur: parenchymal and nonparenchymal. The neuropathology of the parenchymal form is that of multifocal necrotizing lesions with marked inflammatory cell reactions, secondary to vasculitis, mainly with venular involvement. Brain stem is the most common location of involvement in this form. On the other hand, the nonparenchymal form is associated with lesions secondary to dural sinus thrombosis. In the CNS during the acute phase of neurologic manifestations of Behcet’s disease, MR imaging shows hyperintense lesions on T2-weighted sequences. The lesions usually reveal contrast enhancement. This MR imaging profile may be indistinguishable from that of granulomatous inflammations, acute disseminated encephalomyelitis, and some infections. Brain stem is the most common location of involvement, and basal ganglia, cerebral hemispheres, and spinal cord are the next most common (1, 2). The MR imaging findings for the current patient were consistent with those presented in previous reports (Fig 1A–C).
Two previous reports (3, 4) dealt with diffusion MR imaging in Behcet’s disease. Ohta et al (3) reported the cases of two patients for whom T2-weighted sequences revealed hyperintense brain stem changes whereas diffusion MR imaging (images corresponding to b = 1000 s/mm2) revealed isointensity. They concluded that this profile excluded cerebral infarction, because no high signal intensity was seen on diffusion MR images (3). In another article, Kang et al (4) reported a patient with brain stem, basal ganglion, thalamus, and corona radiata involvement in whom b = 1000 s/mm2 images and ADC maps were studied. They cited that b = 1000 s/mm2 images revealed slight hyperintensities whereas ADC values were high, ranging between 1.17 and 1.26 × 10⁻³ mm2/s, compared with normal ADC values of 0.77 to 0.80 × 10⁻³ mm2/s from the contralateral hemispheres (4). They commented that the ADC values in the lesions were consistent with high diffusion rates, indicating vasogenic edema. It is cited that vasogenic edema develops when the blood-brain barrier is disrupted and is not primarily associated with cellular damage (4). A pathologic report of the fulminant form of Behcet’s disease found an acute destructive inflammatory process without evidence of vasculitis (5). The occurrence of acute lesions in the disease has been attributed to reversible breakdown in the blood-brain barrier associated with vasogenic edema (4–6). The diffusion MR imaging findings for our patient during the acute stage, consisting of high signal intensity brain stem changes on b = 1000 s/mm2 images (Fig 1D) and high signal intensity and high ADC values (1.22 × 10⁻³ mm2/s) compared with the contralateral normal side of the pons (0.86 × 10⁻³ mm2/s) and compared with the temporal white matter (0.80 × 10⁻³ mm2/s) (Fig 1E), were similar to the findings presented by Kang et al (4). We also consider this pattern to be a reflection of vasogenic edema associated with disrupted blood-brain barrier. Regarding discrimination of vasogenic from cytotoxic edema by diffusion MR imaging, it is known that cytotoxic edema usually reveals high signal intensity on b = 1000 s/mm2 images (with low signal intensity and low ADC values) whereas in cases of vasogenic edema, b = 1000 s/mm2 images are usually normal appearing in association with high signal intensity and high ADC values (3, 4). For the current patient with fulminant Behcet’s disease, however, b = 1000 s/mm2 images exhibited high signal intensity and, at the same time, ADC values were high. Kang et al (4) experienced similar findings. Therefore, we suggest that this particular diffusion MR imaging pattern may be a reflection of the acute inflammatory process in Behcet’s disease. In addition to diffusion MR imaging, we performed proton MR spectroscopy at the lesion site, which revealed no lactic acid peak; the major peaks were normal (Fig 1F). This presumably excluded the possibility of acute infarct, further supporting the suggestions regarding diffusion MR imaging and vasogenic edema. No previous proton MR spectroscopy report has specifically dealt with brain stem infarctions. However, those involving acute infarction in general cite that after an infarct, lactate appears and NAA and total creatine are reduced compared with the unaffected brain tissue (7).
Histopathology during the chronic stage of Behcet’s disease mainly consists of longstanding inflammatory changes and gliosis. For the patient whose case is reported herein, the main MR imaging finding at the 16-month follow-up examination was that of remaining gliosis on T2-weighted images (Fig 2A), which was unchanged 9 months later, as shown by the third examination (Fig 3). Diffusion MR imaging at the 16-month follow-up examination consisted of a normal b = 1000 s/mm2 image with a high ADC value (1.20 × 10⁻³ mm2/s) for the remaining lesion. This high ADC value was likely representative of disintegrated tissue due to gliosis (Fig 2C).
References
- Received January 27, 2003.
- Accepted after revision March 28, 2003.
- Copyright © American Society of Neuroradiology


