
Abstract
BACKGROUND AND PURPOSE: Recent neuropathologic research suggests thalamic involvement in sporadic Creutzfeldt-Jakob disease (sCJD), which has been disregarded in imaging studies. Diffusion-weighted (DW) MR imaging has the highest sensitivity for the detection of signal intensity (SI) abnormalities in CJD. We hypothesized that pathologic changes in the thalamus in sCJD can be detected by using a subtle analysis of DW MR imaging.
METHODS: Six sCJD patients and nine healthy controls were examined with a 1.5-T system by using DW single-shot spin-echo echo planar (b = 0, 1000 s/mm2), T2-weighted turbo spin-echo, and fluid-attenuated inversion recovery sequences. One patient was examined serially (3, 4, and 8 months after onset of symptoms). MR images were reviewed for SI changes in the striatum, hippocampus, mediodorsal thalamic nucleus (MD), and pulvinar thalami. Apparent diffusion coefficients (ADCs) were measured in these areas.
RESULTS: All sCJD patients showed increased SI on DW images in the striatum bilaterally. ADCs in these areas were significantly reduced. Four of six sCJD patients showed increased SI on DW images in the pulvinar thalami, whereas ADCs were significantly reduced in all patients (mean ADC ± SEM: in patients with SI changes, 701 ± 38; in patients without SI changes, 684 ± 37; in controls, 853 ± 15 [P < .0001]). No patient showed SI changes in the MD on DW images, whereas ADCs were significantly reduced in all (664 ± 28 as compared with 800 ± 24 in controls [P = .0011]). Serial measurements in one sCJD patient showed ADC reduction in the pulvinar thalami preceding the SI changes on DW images.
CONCLUSION: A quantitative analysis of DW images with ADC measurements shows slight MR imaging changes in the thalamus in sCJD when abnormal SI may not be present.
Creutzfeldt-Jakob disease (CJD) is a rare neurodegenerative disease with a fatal outcome. Most patients are reported to have sporadic CJD (sCJD). The diagnosis of sCJD is based on the combination of clinical signs and symptoms such as rapidly progressive dementia, gait disturbances, and myoclonus (1, 2); typical electroencephalographic changes, such as periodic sharp wave complexes (3, 4); and presence of the 14-3-3 protein in the CSF (3, 5). For definite diagnosis (World Health Organization 1998 [1]), brain examination by biopsy or autopsy is required. The typical neuropathologic features of CJD are spongiform neuropil changes, nerve cell loss, and astrocytic gliosis (6). Immunocytochemistry shows the deposition of the pathologic form of the prion protein, PrPSc, in the brain (6). T2-weighted and diffusion-weighted (DW) images typically show increased signal intensity (SI) in the putamen and caudate nucleus (striatum) in 67–100% of patients with sCJD (3, 7–12).
Since 1996, an increasing number of patients with a new variant of CJD (vCJD), which is probably linked with bovine spongiform encephalopathy, have been reported in the United Kingdom, France, and the Republic of Ireland (13). In contrast to the bilateral changes in the striatum reported for sCJD (9), the key imaging finding in vCJD is high SI in the pulvinar thalami on T2-weighted turbo spin-echo (TSE) and fluid-attenuated inversion recovery (FLAIR) MR images, the so-called pulvinar sign, with a reported sensitivity of 68–90% and specificity of 100% (14, 15).
The presence of high SI in the thalamus on T2-weighted images in vCJD, but not in sCJD patients, contradicts neuropathologic studies that show thalamic involvement, especially of the mediodorsal thalamic nucleus (MD), as a consistent finding in sCJD (16). Similarly, experimental prion disease shows that spread of PrPSc to the cerebral cortex takes place after deposition in the thalamus (17); however, MR imaging SI changes in the thalami in sCJD have either been largely disregarded (12, 18, 19) or are reported in only a minority of cases (9). Recently, Haik and colleagues (20) reported two cases, one case of sCJD and one of vCJD, both of which showed high SI in the thalamus on DW and FLAIR images, which indicated accumulation of PrPSc.
We therefore hypothesized that pathologic changes within the thalamus in sCJD may well be detected on MR images but may require a more subtle analysis. To test this hypothesis, we assessed the SI behavior on DW, T2-weighted TSE, and FLAIR MR images obtained in a larger cohort of patients with sCJD (n = 6) and analyzed variations of the apparent diffusion coefficient (ADC) in the thalamic nuclei in a cross-sectional study of all patients and a longitudinal study in one patient.
Methods
Patients
From December 1998 to August 2001, six patients with sCJD (five probable cases of CJD and one definite case of sCJD) (1) were included in this study (for details, see Table 1). Nine patients without evidence of neurologic disease and with normal findings at brain MR imaging were used as controls. The mean age of sCJD patients was 62.4 years ± 5.4. In the control group, mean age was 63.2 years ± 11.5.
Clinical data of sporadic CJD patients
Imaging Study
MR images of CJD patients were obtained once 2–6 months after onset of symptoms. Images of one patient were taken serially (3, 4, and 8 months after onset of symptoms).
All images were acquired by using a 1.5-T system (Intera; Philips Medical Systems, Best, the Netherlands). For the single-shot DW spin-echo echo planar sequence, we used the following parameters: TR/TE, 5000/85; number of signals averaged (NSA), 1; field of view (FOV)/rectangular FOV (RFOV), 230 mm/172.5 mm (75%); and section thickness/intersection gap, 6 mm/1 mm. We acquired 20 sections with a matrix of 84 × 128 in 30 seconds, yielding a pixel size of 1.8 × 2.7 mm. Diffusion gradient strength was b = 0 and 1000 s/mm2. The DW images in the axial plane were obtained with diffusion gradients in three orthogonal directions (section selection, read-out, and phase-encoding directions).
ADC maps were then calculated on a pixel-by-pixel basis by using the formula ADC = −ln (S1/S0)/b1. S0 represents the SI in the DW images at b0 = 0 s/mm2. S1 is the SI in the DW images at b1 = 1000 s/mm2. We also acquired axial T2-weighted TSE images (TR/TE, 4500/100; NSA, 3; FOV/RFOV, 230 mm/184 mm (80%); section thickness/intersection gap, 5 mm/1 mm; sections, 22; matrix, 228 × 256) in seven of eight imaging session examined (patient 5 excluded) and T2-weighted FLAIR images in all cases (TR/TE/TI, 6000/100/2000; NSA, 1 or 2; FOV/RFOV, 230 mm/184 mm (80%); section thickness/intersection gap, 5 mm/1 mm; 22 sections, matrix 203 × 256. Imaging time, 1 minute 24 seconds–3 minutes 54 seconds) In patient 5, as no T2-weighted TSE images were available, the b0 images of the DW sequence were used for the analysis of SI changes in T2-weighted images. In patient 4, the FLAIR images were acquired merely in the coronal plane; in the other patients, FLAIR images were acquired in the axial plane.
Data Analysis
Analysis of DW, T2-Weighted TSE, and FLAIR Images
One experienced neuroradiologist (H.U.), aware of full clinical data, rated the DW images for SI changes. Among the thalamic nuclei, the MD and the pulvinar thalami were evaluated for presence or absence of SI changes. Additional areas with high SI on the DW images were recorded. The T2-images of the DW scan (b0 images) and the T2-weighted TSE and FLAIR images were analyzed in the same way.
Analysis of ADC
Using a postprocessing workstation (Easy Vision; Philips Medical Systems), regions of interest were manually placed in the pulvinar thalami and the MD and read out in the ADC maps (Fig 1A and C). Additional regions of interest were placed bilaterally at the head of the caudate nucleus and the putamen. These areas served as an internal positive control, because they are known to show predominantly pathologic changes in sCJD on DW images. Moreover, regions of interest were placed in the hippocampus (Fig 1B and D) as an internal negative control, because the hippocampus is usually only mildly affected in sCJD (16). In controls, the corresponding anatomic areas were measured.

Patient 5. DW MR images (b = 1000 s/mm2) (A and B) and corresponding ADC maps (C and D) show the level of the basal ganglia (A and C) and the hippocampus (B and D). The marked areas show the region-of-interest measurements in the head of the caudate nucleus, putamen, pulvinar thalami, and MD (A and C) and in the hippocampus (B and D).
In each anatomic area, three region-of-interest measurements were performed bilaterally. The mean ADC (± SEM) in each anatomic area was used for further analysis.
Statistical Analysis
For statistical evaluation, the unpaired two-tailed Student t test was used. P < .05 was considered to represent a statistically significant finding.
Results
Analysis of DW, T2-Weighted TSE, and FLAIR Images
On DW images, five of the six CJD patients (patients 1 [in the second examination], 2, 4, 5, 6 showed increased SI in the pulvinar thalami bilaterally. The FLAIR images showed in four of the six sCJD patients (patients 1 [second examination], 2, 5, 6) increased SI in the pulvinar thalami bilaterally. Patient 4 had SI changes in the pulvinar thalami on DW, but not on FLAIR, images. The FLAIR images of patient 4 were acquired only in the coronal section and showed motion artifacts so that the pulvinar thalami could not be evaluated. In none of the patients did we see SI changes on FLAIR images that were not present on the DW images, and none of the patients had SI changes on the DW, T2-weighted TSE, or FLAIR images in the MD. There were no SI changes on T2-weighted TSE images in the thalamus. All sCJD patients had bilaterally symmetric hyperintense changes on DW and FLAIR images of the head of the caudate nucleus and the putamen (Fig 2A and C). The T2-weighted TSE images showed increased SI in the striatum bilaterally in three patients (patients 1, 3, and 6; Fig 2B), unilaterally in two patients (patients 2 and 5), and no SI change in the striatum in one patient (patient 4 [Table 2]). No SI changes were observed in the hippocampus.

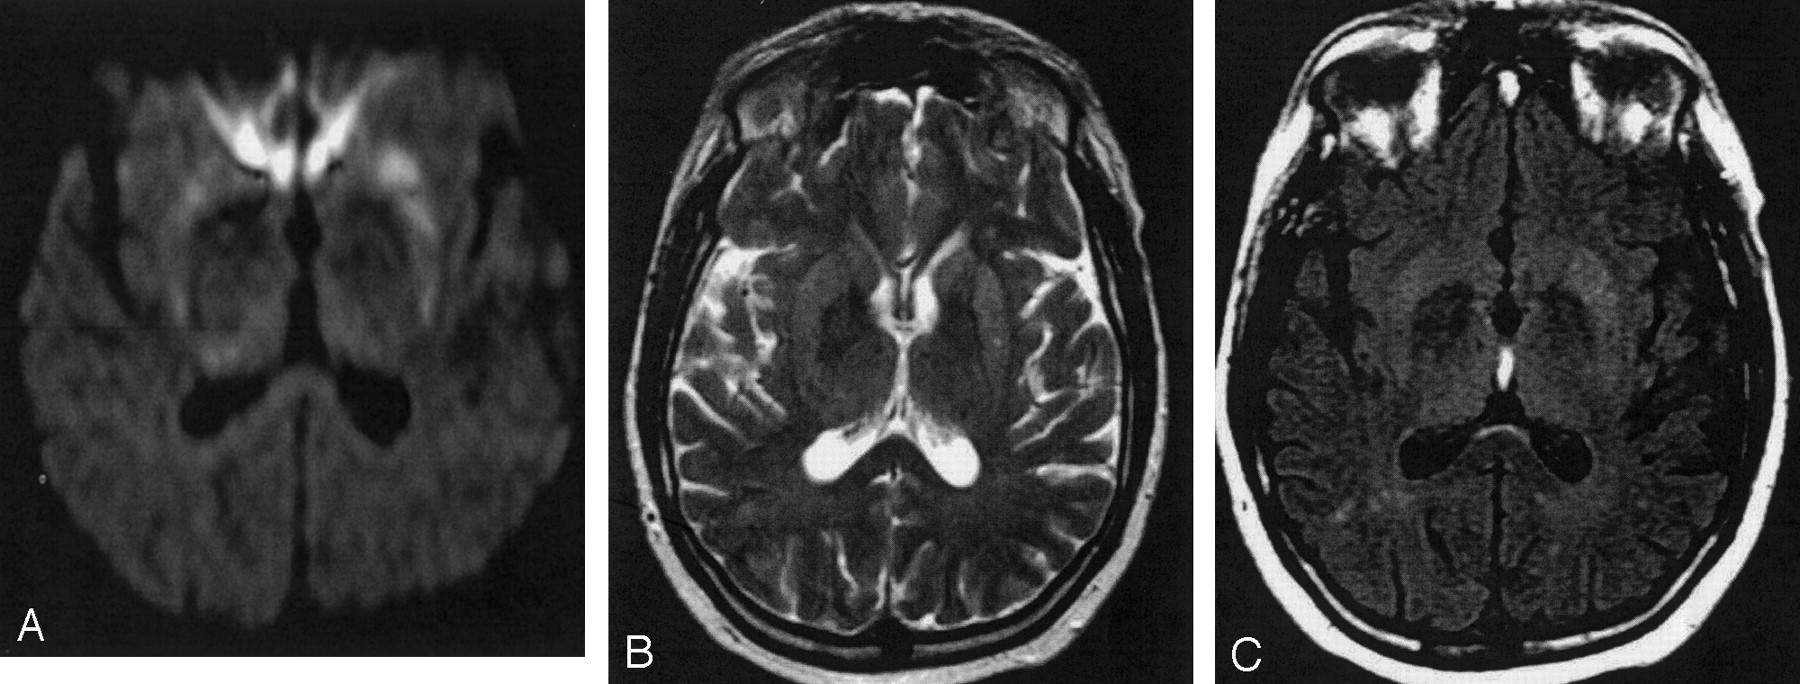
Patient 1, second examination. DW image (A), T2-weighted TSE (B), and FLAIR (C) images. Hyperintense SI changes in the striatum and the pulvinar thalami are discernable on the DW (A) and FLAIR (C) images bilaterally, whereas on the T2-weighted TSE image, increased SI is discernable only in the striatum bilaterally.
Analysis of DW-, T2-, and FLAIR-weighted images
Analysis of ADC
ADCs were significantly reduced in sCJD patients as compared with those in controls in the pulvinar thalami, the MD, and the striatum (Table 3, Fig 3). In the pulvinar thalami, the ADC values (10−6mm2/s) of those sCJD patients with increased SI on DW images did not differ significantly from those without SI changes: mean ADC ± SEM with SI changes, 701 ± 38, versus mean ADC ± SEM without SI changes, 684 ± 37 (P = .78). The ADC values in the thalamus in sCJD patients were significantly decreased compared with those in controls (853 ± 15; P < .0001), independent of the absence or presence of SI changes on DW images. Although no SI changes were observed on DW images in the MD, mean values were significantly decreased in sCJD patients (664 ± 28) as compared with those in controls (800 ± 24; P = .001). Significantly reduced ADC values were also observed in the head of the caudate nucleus (548 ± 27 in sCJD compared with 768 ± 35 in controls; P < .0001) and in the putamen (585 ± 28 in sCJD compared with 754 ± 22 in controls; P < .0001). There was no statistically significant difference in the ADCs in the hippocampus (853 ± 22 in sCJD compared with 871 ± 21 in controls; P = .56).

Mean ADCs (± SEM) of sCJD patients (right dark columns) and controls (left bright columns). ADCs in sCJD patients are significantly reduced in the caudate nucleus, putamen, MD, and pulvinar thalami as compared with controls. In the hippocampus (last pair of columns on the right), ADCs are comparable.
ADC values [× 10−6 s/mm2; b = 1000 s/mm2] in sCJD patients and controls
Serial Measurements
One sCJD patient was imaged serially (patient 1; Table 1). The pulvinar thalami showed decreased ADC values in the first examination (3 months after onset of symptoms); however, no SI changes on DW images were detectable. In the second examination (4 months after onset of symptoms), the pulvinar thalami showed increased SI on DW and FLAIR images and a further decrease in ADC. In the third examination (8 months after onset of symptoms), SI changes in the pulvinar thalami on DW and FLAIR images had disappeared and ADCs increased to normal values. No SI changes on T2-weighted TSE images were detected in the pulvinar thalami. In no cases were SI changes seen in the MD on DW, FLAIR, or T2-weighted TSE images. ADCs in the MD were reduced in the first DW images acquired, rose to near normal values on the second examination, and were higher than normal on the third examination.
The head of the caudate nucleus and the rostral part of the putamen (Fig 4A and D) showed bilateral hyperintense SI on the first DW, T2-weighted TSE, and FLAIR images, and ADCs were decreased. The second DW, T2-weighted TSE, and FLAIR images also showed hyperintense SI in the posterior parts of the putamen (Fig 4B and E). ADCs in the putamen and the right caudate nucleus were then higher than in the first examination, but were still clearly reduced compared with ADCs in controls. In the third examination, severe brain atrophy with widening of the lateral ventricles and atrophy of the basal ganglia, especially of the left caudate nucleus, was present (Fig 4C and F). The frontal and parietal cortex and the cingulate gyrus also showed hyperintense SI on DW images. These cortical SI changes were not detectable on T2-weighted TSE or FLAIR images. Increased SI on DW, T2-weighted TSE, and FLAIR images was present in the third examination in the right caudate nucleus and the putamen bilaterally. Because of severe brain atrophy, the left caudate nucleus was not identifiable on DW images, and no ADC measurements could be performed there. In the right putamen, ADC values were lower than in controls, whereas in the left putamen and the right caudate nucleus, ADC values were comparable with those in controls (Fig 5).

Patient 1. Serial DW images (A–C) and corresponding ADC maps (D–F) acquired 3 (A and D), 4 (B and E), and 8 (C and F) months after onset of symptoms. The DW image acquired 3 months after onset of symptoms (A) shows bilateral high SI in the caudate nucleus and the rostral part of the putamen. Four months after onset of symptoms, the DW image (B) shows high SI also in the dorsal part of the putamen and additionally in the pulvinar thalami. Eight months after onset of symptoms, the DW image (C) shows severe brain atrophy with widening of the ventricles and of the sulci. The head of the caudate nucleus on the left side totally disappeared; the right caudate nucleus and the putamen on both sides show severe atrophy. There is high SI in the right caudate nucleus and putamen bilaterally and in the frontal, parietal, and cingulate cortex. The ADC maps (D–F) show low SI in the hyperintense areas on DW images corresponding to restricted diffusion.

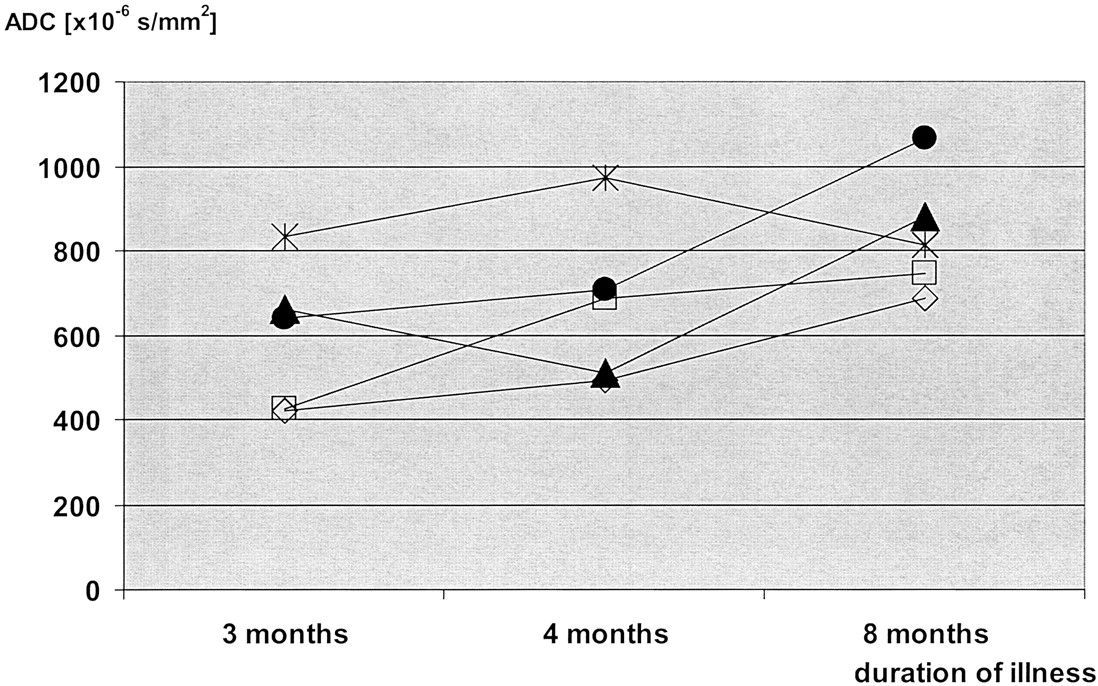
Patient 1. Time courses of the ADC values in serial images. Measurements were performed in five anatomic regions: the head of the caudate nucleus (empty rectangle), the putamen (open rhomboid), the pulvinar thalami (filled triangle), the MD (filled circle), and the hippocampus (star). In all areas except for the hippocampus, ADCs were lowest in the first examination and highest in the last examination. In the caudate nucleus, the putamen, and the MD, there was a gradual increase in the ADCs during the course of the disease. In the pulvinar thalami, ADCs were lowest in the second examination; this was paralleled by an increased SI on DW images in the second examination (shown in Fig 4B, E).
In the hippocampus, no SI changes in any of the images (FLAIR, T2-weighted TSE, b0, or DW images) were observed; there was a wide variation of ADC values, which was always comparable with those of controls.
Discussion
Involvement of the thalamus on MR images is considered a diagnostic key feature of vCJD. Few published reports address SI changes in the thalamus of sCJD patients (20–22). In contrast, neuropathology virtually always shows the thalamus involved in sCJD. In the present study, we were able to confirm thalamic involvement in six consecutive sCJD patients on the basis of quantitative analyses of diffusion changes.
DW imaging is a new tool in the diagnosis of CJD. Previously, changes on DW images have been described in single case studies or small series (12, 18, 19, 21–31). The SI changes in sCJD usually predominate in the striatum (26, 27) and in some cases in the cerebral cortex (18, 19, 25, 32). Few published reports address SI changes in the thalamus (20–22). In the largest study, comprising 13 sCJD patients, only one patient is reported to show SI changes in the thalamus on DW images (12).
Our study shows that thalamic involvement in sCJD may be difficult to identify but is clearly measurable in DW images. In the pulvinar thalami, four of six sCJD patients had increased SI on DW images, and all patients had decreased ADCs. In the MD, no DW imaging SI changes were detectable, but ADCs were significantly decreased.
The pathophysiologic basis of the SI changes on DW images is not yet understood. All three major neuropathologic hallmarks of CJD, nerve cell loss, spongiform change, and astrocytic gliosis, are discussed to explain the SI changes. For the hyperintense SI changes on T2-weighted images, a correlation with gliosis was found in a hamster model of spongiform encephalopathy, whereas increasing spongiform change tended to decrease T2 values (33). Zeidler and colleagues (14) found histologic gliosis in vCJD corresponded with the “pulvinar sign” on T2-weighted MR images.
To our knowledge, only two studies compare autopsy data with DW imaging findings. In a study by Mittal and colleagues (18), hyperintense SI changes in DW images obtained in two sCJD patients corresponded with spongiform change and nerve cell loss but not to astrocytic gliosis; however, a reduction of ADCs correlated with astrocytic gliosis and also with spongiform changes and nerve cell loss. By contrast, Haik and colleagues (20) reported that high SI on DW images correlated with accumulation of the pathologic form of PrPSc in the brain but not with spongiform changes or gliosis.
These conflicting results may be partly explained by the rapidly changing pathologic characteristics of CJD. Histologic findings may not correspond with the imaging findings if an MR examination is performed weeks (as in the work of Mittal and colleagues [18]) or months before death. Our results clearly show the dynamic nature of the CJD disease process. In the pulvinar thalami, an ADC reduction already existed at the time of the first examination in a patient who underwent serial imaging, but no SI changes were visible on concurrent DW images. At the time of the second examination, ADCs had further decreased and SI in the pulvinar thalami increased on the DW image. In the third DW examination, the pulvinar thalami did not show SI changes, and ADCs were normal. Thus, the ADC is reduced before diffusion changes are discernable on DW images, and the ADC varies during the course of disease.
Our serial measurements concur with those in one sCJD case reported by Matoba and colleagues (26). In their study, ADCs in the affected cortex decreased during the first 3 months of disease and increased after 4 months to normal values. A possible neuropathologic explanation exists for reduced ADC at the time of first measurements. At onset of disease, spongiform neuropil changes (ie, an accumulation of abnormal intracytoplasmic vacuoles [16]) occur in affected brain areas. These spongiform changes lead to a reduction of extracellular space and thus to restricted diffusion, decreased ADCs, and corresponding SI on DW images. As long as these spongiform changes persist and the areas in which the pathologic changes are present expand, the ADC values further decrease and high SI on DW images persists.
The disappearance of the hyperintense SI and increasing ADCs during the disease course are paralleled in the literature with severe brain atrophy (25, 26). An explanation for the augmentation and normalization of the ADCs during late stages of the disease could be the ongoing destruction of the brain tissue with progressive nerve cell loss. This could then lead to an augmentation of extracellular space and thus to increased diffusion. In our patient, the hyperintense SI changes had not totally disappeared after 8 months, but the head of the caudate nucleus on one side was no longer identifiable on the DW images; in this nucleus, ADC measurements were not possible (Fig 4C and F). Because the disease course in sCJD is very variable, we presume that the patient described by Matoba et al (26) was at a more advanced disease stage than our patient, and therefore the SI changes on the DW images in this patient had totally disappeared.
The fact that in all sCJD patients the MD showed reduced ADCs without discernable SI changes on DW images might be because this nucleus is located near the third ventricle and is therefore prone to artifacts. In addition, the MD is smaller than the other basal ganglia nuclei usually considered in sCJD (the striatum and the pulvinar) and might not be easily discerned from the surrounding gray matter and third ventricle.
To ensure that the ADC changes in the MD are not a result of “general” diffusion change in sCJD, we measured ADCs in the striatum as an internal positive control and in the hippocampus as an internal negative control. As previously reported (26, 29), ADCs were reduced in the striatum in all sCJD cases. ADC values in the hippocampus in sCJD cases and controls did not differ significantly, and no SI changes on DW images were discernable. Although one sCJD case in the literature (31) reports SI changes on DW images in the hippocampus, our normal ADCs in the hippocampus corresponded with the known pathologic finding in sCJD of relative hippocampal sparing (16). As in other studies (18, 21, 22, 26–28, 30, 32), DW images were more sensitive in the detection of hyperintense SI changes as compared with T2-weighted TSE or FLAIR images. Bahn and Parchi (22) hypothesized that the high SI on DW images is due to a synergistic effect of abnormal T2 values and restricted diffusion, which would explain the high sensitivity of DW imaging in the early detection of typical CJD changes.
One of the limitations of our study was that ADCs in the two patients without SI changes in the pulvinar thalami were reduced to a greater extent than in those four patients with increased SI on DW images. The difference between the two small groups was in the range of the standard deviation and not significant. In contrast, all sCJD patients had significantly reduced ADCs as compared with the control group. Thus, diffusion changes are present in CJD, although in some cases they are only measurable and not visible. We speculate that, with refinement of DW imaging (eg, increased sensitivity to proton diffusion by increasing the b factor), the thalamic lesions will be easier to identify in sCJD.
In accordance with others, FLAIR images in our study showed a higher sensitivity than that of T2-weighted TSE images (22, 34) but a lower sensitivity than that of DW images (12, 25, 26, 28, 31) for the detection of hyperintense SI changes. This was due to motion artifacts in one patient in whom the SI changes in the pulvinar thalami were visible on DW images but not on FLAIR images. Observations of other groups showed that DW images not only show the SI changes more clearly but also earlier than FLAIR images (25, 26, 28). This is probably because high SI on FLAIR images corresponds with gliosis and therefore with a later disease state than the DW images. In addition to the short acquisition time, DW imaging has the advantage over FLAIR images that quantitative measurements can be performed. In our study, we showed diffusion changes also in those sCJD patients without discernable SI abnormalities.
Conclusion
ADC measurements help identify diffusion changes in the pulvinar thalami and MD thalamic nucleus in sCJD that are not visible on DW images. Serial measurements show that ADC reduction precedes SI changes on DW images. ADC measurements thus might help to identify early sCJD cases with only slight MR imaging SI changes. A further refinement of DW imaging likely leads to a better identification of subtle diffusion changes in sCJD patients.
References
- Received October 21, 2002.
- Accepted after revision December 16, 2002.
- Copyright © American Society of Neuroradiology
In this issue


Jump to section
Related Articles
Cited By...
- Mediodorsal nucleus and its multiple cognitive functions
- High-b-Value Diffusion MR Imaging and Basal Nuclei Apparent Diffusion Coefficient Measurements in Variant and Sporadic Creutzfeldt-Jakob Disease
- Brain-water diffusion coefficients reflect the severity of inherited prion disease
- Enhanced Detection of Diffusion Reductions in Creutzfeldt-Jakob Disease at a Higher B Factor
- Pathologic correlates of diffusion MRI changes in Creutzfeldt-Jakob disease
- Neuroimaging findings in human prion disease