
Article Figures & Data
Figures
- Fig 1.
PRES in a pregnant woman with eclampsia (patient 21).
A–C, Axial fluid-attenuated inversion recovery (FLAIR) MR images (TR/TE/TI/NEX, 11,002/140/2250/1; FOV, 20) show symmetric abnormal signal intensity, primarily in the territories of the posterior circulation. The affected area predominantly involves the white matter, but cortex is also involved. Note the involvement of the caudates, which was unusual in our series.
D–F, Isotropic diffusion-weighted MR images (TR/TE, 10,000/91.7; FOV, 40; b = 1,000 s/mm2) show low to normal signal intensity in the areas of the FLAIR abnormality.
G–I, ADC maps show increased values in the areas of FLAIR abnormality.
- Fig 2.
ROI placement. Axial FLAIR-prepped echo-planar T2-weighed images (TR/TE/TI, 10,000/91.7/2200; FOV, 40; b = 0 s/mm2) in a patient with PRES secondary to uremic encephalopathy (patient 17). Nineteen ROIs were systemically placed in 22 patients with PRES and 18 control subjects, as shown. The images were coregistered to the ADC map, on which measurements were taken. Typical ROI sizes varied with brain region, as follows: cerebellum, 400 mm2; pons, 240 mm2; lenticular nucleus, 250 mm2; corticospinal tract, 60 mm2; posterior temporal lobe, 360 mm2; caudate head, 60 mm2; thalamus, 220 mm2; occipital lobe, 360 mm2; parietal lobe, 400 mm2; frontal lobe, 500 mm2.
- Fig 3.
Mean ADC values in brain regions in patients with PRES and control subjects. Percentage of patients with T2 and FLAIR signal intensity abnormalities in each brain region is shown. Both posterior and anterior circulation structures are involved. ADC values in abnormal areas in patients are elevated compared with those in control subjects (P < .04); this finding was consistent with vasogenic edema. ADC values in control subjects were lower in the cerebellum and pons (P < .001). Mean ADC values from homologous hemispheric structures are averaged together for presentation purposes.
- Fig 4.
Atypical cases of PRES.
A, Axial FLAIR MR image in a case of uremic encephalopathy (patient 18) shows marked frontal lobe involvement.
B and C, Axial FLAIR MR images (TR/TE/TI/NEX, 11,002/140/2,250/1; FOV, 20) in a case of hemolytic-uremic syndrome (patient 22) show involvement in the temporal lobes and thalami. Note also the striking involvement of the brain stem.
- Fig 5.
In patients who had an adverse outcome (stroke or death), T2/DWI scores (P < .001) and ADC values (P < .02) were consistently higher than those of patients who recovered. Patient 4 had cortical DWI hyperintensity at presentation. The patient then recovered and was subsequently lost to follow-up. Patients 6 and 11 had cortical DWI hyperintensity with progression to stroke at follow-up. Patients 14, 15, and 18 had cortical DWI hyperintensity and died before follow-up. Patient 7 had foci of intracranial hemorrhage at presentation. Patients 12 and 22 had severe brain stem PRES.
- Fig 6.
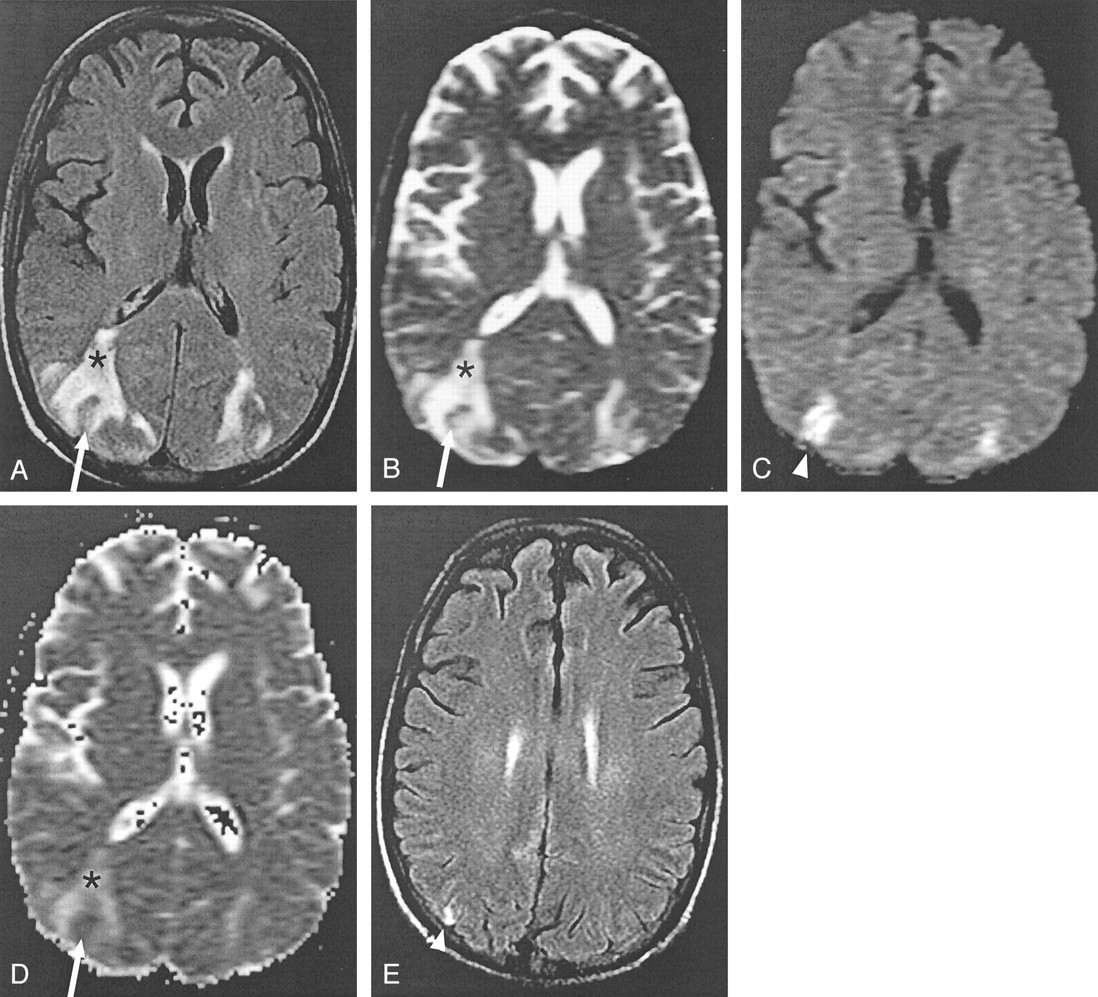
Intravoxel averaging of cytotoxic and vasogenic edema in a case of cyclosporin neurotoxicity (patient 11).
A and B, Axial FLAIR (TR/TE/TI/NEX, 11,002/140/2250/1; FOV, 20) (A) and echo-planar T2-weighted (TR/TE, 10,000/91.7; FOV, 40; b = 0 s/mm2) (B) MR images show bilateral areas of increased signal intensity in the occipitotemporal lobes, which are consistent with vasogenic edema (asterisk). A rim of abnormal signal intensity surrounds a small section of cortex, which is relatively spared with only mildly elevated signal intensity (arrow).
C, Isotropic diffusion-weighted images (TR/TE, 10,000/91.7; FOV, 40; b = 1000 s/mm2) show high signal intensity in the areas of apparent sparing (arrowhead).
D, ADC map shows increased diffusion in the areas of vasogenic edema (asterisk), as expected. The areas of high signal intensity in C do not have low ADC values, as would be expected in ischemic brain. Instead, the values are pseudonormalized (arrow).
E, Follow-up FLAIR image obtained 28 days later shows increased signal intensity (arrowhead) corresponding to the region of abnormal findings at DWI. Gyriform, increased T1 signal intensity and subtle enhancement (not shown) was also present; this finding is consistent with petechial hemorrhage into a subacute infarct (not shown).
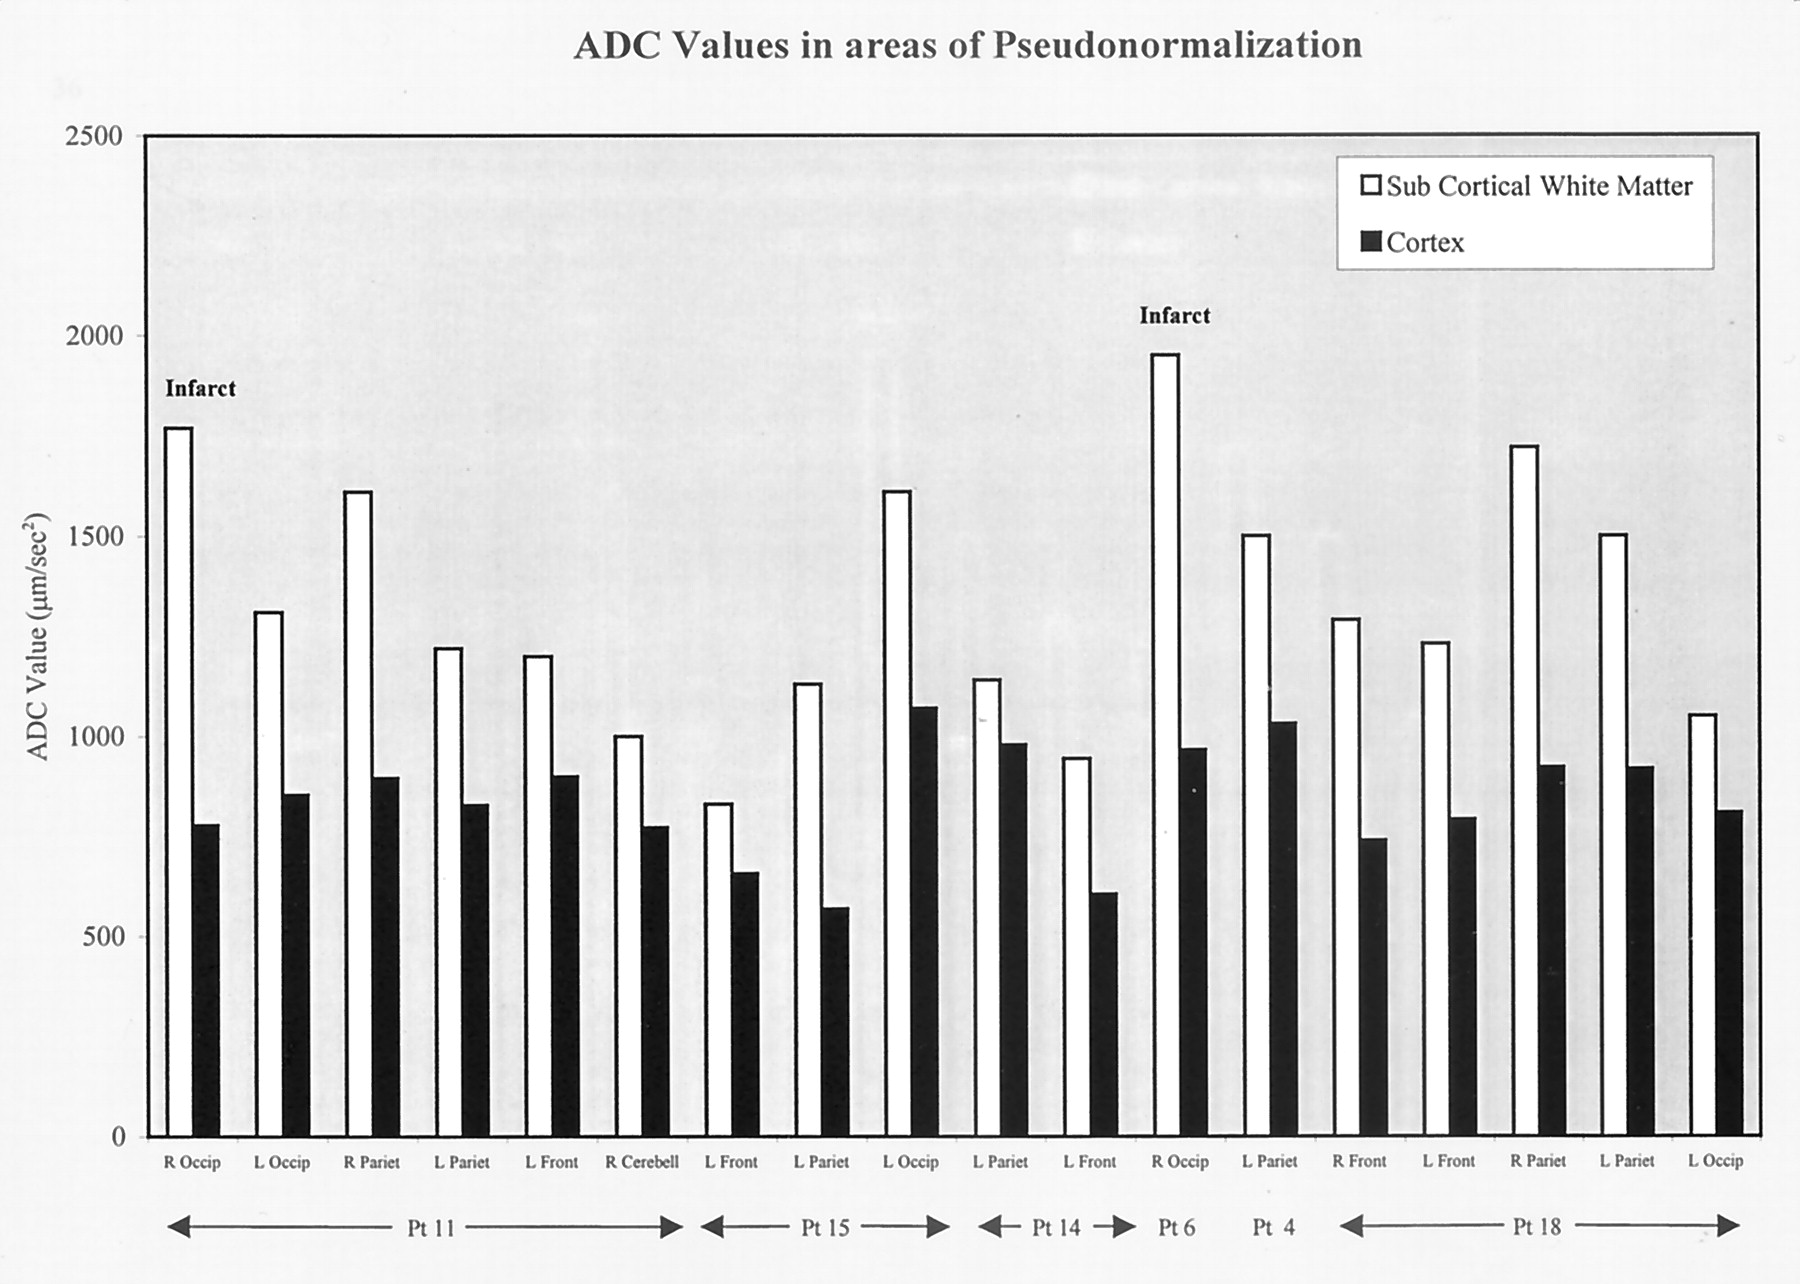
- Fig 7.
ADC values in areas of pseudonormalization. High values were seen in the subcortical white matter and pseudonormalized values were seen in the cortex. Pseudonormalization results from intravoxel averaging of vasogenic and cytotoxic edema in cortex. In two patients, follow-up images confirmed the development of infarcts in areas of pseudonormalization.
- Fig 8.
Schematic representations of the diffusion signal intensity in vasogenic edema and pseudonormalization in cortex affected by PRES. By definition, the slope of the signal intensity is plotted on the ADC map, and the magnitude of the signal intensity at b = 1,000 s/mm2 is plotted on the diffusion-weighted image.
A, Vasogenic edema. Because water is highly mobile in areas of vasogenic edema, the slope of the signal intensity is steeper and the ADC values are higher, as shown in Figure 1G–I. At b = 1000 s/mm2, the magnitude of the diffusion signal intensity is either normal or below normal, as shown in Figure 1D–F.
B, Pseudonormalization. The net diffusion signal intensity results from averaging of a cytotoxic component, which has restricted water motion and therefore has a shallow slope, and a vasogenic component, with a steep slope. The net diffusion signal intensity line is parallel to the normal case but higher in magnitude. Because the slopes are parallel, ADC values are isointense or normal in the areas of pseudonormalization, as shown in Figure 6D. Because the magnitude is higher at b = 1000 s/mm2, the DWI signal intensity is high, as shown in Figure 6C.


Tables
Patient information
Patient No./Age (y)/Sex Diagnosis Symptoms Time Vulnerable Time to Imaging Base BP, mmHg Present BP, mmHg Increase in BP, % Creatinine Level, mg/(mg/dL) BUN Level (mg/dL) CSA Level (ng/dL) Tacrolimus Level (ng/dL) 1/90/M HTN encephalopathy due to renal artery stenosis Headache, confusion <12 h 23 h 120/66 231/116 84 1.2 16 − − 2/59/F HTN encephalopathy (idiopathic) Seizure, hemiparesis 2 mo 9 d 150/70 240/100 52 0.7 17 − − 3/79/F HTN encephalopathy (idiopathic) Seizure, cortical blindness, hemiparesis 7 d 6 d 108/48 205/90 89 1.1 8 − − 4/42/F HTN encephalopathy, Crohn disease, anastomotic leak, sepsis Seizures 36 h 19 h 105/40 170/75 73 0.6 20 − − 5/59/F HTN encephalopathy, lupus nephritis Headache, seizure 3 wk 28 d 120/66 240/140 106 3.3 32 − − 6/67/M HTN encephalopathy, ARF, uremia Altered MS, visual hallucinations 25 d 10 d 110/62 220/90 71 7.4 64 − − 7/63/F HTN encephalopathy, scleroderma, renal failure Seizures, hemiparesis 24–48 h 3 d 140/60 200/106 58 6.2 42 − − 8/9/M CSA neurotoxicity, LTx for idiopathic failure Hemiparesis, altered MS >5 mo 5 mo 120/70 140/70 8 0.7 9 752 − 9/10/M CSA neurotoxicity, BMT for AML Visual changes 48 h 4 h 112/72 170/100 45 0.5 18 182 − 10/4/M CSA neurotoxicity, LTx for biliary atresia Seizures 12 d 22 h 99/59 160/110 75 0.6 22 416 − 11/30/M CSA neurotoxicity, BMT for T-cell lymphoma, CPI Cortical blind, altered MS 60 h 3 d 106/68 136/88 29 2.0 80 1467 − 12/59/F CSA neurotoxicity, BMT for ALL, sepsis Altered MS 24 d 21 d 60/45 200/80 140 9.1 96 427 − 13/47/F Tacrolimus neurotoxicity, LTx for hepatitis C Seizures 3 mo 2 d 100/50 150/95 70 1.0 42 − 27.5 14/59/M Tacrolimus neurotoxicity, living-donor LTx for cholangiocarcinoma Cortical blindness, altered MS 4 mo 2 d 140/90 150/100 9 1.0 33 − 5.9 15/51/M Tacrolimus neurotoxicity, uremia, LKTx (oxaluria), sepsis Altered MS, unresponsive 10 d 8 d 80/40 205/104 158 2.7 100 − 11.3 16/53/F Uremia, peritoneal liposarcomatosis, sepsis Seizures, altered MS 12 d 2 d 75/44 185/110 148 3.8 103 − − 17/25/M Uremia, acute pancreatitis, ARF on CRI Seizures 36 h 3 d 110/55 163/120 83 3.6 75 − − 18/32/F Uremia, CRI (idiopathic) Seizure 7 d 21 h NA 212/133 NA 5.2 155 − − 19/28/F Uremia, HTN encephalopathy, Wegener nephropathy Seizures 24 h 3 d 157/100 239/172 63 HD 67 − − 20/17/F Eclampsia Seizure, cortical blindness 2 d 3 d 112/70 220/135 94 1.1 8 − − 21/46/F Eclampsia Seizure 36 h 5 h NA 150/70 NA 1.0 10 − − 22/68/F Hemolytic-uremic syndrome, ARF Seizure, altered MS 16 d 13 d 80/40 215/90 147 6.1 81 − − Note.—ALL indicates acute lymphocytic leukemia; AML, acute myelogenous leukemia; ARF, acute renal failure; BMT, bone marrow transplant; CRI, chronic renal insufficiency; CSA, cyclosporin (normal levels, 100–300); HD, hemodialysis; HTN, hypertension; LKTx, liver-kidney transplantation; LTx, liver transplantation; MS, mental status not available; percentage increase in BP was computed as follows: [(MAP at presentation − MAP at baseline)/MAP at baseline] × 100%, where MAP = [systolic BP + 2(diastolic BP)]/3. Normal BUN levels, 8–24 ng/mL; and Normal tacrolimus levels, 3–20 ng/mL.
In this issue


Jump to section
Related Articles
Cited By...
- Posterior reversible encephalopathy syndrome
- Posterior reversible encephalopathy syndrome associated with the use of chemotherapeutic agents: a rare complication after treatment with vinorelbine
- A case of posterior reversible encephalopathy syndrome associated with sepsis
- Controversy of posterior reversible encephalopathy syndrome: what have we learnt in the last 20 years?
- Centripetal Propagation of Vasoconstriction at the Time of Headache Resolution in Patients with Reversible Cerebral Vasoconstriction Syndrome
- Reply:
- Reply:
- Posterior reversible encephalopathy syndrome in malignant hypertension secondary to focal segmental glomerulosclerosis
- Utility and Significance of Gadolinium-Based Contrast Enhancement in Posterior Reversible Encephalopathy Syndrome
- Cytotoxic Edema in Posterior Reversible Encephalopathy Syndrome: Correlation of MRI Features with Serum Albumin Levels
- Cortical abnormalities on MRI: what a neurologist should know
- What to see when you are looking at confusion: a review of the neuroimaging of acute encephalopathy
- An MRI review of acquired corpus callosum lesions
- An unusual cause of altered mental status: the importance of monitoring a patient's blood pressure
- Posterior reversible encephalopathy syndrome (PRES) in a patient with late postpartum eclampsia
- "Dazed and diffused": making sense of diffusion abnormalities in neurologic pathologies
- Placental Ischemia Impairs Middle Cerebral Artery Myogenic Responses in the Pregnant Rat
- Erratum
- Dr. Varaprasad and Dr. Agrawal reply
- The posterior reversible encephalopathy syndrome: what's certain, what's new?
- A 3-year old girl with seizures, hypokalemia and metabolic alkalosis
- Posterior reversible encephalopathy syndrome: long-term follow-up
- MR Imaging Findings of Medulla Oblongata Involvement in Posterior Reversible Encephalopathy Syndrome Secondary to Hypertension
- Posterior reversible encephalopathy syndrome in neuromyelitis optica spectrum disorders
- Headache, blindness and a seizure after childbirth
- SIROLIMUS-INDUCED POSTERIOR REVERSIBLE ENCEPHALOPATHY
- A pressing case of transient blindness
- Creutzfeldt-Jakob disease mimicking radiologic posterior reversible leukoencephalopathy
- Reversible diffusion MRI abnormalities and transient mutism after liver transplantation
- Reversible diffusion MRI abnormalities and transient mutism after liver transplantation
- Nitroglycerin-aggravated pre-eclamptic posterior reversible encephalopathy syndrome (PRES)