
Article Figures & Data
Figures
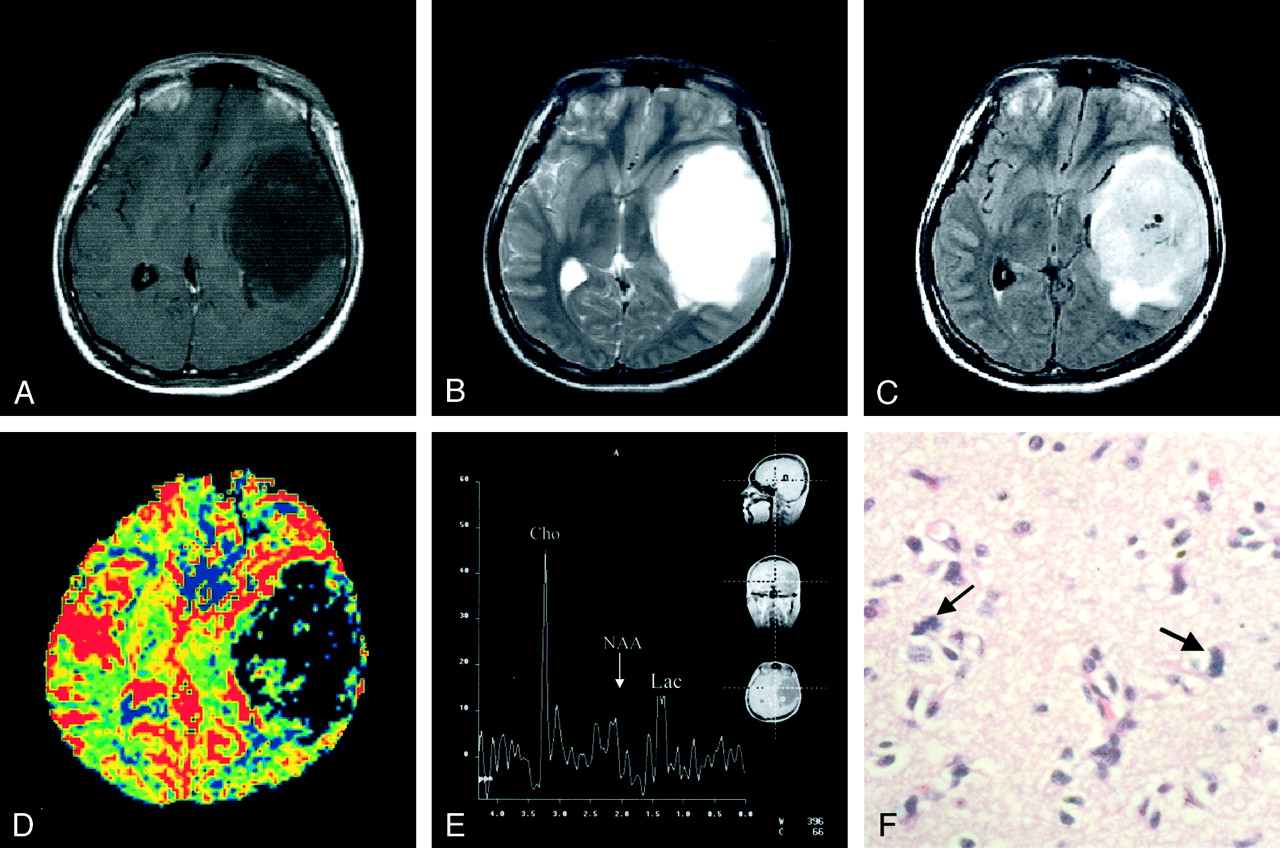
- Fig 1.
Initial MR imaging examination performed in April 1998.
A, No enhancement of the hypointense tumor mass in the left temporal lobe was revealed by contrast-enhanced T1-weighted images.
B, No obvious associated white matter edema was observed on T2-weighted images.
C, No obvious associated white matter edema was observed on fluid-attenuated inversion recovery images.
D, rCBV map showed abnormally lower blood volume in the lesion than in the contralateral homologous normal hemisphere.
E, Corresponding MR spectroscopic findings showed markedly increased choline (Cho), whereas N-acetylaspartate (NAA) was found to decrease to almost zero. Lac, lactate.
F, Photomicrograph showed some tumor cells of astrocytic origin, with moderate pleomorphism and chromatin attenuation (hematoxylin and eosin; original magnification, ×400).
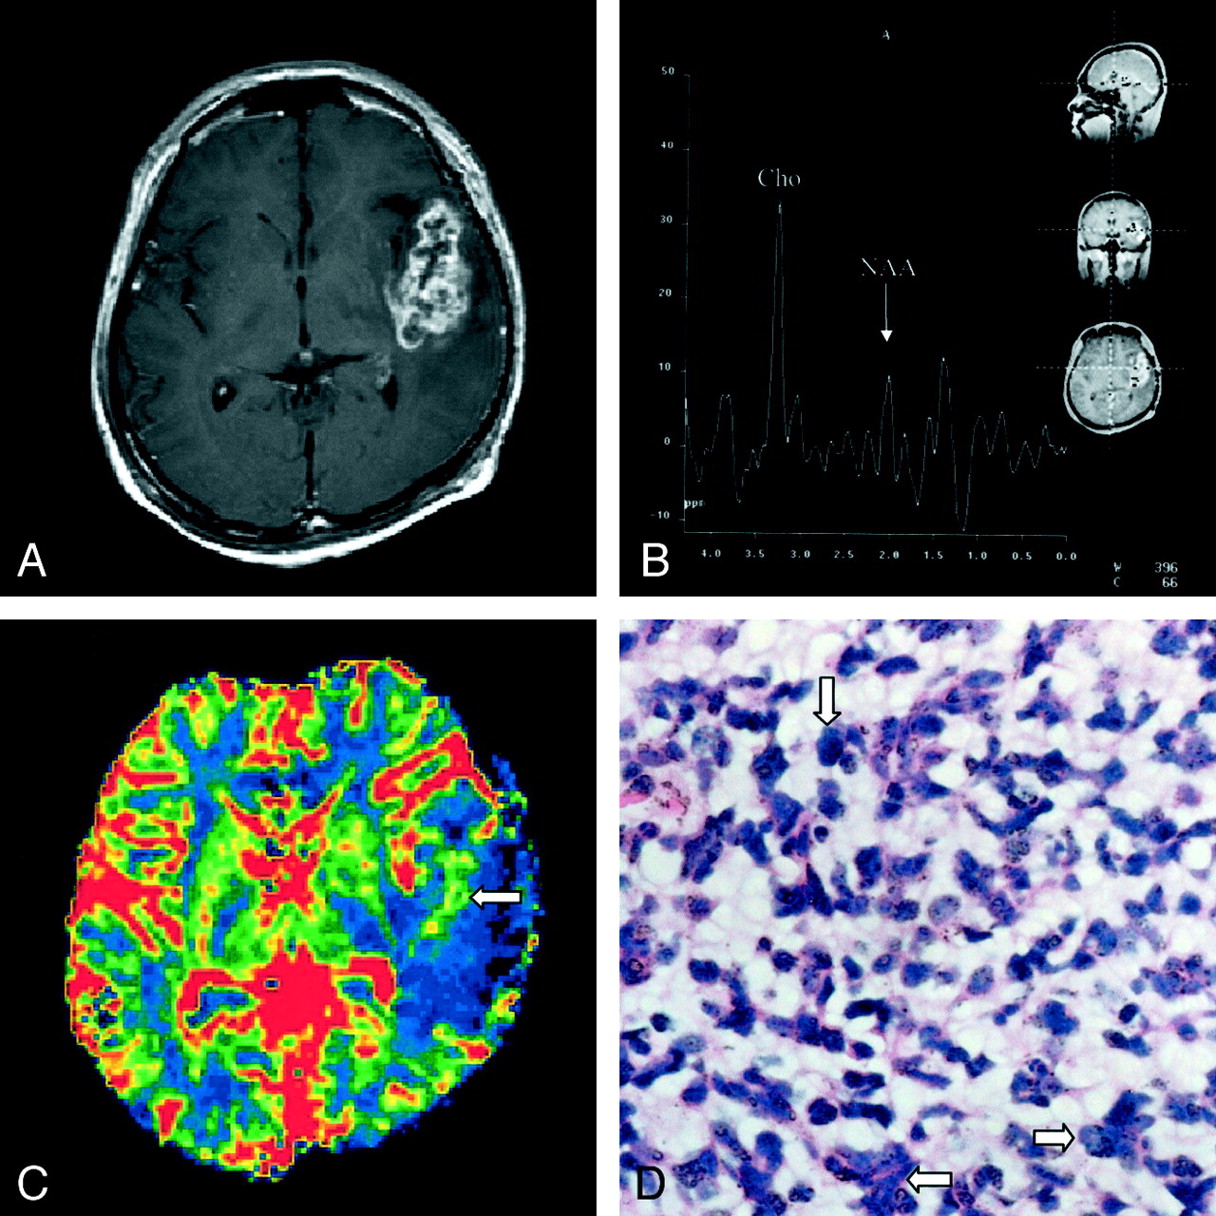
- Fig 2.
Second MR imaging examination performed in June 2000, using same protocol as that used for first examination.
A, Contrast-enhanced T1-weighted images showed an enhancing lesion in the previous surgical bed over the left temporal lobe.
B, MR spectral sampling from the abnormal enhancing lesion showed a high choline (Cho) concentration and exceedingly low N-acetylaspartate (NAA).
C, rCBV map showed slightly increased blood volume in the medial aspect of tumor territory (arrow), compared with the unusual absence in the first examination. Nevertheless, the rCBV remained largely lower in the lesion than in the contralateral homologous normal hemisphere.
D, Photomicrograph, obtained 27 months after the first histologic study, showed malignant undifferentiated tumor cells with marked cytoplasmic and nuclear pleomorphism (arrows). Packed large tumor cells with densely hyperchromatic nuclei were noted (hematoxylin and eosin; original magnification, ×400). The tumor also showed areas of necrosis (not shown).
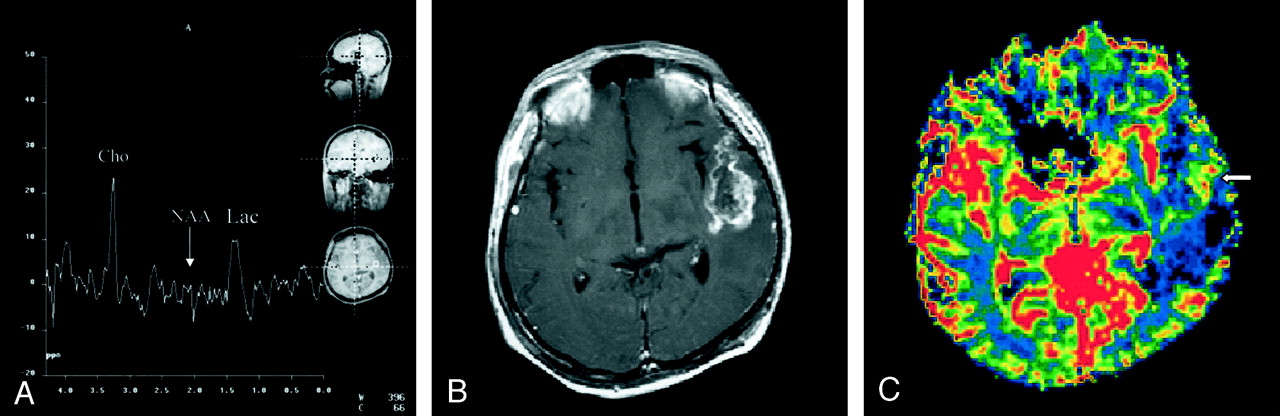
- Fig 3.
Third MR spectroscopic study performed in January 2001.
A, High choline (Cho) concentration and hardly detectable N-acetylaspartate (NAA) peak could be seen. Lac, lactate.
B, Contrast-enhanced T1-weighted images showed heterogeneous enhancement of the left temporal lobe tumor.
C, In contrast to the low blood volume in lesion revealed by the first perfusion study 3 years previously, the rCBV map began to show increased blood volume in the superficial region of the tumor area (arrow).


