
Abstract
BACKGROUND AND PURPOSE: MR imaging has the potential capacity for noninvasively depicting the anatomy and function of thalamic nuclei. The purpose of this study was to identify the lateral geniculate nucleus (LGN), which is the thalamic relay nucleus for vision, with anatomic and functional MR imaging at 1.5 T.
METHODS: Three-millimeter-thick axial images were obtained from eight volunteers by using a double-echo turbo spin-echo sequence for proton density– and T2-weighted contrast and a spin-echo 3D gradient-echo sequence for T1-weighted contrast. Each participant underwent a visual activation experiment using gradient-echo echo-planar imaging at the same location as that of the anatomic study.
RESULTS: In all cases, the LGN was recognized on proton density–weighted images as a small wedge-shaped area of high signal intensity relative to that of the surrounding white matter tracts. However, it was difficult to identify the LGN on T1- and T2-weighted images because of the smaller contrast-to-noise ratios between the LGN and the adjacent white matter tracts, compared with those of proton density–weighted images (P < .001). Bilateral thalamic activation and activation in the occipital cortex were shown in all participants. Each region of thalamic activation (23 ± 3 mm2) was localized to the anatomically identified LGN.
CONCLUSION: The excellent correspondence between the anatomically and functionally identified LGN confirms that MR imaging is an indispensable method for visualizing functional neuroanatomy in thalamic nuclei.
The thalamus is a complex cluster of gray matter nuclei located at the junction of the brain stem and cerebral hemispheres. A large number of pathways, including many sensory pathways, relay in more or less separate nuclei in the thalamus. Among these, the visual pathway relays in a distinctive subdivision of the thalamus, the lateral geniculate nucleus (LGN). The LGN is innervated by most of the optic tract axons arising from retinal ganglion cells. In turn, neurons in the LGN give rise to axons that project by way of the optic radiation to the striate cortex in the ipsilateral occipital lobe.
Although the LGN is one of the main components of the visual pathway, it seems to be the one to which least attention is paid in the radiology literature. This discrepancy is thought to arise because the normal LGN is difficult to identify on MR images. Findings from a previous MR imaging study of brain specimens and healthy subjects (1) have suggested that the LGN is not consistently visible on either T1- or T2-weighted images, even with high spatial resolution. This study showed that proton density–weighted images with high spatial resolution were essential for visualizing a small structure of 4–6-mm diameter (2). However, the use of a conventional spin-echo rather than a turbo spin-echo sequence resulted in prolonged imaging times of > 20 min.
Recent developments in functional MR imaging have enabled us to detect activation of subcortical deep gray matter, as well as cortical regions. In previous studies, LGN activation during visual stimulation has been shown successfully in individual participants with imaging at 2 and 4 T (3–6), in a group of participants at 2 T (5), and in monkeys at 4.7 T (7). However, because the thalamus is a complex cluster of nuclei, including the LGN, it is essential for the unequivocal identification of activation of this small thalamic nucleus with functional MR imaging to test whether the activation corresponds correctly to the anatomically identified LGN.
The purposes of this study were to determine an optimal pulse sequence for the identification of the normal LGN on anatomic MR images within an acceptable measurement time and to investigate whether the functionally identified LGN with blood oxygenation level–dependent (BOLD) contrast-based functional MR imaging (8–10) correctly corresponds to the anatomically identified LGN by using a clinical 1.5-T MR imager.
Methods
Eight healthy volunteers (seven male and one female participant; mean age, 35 years; age range, 25–43 years) participated in this study. Informed consent was obtained from each participant, as approved by our institutional review board. All imaging was performed by using a 1.5-T Vision MR imager (Siemens, Erlangen, Germany) equipped with echo-planar imaging capabilities (with a maximum gradient strength of 25 mT/m and peak slew rate of 83 mT/m/ms). The participants were positioned in a standard, circularly polarized head coil by using a foam pad. For each participant, shimming was performed over the whole brain with the autoshim feature.
Anatomic Study
We obtained axial proton density– and T2-weighted images parallel to the anterior and posterior commissure lines by using a double-echo turbo spin-echo sequence with the following parameters: 3000/14/85/2 (TR/TE1/TE2/excitations); echo train length, 5 for each echo; matrix, 250 × 256; field of view, 200 mm; section thickness, 3 mm; 16 multisections with a 1-mm intersection gap. T1-weighted spin-echo images (400/12/3 [TR/TE/excitations]) were obtained at the same location and spatial resolution. Three-dimensional magnetization-prepared rapid gradient-echo images (13.5/7/2; inversion time, 300 ms; matrix, 192 × 256; field-of-view, 200 mm; 48 sections of 72-mm slab thickness) were also obtained for T1-weighted contrast at the same location. The 3D magnetization-prepared rapid gradient-echo images were then resectioned with a 3-mm section thickness and a 1-mm intersection gap for direct comparison with the other anatomic images. The imaging times for each sequence were almost identical, within the range of 5 min 6 s to 5 min 9 s.
Three neuroradiologists (N.F., H.T., H.Y.) identified the LGN on the anatomic images by consensus. The location of the LGN was determined according to distinct anatomic landmarks surrounding the LGN, such as the posterior limb of the internal capsule, the optic radiation, and the lateral recess of the ambient cistern. The observers then investigated proton density–, T1-, and T2-weighted axial images to see whether it was possible to identify the LGN at its expected location as an area of different signal intensity compared with that of the surrounding tissues.
For quantitative evaluation, a single observer (N.F.) measured the signal intensity from the LGN and the surrounding tissues. Regions of interest for the LGN and the surrounding fiber tracts, which are the optic radiation and the posterior limb of the internal capsule, were determined on proton density–weighted images, whereas the region of interest for CSF in the ambient cistern was determined on T2-weighted images. Each region of interest was carefully set to exceed 16 pixels in size and to contain only target tissues. The posterior third quarter of the posterior limb of the internal capsule frequently shows hyperintense foci on T2-weighted images (Fig 1C); these foci are reported to correspond to fascicles of the corticospinal tract (11). To avoid contamination from these foci, the region-of-interest setting for the posterior limb of the internal capsule was restricted to its posterior fourth quarter immediately anteromedial to the LGN. The signal-to-noise ratio of the LGN with each image was calculated as SILGN /N, where SI was the signal intensity, and N was the SD of the background noise. Contrast-to-noise ratios of the LGN were calculated as |SILGN − SIST|/N, where ST indicates the surrounding tissue.

Images of participant 3. All images were obtained 4 mm inferior to the bicommissure line.
A, Proton density–weighted image (3000/14/2) shows the LGN (black arrowheads) bordered sharply by the optic radiation (OR) and the posterior limb of the internal capsule (PL). The medial geniculate nucleus can be seen as a small rounded eminence adjacent to the ambient cistern (white arrowheads).
B, Activation map superimposed on the proton density–weighted image shows 3-pixel clustered activation at the anatomically identified location of each LGN. Red pixels represent activation.
C, T2-weighted image (3000/85/2). The LGN is only faintly visible and its borders are difficult to identify. Note the bandlike areas of slightly higher intensity, compared with the surrounding area, in the posterior third quarter of the posterior limb (arrowheads). SC indicates the superior colliculus; HP, hippocampus.
D, T1-weighted magnetization-prepared rapid gradient-echo image (13.5/7/2; inversion time, 300 ms; resectioned). The LGN is only faintly visible, and its borders are difficult to identify.
Functional Study
A functional MR imaging study was performed by using single-shot multisection T2*-weighted echo-planar imaging, with the following parameters for all participants: 2000/70 (TR/TE); flip angle, 90°; matrix, 64 × 64; field of view, 200 mm; section thickness, 3 mm. A total of 128 axial image sets were obtained, each consisting of 16 sections with a 1-mm intersection gap that matched the same location and orientation as those of the axial anatomic images obtained parallel to the bicommissure line. Visual stimulation was provided with an in-house binocular light goggle flashing at 8 Hz. The stimulation protocol consisted of a 40-s rest period and then a 40-s stimulation period, repeated three times. Each participant was instructed to keep his or her eyes closed during the rest period.
Functional MR imaging data were transferred to an off-line Macintosh G3 computer. The data were analyzed by using in-house software developed from National Institutes of Health Image v1.61 (W. Rashband, National Institutes of Health, Bethesda, MD). Involuntary head movements were estimated by calculating the center of mass of each echo-planar image in a functional series. To obtain data without motion artifacts, any functional series that was associated with head movements of >0.5 mm in the central 32 × 32 pixels on each image was discarded, and the series was repeated in a new imaging session. We evaluated head movements in the central area, because the movement estimation over the whole area of 64 × 64 pixels was considerably affected by signal intensity fluctuation in areas with a low signal-to-noise ratio. Cross-correlation coefficient images were calculated by comparing the signal intensity with a standard time-shifted (6-s hemodynamic delay) boxcar function (12). Pixels were retained on the functional image when the correlation coefficient was >0.3, which corresponded to the probability value P < .001 for false-positive images showing activated pixels. In any case, 2 pixels are expected to be activated by chance over the brain area investigated for statistical analysis (approximately 2000 pixels for each section). To reduce the number of falsely activated pixels, the resulting binary map was filtered by using a 2-or-more pixel cluster filter, in which a cluster was defined as pixels connected by either edges or corners (13, 14). The effective number for chance activation of 2-or-more pixel clusters over the investigated brain area was calculated to be <0.05 (14), which was much smaller than the value of 2-pixel activation in the case of a no-cluster filter. Because the volume of the LGN is estimated to be approximately 100 mm3 (2), the assumption of 2 or more voxels of 3 × 3 × 3 mm for LGN activation, corresponding to >54 mm3 in volume, is considered to be justified.
For each participant, the identification of LGN activation was performed according to the superposition of the activation maps on the anatomic images; the number of activated pixels and the BOLD signal change were evaluated relative to the rest condition. We measured the coordinates of the center of mass of LGN activation according to the reference system based on the bicommissure line. An orthogonal reference was centered on the anterior commissure (x,y,z: 0,0,0), where the x axis was defined as the left-to-right direction; the y axis, as the posteroanterior direction; and the z axis, as the inferosuperior direction. Before measurement, functional T2*-weighted images and turbo spin-echo T2-weighted images of the same section position, both having a similar image contrast, were compared to see whether distortion was present on the T2*-weighted echo-planar images.
Results
Anatomic Study
For all participants, the LGN was recognized on axial proton density–weighted images as a small area of high signal intensity relative to that of the surrounding white matter (Figs 1A and 2A). The LGN appeared as a wedge, with the lateral border sharply defined by the optic radiation and the anteromedial border defined by the posterior limb of the internal capsule. The medial geniculate nucleus, which is the thalamic relay nucleus for the auditory pathway, was frequently identified posteromedial to the LGN (Fig 1A). The posteromedial border of the LGN was indistinct because it blended with the medial geniculate nucleus and the lateral wing of the ambient cistern, which were of almost the same signal intensity as that of the LGN on proton density–weighted images. There was no disagreement in the opinions of the three observers regarding the LGN identification on axial proton density–weighted images because of its characteristic location and shape.
The LGN was difficult to identify on T1- and T2-weighted images as an area of different signal intensity because of the indistinct border between the LGN and the surrounding white matter (Fig 1C and D). Although individual 1.5-mm-thick 3D magnetization-prepared rapid gradient-echo images were also reviewed, as were resectioned 3-mm-thick images, all three observers agreed that LGN identification on the T1- and T2-weighted images was equivocal for all participants. The inferior visualization of the LGN on T1- and T2-weighted images was confirmed by the measurements of the signal-to-noise and contrast-to-noise ratios obtained for each image (Table 1). The mean LGN signal-to-noise ratio and the mean LGN-to–surrounding white matter tract contrast-to-noise ratios on T2-weighted turbo spin-echo, T1-weighted spin-echo, and resectioned T1-weighted magnetization-prepared rapid gradient-echo images were significantly smaller than those on proton density–weighted images (P < .001). As expected, the mean LGN-to-CSF contrast-to-noise ratio from those images was significantly greater than that obtained from proton density–weighted images (P < .001).
Quantitative evaluation of the SNR and CNR of the LGN (n = 16)
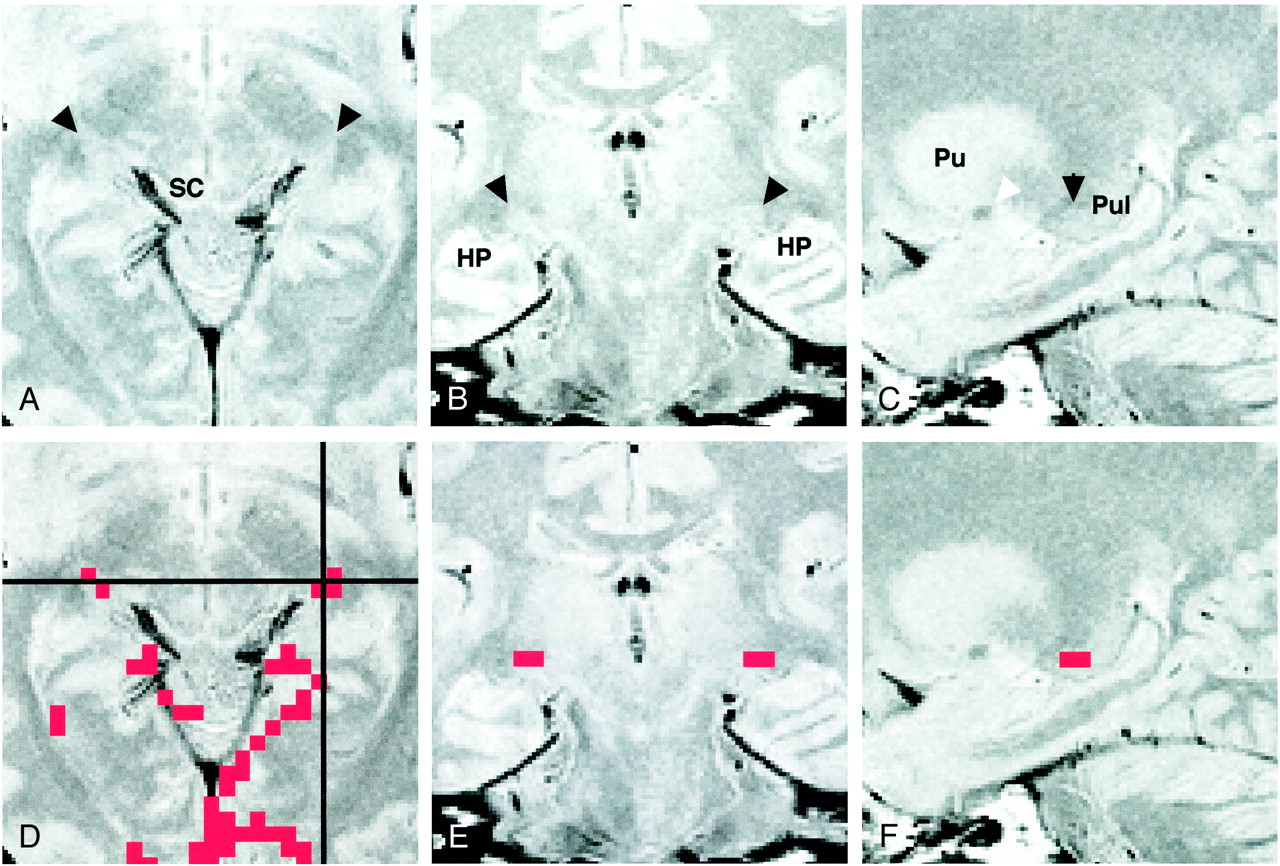
Figure 2 shows axial, coronal, and sagittal proton density–weighted images through the LGN, as well as the activation maps overlaid on each proton density–weighted image. The LGN was visible as a small triangular area on these images at the expected position: anterolateral and ventral to the pulvinar, medial to the optic radiation, and superomedial to the hippocampus. The medial margin of the LGN was indistinct on the coronal view (Fig 2B) because the rest of the thalamus, which might include the medial geniculate nucleus, had almost the same signal intensity as that of the surrounding tissue. The posterior margin of the LGN was unclear (Fig 2C) because the LGN appeared contiguous to the pulvinar.

Images of participant 7.
A, Proton density–weighted axial image (3000/14/2) obtained 4 mm inferior to the bicommissure line through the LGN (arrowheads). SC indicates the superior colliculus.
B, Proton density–weighted coronal image (3000/14/2), obtained through the LGN (arrowheads), corresponds to the horizontal black line in D. HP indicates the hippocampus.
C, Proton density–weighted left parasagittal image (3000/14/2) obtained through the LGN (black arrowhead) corresponds to the vertical black line in D. The white arrowhead indicates the anterior commissure. Pu indicates the putamen; Pul, pulvinar.
D, Axial activation map superimposed on a proton density–weighted image shows LGN activation of 2 and 3 pixels on the right and left sides, respectively.
E, Coronal image with superimposed activated pixels shown in D.
F, Activated pixels of the left LGN are projected and superimposed on the left parasagittal image.
In six of the eight participants, the LGN on both sides were visible only on one of the 16 axial proton density–weighted images of 3-mm thickness. This location corresponded to the section 4 mm inferior to the bicommissure line (−4-mm section), at the level of the superior colliculi. In the remaining two participants (Table 2, participants 4 and 6), the LGN on one side was visible only on the −4-mm section. However, for participant 4, the LGN on the other side was identified in the section obtained through the bicommissure line (0-mm section) and in the −4-mm section (Fig 3); for participant 6, the LGN was seen only in the −8-mm section.
LGN activation during visual stimulation for individual subjects (n = 8)

Images of participant 4.
A, Activation map superimposed on proton density–weighted image (3000/14/2) obtained through the bicommissure line. Of the eight participants, only this participant had LGN activation (arrowheads) shown on two sections (one activated pixel on each).
B, Activation map superimposed on proton density–weighted image (3000/14/2) obtained 4 mm inferior to the bicommissure line. Activated pixels (arrowheads) are shown: two on the right side, and one on the left side. Note the asymmetric appearance of the posterior region of the brain, as seen clearly in the margins of the tentorial notch.
Functional Study
In all participants, activation of the calcarine cortex and activation in the associated visual areas of the occipital lobe were observed. As for the thalamus, no activation was detected in areas other than the LGN. Table 2 summarizes the number of pixels, the percentage BOLD signal change, and the center-of-mass location of LGN activation for each participant. LGN activation was successfully detected at the expected location in 13 of 16 LGNs under postprocessing conditions of a correlation coefficient >0.3 and a 2-or-more pixel cluster size. For these cases, the correspondence of the functionally identified LGN with the anatomically identified LGN on proton density–weighted images was excellent (Figs 1 and 2).
For the detection of activation of the remaining three LGNs, slightly modified postprocessing procedures were required as follows: in two participants (participants 5 and 8), the LGNs on both sides were anatomically identified on the −4-mm proton density–weighted images, but LGN activation of 2 or more pixels was detected on only one side on the corresponding −4-mm activation map. For both of these participants, LGN activation of 1 pixel on the contralateral side was found before the application of the 2-pixel clustered filter. When the threshold value of the cross-correlation coefficient was reduced slightly to >0.28 (P < .002), LGN activation of the 2-pixel cluster was detected at a location corresponding to the anatomically identified LGN. For one participant (participant 4), the left LGN seemed to be located between the 0-mm section and the −4-mm section, as stated previously. On the activation map for this participant obtained before the application of the cluster filter, we detected 2-pixel cluster activation in the right LGN on the −4-mm section but only 1 pixel activation in the left (Fig 3). On the 0-mm section, we found on each side 1 activated pixel, which was spatially contiguous to the activated pixels of the LGN on the −4-mm section. For participant 4, the numbers of pixels in each area of LGN activation were calculated as a summation of the activated pixels on these sections. Because of the possibility that spatially contiguous activated pixels of the LGN were present in different sections, we reviewed the activation map before the application of the cluster filter for all individual participants. However, except for participant 4, no other cases were found. Finally, we evaluated the possible BOLD effects from the draining veins (15, 16); however, the pixels showing LGN activation did not contain any pixel corresponding to a large vein, in particular the basal vein of Rosenthal running through the ambient cistern adjacent to the LGN.
The slightly modified postprocessing procedures for the above three LGN allowed us to detect bilateral LGN activation of 2–3 pixels for all participants, as summarized in Table 2. For all 16 LGNs, the mean number of activated pixels was 2.4 ± 0.3 pixels, and the mean BOLD signal change was 2.2 ± 0.3%. No statistically significant difference between right and left LGN activation existed. The point-to-point comparison of CSF spaces around the posterior region of the thalamus between the T2*-weighted functional images obtained with a 64 × 64 matrix and the T2-weighted anatomic images obtained with a 256 × 256 matrix revealed that the mean image mismatch was only 0.6 pixels (0.47 mm); this value seems to lie within the measurement error of the different matrix sizes. For all 16 LGNs, the coordinates of the position (in mm) of the mean center of mass of LGN activation area were x = 22.8 ± 0.5, y = ±23.6 ± 0.9, and z = ±4.1 ± 0.6, where the x coordinate (left-to-right direction) is represented as an absolute value. No statistically significant difference between the coordinates of the right and left LGN activation was found.
Discussion
The LGN serves as a relay station in the projection of the visual pathway to the striate cortex. The microscopic structure of the LGN is characterized by a series of alternating gray matter and white matter layers. The primate LGN is a six-layered structure, with two subdivisions of four dorsal parvocellular layers and two ventral magnocellular layers. Functionally, these two subdivisions are associated with different aspects of vision. The former is involved mainly in the perception of form and color, and the latter, in the perception of movement and depth (17). With neuroophthalmologic tests, LGN lesions may be distinguished clinically from optic tract lesions according to the preservation of the pupillary response, which indicates that a small number of optic tract axons to the midbrain are intact. LGN lesions may cause a characteristic sector or wedge-shaped pattern of homonymous visual defect (18, 19). However, a completely homonymous visual defect can occur elsewhere in the retrochiasmatic pathway, and precise localization of retrochiasmatic lesions is therefore often difficult without the aid of neuroimaging techniques.
Although investigators have described pathologic conditions of the LGN in reports of recent MR imaging studies (19–23), they have been mostly discussed as a subsidiary issue in relation to optic tract lesions, such as wallerian degeneration and periventricular leukomalacia. To our knowledge, only one report concerning MR imaging of the normal LGN exists in the radiology literature. Horton et al (1) reported the superior quality of proton density–weighted images for the depiction of the LGN. Their study was performed before the advent of fast spin-echo techniques; a conventional spin-echo sequence was used, and two-to-four signal averaging was required to obtain adequate image quality. This technique resulted in long imaging times of 10 min. As per current routine clinical practice, we used a turbo spin-echo sequence for proton density– and T2-weighted contrast; this sequence enabled us to obtain images of almost the same quality, with an acceptable imaging time.
The LGN is surrounded by a number of white matter tracts, including its own afferent (optic tract) and efferent (optic radiation) fibers, as well as the posterior limb of the internal capsule. Signal intensity differences between the LGN and white matter tracts are expected to be small because of the manifold myelinated fibers within the LGN. Therefore, to delineate the LGN, maximization of signal intensity differences is thought to be crucial. In this study, the mean contrast-to-noise ratios of the LGN compared with surrounding white matter tracts were greatest with the proton density–weighted images. Considering that all the pulse sequences used for the anatomic study were set to have almost the same imaging time of approximately 5 min, proton density–weighted turbo spin-echo images are considered to be the most time-efficient images for the anatomic identification of the normal LGN outlined by the white matter tracts. The LGN and CSF were of almost the same signal intensity on the proton density–weighted images, whereas all other images had sufficient LGN-to-CSF contrast. However, the lateral extension of the ambient cistern beyond the medial geniculate nucleus was not consistently visible on axial sections, even with T1 and T2 weighting (Fig 1). Therefore, the identification of the ambient cistern was not useful in outlining the LGN, although it may be effective in older participants with larger CSF spaces.
Horton et al (1) noted that optimal plane settings are essential for imaging the LGN. In their study, the optimal imaging plane for axial orientation was determined to be parallel to the line through the genu of the corpus callosum and the superior colliculi, on the basis of imaging study findings in isolated brain specimens. However, it seemed that this plane could not be accurately reproduced in a clinical setting because of the relatively large size of the landmarks. Furthermore, it is well known that an isolated brain, unsupported by the surrounding CSF and meninges, becomes seriously distorted, primarily because of the influence of gravity.
In standard textbooks of anatomy of the human brain, the LGN can be seen in axial orientation in a section through the superior colliculi (24, 25). Because of the proximity of the LGN to the superior colliculi, the LGN is expected to be visible on an axial section obtained through the superior colliculi, either parallel to the bicommissure line or slightly inclined relative to this line, as noted by Horton et al (1). In our study, we used the standard axial imaging plane parallel to the bicommissure line, and 14 of the 16 LGNs were localized on only the −4-mm section at the level of the superior colliculi. The remaining two LGNs were seen on the adjacent superior and inferior sections; this result may have been caused by the difficulty of setting symmetric imaging planes because of individual anatomic variability, as shown in Figure 3.
In this study, all LGN activation detected with functional MR visual stimulation was correctly superimposed on the LGN that was anatomically identified on proton density–weighted images. This finding suggests that the correspondence between the localization of the functionally and anatomically identified LGN is excellent, despite possible individual anatomic variability. The mean x, y, and z coordinates of the center of mass of LGN activation were within the extent of the LGN depicted in a standard neuroanatomy atlas that showed the detailed structures of the thalamus of an isolated brain specimen (26). The mean number of activated pixels of 2.4 corresponds to an area of 23 mm2, which is compatible with a human LGN diameter of 4 to 6 mm (2). This value is within the range of 4-T functional MR imaging results that indicate an area of 21 mm2, with a higher in-plane resolution and the same section thickness (6), as well as an area of 38 mm2 with lower effective in-plane resolution and a thicker section (4). In our study, the mean BOLD signal change of 2.2%, with a TE of 70 ms at 1.5 T, was similar to that obtained with a TE of 25 ms at 4 T (6), despite the difference of the static magnetic field strength. This finding may be explained by the similar T2* sensitivities, corresponding to the static magnetic field strength multiplied by the TE, in addition to the similar sizes of LGN activation, although the increase in the signal-to-noise ratio and BOLD contrast-to-noise ratios at higher field strengths may be beneficial (27).
Our anatomic-functional MR imaging results did not show any activation in the thalamus other than the LGN, as noted in similar studies of the human brain at 2 T (5) and the monkey brain at 4.7 T (7). However, a functional MR imaging study at 4 T in humans (4) revealed simultaneous activation of the pulvinar with the LGN during visual stimulation. The role of the pulvinar is largely unknown, although its major inputs come from parts of the visual system, and some evidence suggests that it is involved in visual perception or attention (28, 29). Because the pulvinar is close to the LGN, as shown in Figure 2C, we think that further anatomic-functional correlation with more complicated visual testing is required to explain this discrepancy.
In any functional MR imaging experiment, the locations of activation must first be verified on anatomic images. T1-weighted anatomic images are conventionally used for this purpose, and the activation maps are superimposed on them, because T1-weighted images provide adequate delineation of cortical anatomy and they are readily obtained at sufficient spatial resolution. As illustrated in our study of the anatomic delineation of the LGN, most T1- and T2-weighted images provide little distinction between individual thalamic structures, because the thalamus has a large amount of white matter interspersed between and within the various gray matter nuclei. Hence, on MR images, the thalamus generally has an appearance between that of gray matter and white matter (30). The superior quality of proton density–weighted images has been shown for the visualization of other thalamic structures, such as the mamillothalamic tract (30, 31), as well as for the visualization of the LGN. Therefore, if the main objective concerns the details of activation in parts of the thalamus, proton density–weighted images may be recommended as the most suitable anatomic images on which the locations of functional MR activation should be superimposed.
Conclusion
Functional MR imaging based on BOLD contrast is considered to be the best approach for detecting and distinguishing activation in small nuclei deep in the brain. Together with its excellent soft-tissue contrast, MR imaging is the only technique that can be used noninvasively to identify both anatomy and function of the thalamic nuclei. Our study revealed an excellent correspondence between anatomy and function of a small thalamic nucleus with use of a clinical 1.5-T MR imager. These findings may represent a forward step in the search for functional MR brain mapping in our current clinical environment.
Footnotes
1 Address reprint requests to Norihiko Fujita, MD, Department of Radiology, Osaka University Medical School, 2-2, Yamadaoka, Suita, Osaka 565-0871, Japan.
References
- Received September 12, 2000.
- Accepted after revision April 30, 2001.
- Copyright © American Society of Neuroradiology
In this issue


Jump to section
Related Articles
Cited By...
- Differential cortical and subcortical visual processing with eyes shut
- Visualization of the Medial and Lateral Geniculate Nucleus on Phase Difference Enhanced Imaging
- On the Role of Suppression in Spatial Attention: Evidence from Negative BOLD in Human Subcortical and Cortical Structures
- An Investigation of Lateral Geniculate Nucleus Volume in Patients With Primary Open-Angle Glaucoma Using 7 Tesla Magnetic Resonance Imaging
- Quantification of the Human Lateral Geniculate Nucleus In Vivo Using MR Imaging Based on Morphometry: Volume Loss with Age
- Atrophy of the lateral geniculate nucleus in human glaucoma detected by magnetic resonance imaging