
Abstract
BACKGROUND AND PURPOSE: In subjects performing no specific cognitive task (“resting state”), time courses of voxels within functionally connected regions of the brain have high cross-correlation coefficients (“functional connectivity”). The purpose of this study was to measure the contributions of low frequencies and physiological noise to cross-correlation maps.
METHODS: In four healthy volunteers, task-activation functional MR imaging and resting-state data were acquired. We obtained four contiguous slice locations in the “resting state” with a high sampling rate. Regions of interest consisting of four contiguous voxels were selected. The correlation coefficient for the averaged time course and every other voxel in the four slices was calculated and separated into its component frequency contributions. We calculated the relative amounts of the spectrum that were in the low-frequency (0 to 0.1 Hz), the respiratory-frequency (0.1 to 0.5 Hz), and cardiac-frequency range (0.6 to 1.2 Hz).
RESULTS: For each volunteer, resting-state maps that resembled task-activation maps were obtained. For the auditory and visual cortices, the correlation coefficient depended almost exclusively on low frequencies (<0.1 Hz). For all cortical regions studied, low-frequency fluctuations contributed more than 90% of the correlation coefficient. Physiological (respiratory and cardiac) noise sources contributed less than 10% to any functional connectivity MR imaging map. In blood vessels and cerebrospinal fluid, physiological noise contributed more to the correlation coefficient.
CONCLUSION: Functional connectivity in the auditory, visual, and sensorimotor cortices is characterized predominantly by frequencies slower than those in the cardiac and respiratory cycles. In functionally connected regions, these low frequencies are characterized by a high degree of temporal coherence.
Time-series data from MR imaging of functionally related regions of the brain show a high degree of temporal coherence of low-frequency fluctuations (1–6). Phase coherence of blood flow fluctuations between anatomically different but functionally related regions implies neuronal connections or functional connectivity between these regions. Functional connectivity has been reported in portions of the sensorimotor, auditory, and visual systems. These synchronous fluctuations may represent changes in local blood flow secondary to fluctuations in firing rates within large distributed neural networks (1). Functional connectivity has been shown in subjects performing no specific cognitive task (“resting state”) and in subjects performing tasks that did not activate regions in which functional connectivity was measured (7).
In the resting state, functional connectivity MR (fcMR) imaging, a map of the temporal correlations of MR signal time courses, is computed by specifying a region of interest (ROI) in a functional area and cross-correlating it with all other voxel time courses in the brain. Unlike conventional functional MR (fMR) imaging, no specific task is prescribed for the subject. The fcMR study provides a new way to measure the interdependency of brain regions and assess the strength of neuronal connections.
Although the feasibility of fcMR has been shown, functional connectivity is incompletely characterized, and fcMR methods are not yet optimized. The frequencies at which physiological fluctuations can be detected have not been thoroughly investigated. In many studies, low sampling rates were employed in acquisition of echo-planar images, which might fail to characterize respiratory and cardiac frequencies. For example, at a sampling interval of TR = 2 s, the frequency bands 0.4–0.6 Hz and 0.9–1.1 Hz will appear artifactually (because of bulk motion and fluctuations in signal intensity reflecting cardiac or respiratory cycles) in the low-frequency range (<0.1 Hz). Simulation of low-frequency fluctuations by such “aliasing” of cyclic changes at the respiratory or cardiac rate has not been excluded. Therefore, the specificity of the functional connectivity map has been questioned. The use of low-pass filters in some studies has reduced physiological noise sources but also has obscured any frequency-specific information in those noise sources (3). The power spectrum of voxel time courses has been analyzed (8), but, because the power spectrum contains no phase information, this analysis cannot measure the contribution of each frequency in a voxel time course to the overall fcMR map. For example, two voxel time courses with identical power spectra can be uncorrelated. Also, the frequency content in a voxel time course defines the degrees of freedom. Choosing an ROI that contains voxel time courses with drastically different degrees of freedom can lead to less specific fcMR maps.
The purpose of this study was to calculate the contribution of each frequency to resting-state cross-correlation maps. Multislice acquisitions with a rapid sampling rate (TR, 400 ms) were used to eliminate or reduce aliasing. To measure the contribution of the frequency to the cross-correlation coefficient, we use an established expression for the spectral distribution of the cross-correlation coefficient (6). The spectral analysis of the correlation coefficient shows which frequencies contribute to interregional functional connectivity. We hypothesized that, on average, only frequencies less than 0.1 Hz contribute significantly to interregional functional connectivity, and respiratory and cardiac noise contribute minimally to fcMR maps. We calculated the spectral compositions for auditory, visual, and sensorimotor tasks in a series of volunteers. To our knowledge, functional connectivity has not been analyzed in this way.
Methods
Four volunteers, aged 20 to 25 years and claiming to be in good health with no history of neurologic illness, were recruited as participants for the fMR experiment. Consent was obtained according to institutional guidelines.
Each subject underwent the same series of scans performed with a 1.5-T commercial MR scanner equipped with high-speed gradients and a standard birdcage head coil. Head stabilization and motion control were achieved by using foam pads. First, high-resolution, whole-brain anatomic images were obtained with 2D multislice, spin-echo sequences (coronal plane, 20 slices, 256 × 128 matrix, TR/TE of 500/8, field of view of 24 cm, slice thickness of 7 mm, and interslice gap of 2 mm). In addition, a 3D spoiled gradient-recalled whole-brain–volume scan was acquired (axial plane, 124 slices, 256 × 128 matrix, TR/TE of 21/7, flip angle of 40°, field of view of 24 cm, slice thickness of 1.1 mm, and no gap). For conventional task-activation fMR imaging, a series of 148 time frames was acquired with single-shot gradient-recalled echo-planar imaging in the coronal plane (20 slices, 64 × 64 matrix, flip angle of 82°, TR/TE of 2000/50, field of view of 24 cm, receiver bandwidth of 125 kHz, slice thickness of 7 mm, and interslice gap of 2 mm). For the resting-state fcMR imaging studies, the technical acquisition parameters were the same, except the TR was reduced to 400 ms with a 50° flip angle, allowing four slices to be scanned, and the number of time frames was increased to 1300 to achieve a reliable statistic. In each echo-planar imaging series, the images belonging to the first four (for fMR) or 20 (for fcMR) time frames were discarded because the MR signal was not stationary. Voxel dimensions were 3.75 × 3.75 × 7 mm3 (x, y, z). The cardiac and respiratory rates were recorded using a pulse oximeter and a flexible respiratory belt.
For fMR (“task-acquisition”), the subject performed a specific task for four 32-second periods, each separated by 32-second periods of rest. Each volunteer performed each of three tasks: listening to narrated text, viewing of a strobe light, and finger tapping. For the auditory task, the subject listened to a recorded text by air-driven headphones. For visual cortex activation, the subject viewed a strobe light with flashing frequency of 8 Hz. The finger-tapping task was self-paced, bilateral apposition of the thumb and other fingers in a sequential pattern.
For the fcMR (“resting acquisition”), the subject was instructed to rest, be as motionless as possible, keep eyes closed, and perform no specific cognitive exercise during the entire scan. fcMR imaging was performed after the fMR imaging.
The echo-planar raw data were filtered in the spatial frequency domain with a low-pass Hamming filter to increase the signal-to-noise ratio (9). Images were checked for motion by using a 3D registration program included in AFNI (Robert Cox, Medical College of Wisconsin). All subjects had less than 0.4-mm maximum displacement in x, y, or z. Motion correction of echo-planar data was not performed because all motion-correction algorithms tend to increase spatial correlations to an unknown degree.
For fMR, the time course was analyzed with a locally developed program (10, 11). A least-squares fitting algorithm was used to compare the observed data on a voxel-by-voxel basis against a constant (baseline signal intensity), a ramp (signal drift), and a boxcar function (idealized expected response to the task or stimulus). The boxcar function had a unit amplitude and a period that matched the on/off cycles of the task or stimulus, smoothed by convolution with a Poisson function (with a 6-second mean) to account for hemodynamic delay. The amplitude and the uncertainty of the fit to the boxcar reference function were calculated by least-squares minimization. A t score was calculated and converted to a z score. An overall adjusted P value was determined to address levels of significance. All voxels with P < .001 were merged with coregistered anatomic images.
For fcMR imaging, ROIs consisting of 2 × 2 “seed” voxels were selected in the primary auditory cortex, striate cortex, or in the Rolandic cortex by referring to the maximum task activation seen in the fMR for each of the tasks. For comparison, several other seed voxels were selected in other regions where functional connectivity was not anticipated and where the cardiac and respiratory effects were expected. These regions were in the right internal carotid artery, the left internal jugular vein, and in the cerebrospinal fluid (left lateral ventricle). The correlation coefficients of the seed voxels and every other voxel within the four slices of the brain were calculated.
A nonparametric, multiple-comparisons procedure was used to compute the statistical significance of fcMR maps (12, 13). To arrive at a null statistic for resting-state data, the time course of the seed voxel or cluster was altered by randomization of the phase of its complex Fourier components, an approach that does not change the power spectrum. The null distribution of correlation coefficients for a particular seed voxel or cluster then was obtained by calculating all possible cross-correlation coefficients between the seed voxel after phase randomization and all other voxels in the brain. This approach assigned an overall adjusted P value to each cross-correlation value, when carried out for each seed voxel or cluster. All fcMR maps then were subjected to a P = .005 threshold. The corresponding cross-correlation coefficients (using 1300 time frames) were in the range of 0.5–0.8, depending on the seed voxel or cluster. The degrees of freedom of the seed voxel or cluster were computed by Friston's method (14). Voxels correlating significantly were merged with anatomic images. The locations of the voxels in the fcMR were compared with the location of task activation in the fMR.
The average frequency spectrum of the correlation coefficients was computed for each fcMR map by expressing the voxel time courses in terms of their inverse Fourier transforms and calculating the cross-correlation coefficient in frequency (ie, Fourier) space. The expression for the contribution of the nth frequency to the total correlation coefficient (cc) is: such that
  where ωn and λn are the complex frequencies of the voxel-time courses of the seed voxel f(t) and voxel g(t), n∈[0,N-1], and N is the number of discrete time points. The term n = 0 does not contribute to cc because the mean has been removed from f(t) and g(t). The denominator D represents a normalization factor (for details see [6]). To address the spectral distribution of the cross-correlation coefficient in a fcMR map, the average value <ccn> is computed by using all voxel time courses that give significant correlations with a P value of ≥.005.
Results
In the fMR experiments, significant activations at the P = .001 level were found bilaterally in the superior temporal lobe and insular region (passive text-listening task), in the striate cortex (visual task), the somatosensory cortex, and the supplementary motor area (SMA) and dentate nuclei of the cerebellum (motor task). These regions of activations were very consistent in all subjects.
For the fcMR resting-state maps, all subjects showed fairly symmetrical functional connectivity across hemispheres at a P value of .005 for the motor, auditory, and visual regions. The fcMR maps resembled closely the fMR task-activation pattern. However, some voxels of the fcMR maps did not match those of the task-activation maps, even after adjusting the threshold. For example, no functional connectivity between the somatosensory cortex and the dentate nuclei in the cerebellum was found, although both areas were activated in the motor task. In general, fcMR maps appeared to be noisier than fMR maps, indicating non-stationary fluctuations in the data. However, the appearance of the maps was similar between individuals. Increasing the threshold of the fcMR maps to equalize the P values between task-activation and resting-state maps reduced the noise in the images but also reduced the extent of the spatial maps.
Figures 1–4 show typical examples of task-activation maps and resting-state fcMR maps for four contiguous slices. Auditory cortex activation and functional connectivity showed very similar spatial distributions across different slices (Fig 1). The fcMR maps did not vary markedly as the ROI was moved within the region of activation in the superior temporal gyrus. Activation in the striate cortex also showed close resemblance to the resting-state fcMR map (Fig 2). The fcMR map proved also to be fairly robust when the seed voxels were moved within the primary visual cortex. Similarly, somatosensory activation and the corresponding resting-state fcMR map showed close resemblance between left and right hemispheric symmetry (Figs 3 and 4). However, more of the SMA was identified in the fcMR than in the task activation from finger tapping. In general, voxels selected randomly outside regions that were activated by a task showed no significant correlation with voxels in the sensorimotor, auditory, and visual regions.

Consecutive coronal fMR maps of voxels activated by a text-listening task (top) and of the voxels functionally connected with a 2 × 2-seed voxel ROI (crosshairs) within the auditory cortex during resting-state (bottom). Task activation is evident in the region of the primary and association auditory cortices in the superior temporal lobe. Many of the voxels functionally connected with the seed voxels in the left auditory cortex (crosshairs) have a similar distribution. All maps are representative and are from a single subject. The color scale for the task-activation map refers to z scores (red z, 3.5; yellow z, 5.5), and that for the resting-state map refers to correlation coefficients (red, 0.5; yellow, 0.7). The MR pulse sequence parameters are 2000/50/82 (TR/TE/flip angle) for fMR and 400/50/50 for fcMR.fig 2. Consecutive coronal images showing task activation for the visual task (top) and connectivity for the visual cortex in resting-state (bottom). The task produces activation in the striate cortex region. The voxels with connectivity to the seed voxel (crosshairs) appear to lie in similar locations in the striate cortex region. The color scale for the task-activation map refers to z scores (red z, 3.5; yellow z, 5.5), and that for the resting-state map refers to correlation coefficients (red, 0.6; yellow, 0.8). The MR pulse sequence parameters are as in figure 1.fig 3. A selected coronal fMR map of voxels activated by the bilateral finger-tapping task (top) and of voxels functionally connected to an ROI of 2 × 2-seed voxels (crosshairs) in the sensorimotor cortex in a resting acquisition (bottom). The sensorimotor cortex is identified in both the fMR and the fcMR imaging. Not shown are voxels within the dentate nucleus of the cerebellum that were identified with fMR but not with the functional connectivity study. The color scale for the task-activation map refers to z scores (red z, 3.5; yellow z, 5.5), and that for the resting-state map refers to correlation coefficients (red, 0.62; yellow, 0.8). The MR pulse sequence parameters are as in figure 1
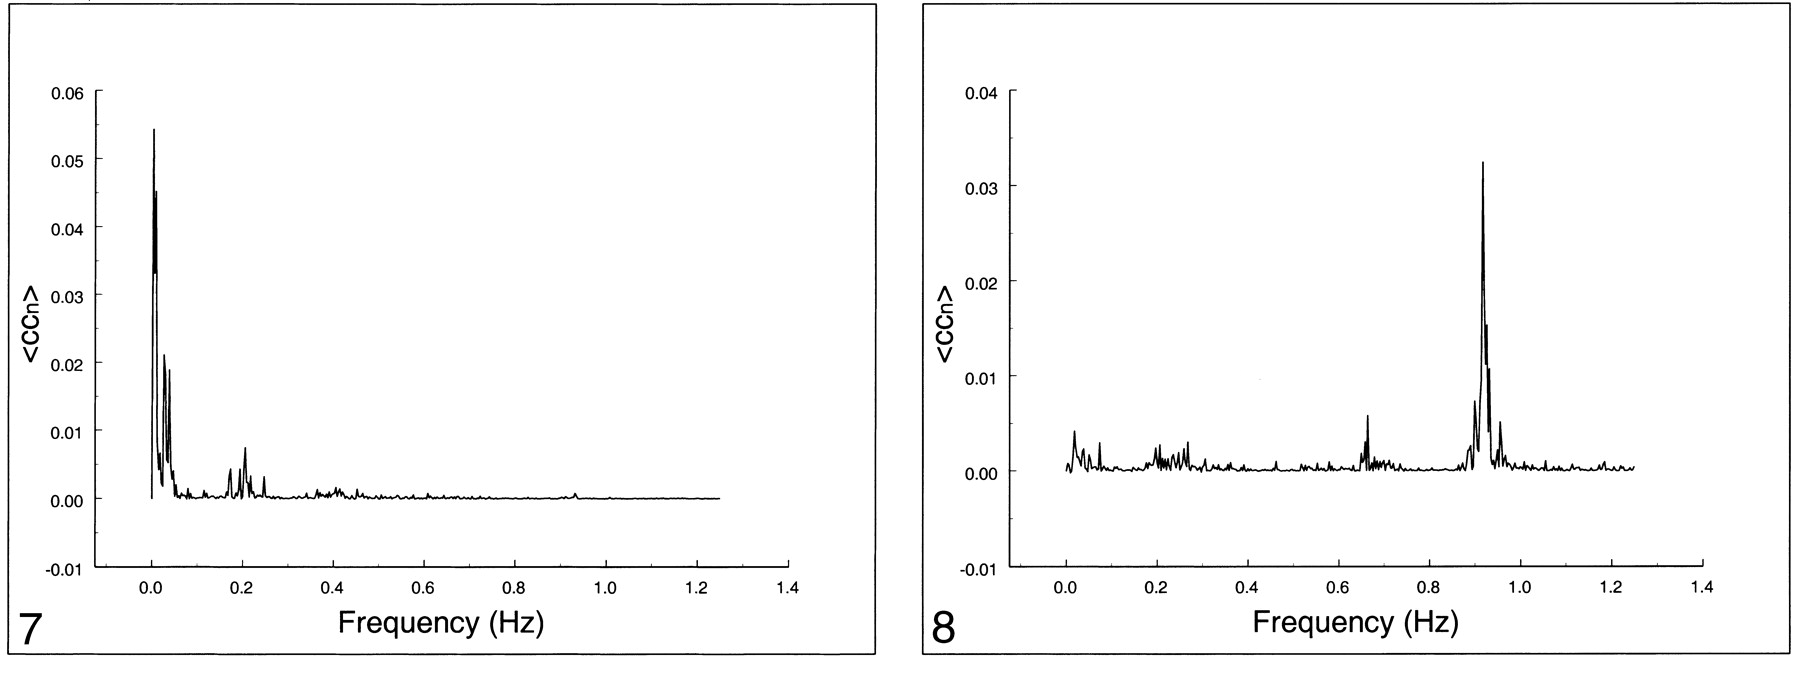
In Figures 5–7, the spectral distribution of the cross-correlation coefficient is shown for auditory, visual, and motor resting-state fcMR maps. For functional connectivity of the auditory cortex (Fig 5) or visual cortex (Fig 6), only low frequencies (<0.1 Hz) contributed to the correlation coefficient. The respiratory rate and cardiac rate were recorded in the 0.18–0.25 Hz and 0.9–1.1 Hz ranges, respectively. Contribution from respiratory and cardiac noise sources was virtually absent. Motor cortex functional connectivity (Fig 7) also had dominant contributions from low-frequency fluctuations. Small effects of respiratory contributions were visible at 0.2 Hz (fundamental frequency) and 0.4 Hz (first harmonic). The cardiac contribution at 0.93 Hz was extremely small.

A selected axial fMR map of voxels activated by the bilateral finger-tapping task (top) and of the voxels functionally connected to an ROI of 2 × 2-seed voxels (crosshairs) in the sensorimotor cortex in a resting-state acquisition (bottom). The sensorimotor cortex is identified in both the fMR and the fcMR maps. The SMA is not activated by the paradigm, but connectivity is clearly seen. The color scale for the task-activation map refers to z scores (red z, 3.5; yellow z, 5.5), and that for the resting-state map refers to correlation coefficients (red, 0.62; yellow, 0.8). The MR pulse sequence parameters are as in figure 1

Spectral analysis of the average correlation coefficient for interregional connectivity in the auditory cortex (same subject illustrated in figure 1). Only frequency components between 0 and 0.05 Hz contribute significantly to the correlation coefficient.fig 6. Spectral analysis of the average correlation coefficient for interregional connectivity in the striate cortex (same subject illustrated in figure 2). Only frequency components less than 0.05 Hz contribute significantly to the correlation coefficient

Spectral analysis of the average correlation coefficient for interregional connectivity in the motor cortex (same subject illustrated in figure 3). Only the same low-frequency components contribute significantly to the correlation coefficient.fig 8. Spectral analysis of the average correlation coefficient obtained using a seed voxel in the right internal carotid artery. Low frequencies do not predominate. The main peak occurs at the cardiac frequency (0.93 Hz); the first harmonic is aliased to 0.65 Hz. A respiratory band is seen at 0.2 Hz
The frequency spectrum of seed voxels in the left internal carotid artery showed dominant peaks at the cardiac frequency at 0.93 Hz and its first harmonic, aliased at 0.65 Hz (Figs 8–10). Low-frequency contributions and respiratory effects were small. For seed voxels in the left internal jugular vein, mostly respiratory and low frequency bands were visible as well as some cardiac contributions. Seed voxels representing cerebrospinal fluid showed many frequency bands across the whole spectrum, mostly arising from respiratory and cardiac pulsations.
Figure 11 compares the relative contribution to the total cross-correlation coefficient of three different frequency ranges (low frequencies, 0–0.1 Hz; respiratory frequencies, 0.1–0.5 Hz; and cardiac frequencies, 0.6–1.1 Hz). Low frequencies contributed more than 90% to fcMR maps for auditory and visual connectivity and 75% for motor connectivity. For seed voxels in arteries, veins, or cerebrospinal fluid, the dominant contributions were either from cardiac pulsations (70% for artery, 35% for cerebrospinal fluid) or from respiratory effects (50% for veins) but less from low-frequency fluctuations.

Spectral analysis of the average correlation coefficient from a seed voxel in the left jugular vein. Note the spread over many frequencies up to 0.4 Hz and the cardiac peaks at 0.93 Hz and 0.65 Hz.fig 10. Spectral analysis of the average correlation coefficient obtained using a seed voxel in the left ventricle. Note the spread over many frequencies. The cardiac bands show a large spread compared with other tissue. Low-frequency peaks are visible at 0.03 Hz

Contribution of low frequencies (0 to 0.1 Hz), respiratory frequencies (0.1 to 0.5 Hz), and cardiac frequencies to the cross-correlation coefficient in different ROIs in the same subject. Low-frequency components clearly dominate, contributing to functional connectivity in auditory, visual, and motor cortices. For blood vessels and cerebrospinal fluid, low-frequency components are present, but cardiac and respiratory noise sources are the main contributors
Discussion
The present study shows that the major frequency contributions to resting-state functional connectivity come from fluctuations less than 0.1 Hz. These fluctuations occur synchronously in functionally connected regions. Physiological noise sources, such as respiratory or cardiac pulsations, contribute little to the cross-correlation coefficient. Functionally connected regions can be identified by resting-state fcMR imaging of auditory, visual, and sensorimotor cortices.
Our method of analysis characterizes the frequencies that contribute to resting-state multislice correlation maps. Combining a sufficiently high sampling rate (TR, 400 ms) that still allows multislice imaging with a method to separate the cross-correlation maps into frequency components, we can resolve the fundamental and first-harmonic frequencies of respiratory and cardiac noise sources. The fundamental frequency and first harmonic of the respiratory cycle occur at about 0.25 and 0.5 Hz, respectively. The cardiac rate appears around 0.9 Hz, whereas the first harmonic is aliased to 0.65 Hz. We observed only minor variations depending on the subject. The recorded pulse oximeter rates varied by ±3 beats per minute and agreed well with the extent of the frequency bands in the MR data. Therefore, none of the physiological noise sources aliased into the low-frequency range (≤0.1 Hz) thought to be responsible for functional connectivity. All physiological noise sources can be identified easily.
For visual, somatosensory and auditory cortex, the separation of the fcMR maps into frequency components reveals that low-frequency fluctuations contribute much more to the correlation coefficient than do any respiratory or cardiac noise sources. For example, in functional connectivity of the auditory and visual cortices, low-frequency fluctuations contribute more than 90%; in the motor cortex, they contribute more than 85% in a typical subject. Other subjects show similar and sometimes even higher contributions of low-frequency fluctuations. Contaminations of the cross-correlation coefficient from cardiac pulsations counting all frequencies between 0.6 and 1.1 Hz are less than 5% in all subjects (average, 3%). Respiratory contamination between 0.1 and 0.5 Hz is as high as 20% in a single subject. On average, across all subjects, respiratory effects are about 15%. This finding strongly suggests that low-frequency fluctuations in functionally connected brain regions have a high degree of temporal correlation. Our finding is consistent with other reports in which low-frequency fluctuations less than 0.1 Hz in functionally related brain regions showed a high degree of temporal correlation.
The frequency spectrum from the large blood vessels or cerebrospinal fluid has very different features. Here, low-frequency contributions are small, and respiratory and cardiac components dominate. For example, seed voxels from the internal carotid artery show an average 70% contribution from cardiac frequencies to the cross-correlation coefficient, whereas seed voxels from the jugular vein show significant contribution from respiratory frequencies. Seed voxels in cerebrospinal fluid show many different frequencies in the cross-correlation spectrum, mostly from respiratory and cardiac pulsations and less from low-frequency oscillations.
Spatial maps of task-induced fMR and resting-state fcMR imaging show many similarities. Functional cortices can be identified with both methods. However, fcMR is not intended to be a replacement for task-activated fMR. Temporal correlations in the resting state imply phase-locked neuronal activity in functionally related regions. Task-induced activation maps involve coordinated activity of several brain systems and might not reflect direct neuronal interconnections.
One limitation of our study is the potential bias in the selection of the seed voxels. The fcMR maps vary to some degree with the voxels chosen as seed voxels. For example, the respiratory band is seen clearly in Figure 7 (motor cortex) but less so in Figures 5 and 6, because of partial-volume effects. At a voxel size of 3.75 × 3.75 × 7 mm3, cerebrospinal fluid and large blood vessels might contribute to the MR signal depending on the location of the seed voxels. The contributions of large blood vessels and cerebrospinal fluid vary between voxels; thus the frequencies represented in individual voxels may vary. We reduced these biasing effects by calculating the autocorrelation function of each seed voxel time course and choosing seed voxels with similar degrees of freedom near a region showing maximum task activation in fMR imaging. The freedom to choose seed voxels on the basis of anatomic landmarks increased the chance of identifying regions with functional connectivity. Further studies are required to clarify the consistency and applicability of resting-state fcMR imaging. For future research, our method might be an important tool to probe the strength of cortical neuronal connections in healthy subjects and patients who suffer from disconnection syndromes (15–18).
Our data were derived using a high sampling rate to eliminate problems with aliasing of physiological noise sources. The limitation, compared with studies using low sampling rates, is that only four slices can be collected at a TR of 400 ms. The implication is that functional connectivity throughout the whole brain cannot be obtained with our sampling rate. Also, some aliasing of higher-order harmonics of the cardiac frequency still will occur, but the amplitudes of higher harmonics tend to decrease quickly with the order of the harmonic, and the contribution to the cross-correlation coefficient is expected to be negligible.
An interesting point of discussion is the possibility that non-task-induced functional connectivity might contribute to task-induced activation in a functional image. The fundamental frequency of the usual task paradigm (0.016 Hz) falls directly into the low-frequency band (<0.1 Hz) responsible for functional connectivity. We found in one subject that the fundamental frequency of task-induced activation in the primary auditory cortex had an amplitude 6.8 times greater than the resting-state low-frequency oscillation in the same region. Assuming perfect phase synchrony between the oscillations from functional connectivity and task-induced signal changes, we can hypothesize that functional connectivity might contribute about 15% to an activation map. However, it is unclear how much the amplitude of the low-frequency oscillations responsible for functional connectivity might change during the performance of a task and what the phase relationship is compared with the task-induced frequency. Further studies are needed to clarify this point.
Conclusion
The methods described herein quantify the contribution of low-frequency fluctuations and physiological noise to cross-correlation functional connectivity maps. Functional connectivity maps of auditory, sensory-motor, and visual cortices derived from resting-state data depend predominantly on low-frequency fluctuations and little on respiratory and cardiac noise sources when measured at a low TR. The functional organization of the cortex as revealed by fcMR closely resembles that shown by task-activation maps. Our observations indicate that low-frequency fluctuations are a general phenomenon in eloquent cortex. Therefore, fcMR imaging may be a useful method to evaluate the strength of neuronal connections in healthy individuals and in patients with neurologic disorders.
Footnotes
1 Address reprint requests to M. Elizabeth Meyerand, Ph.D., Department of Medical Physics, 1300 University Ave., 1530 MSC, Madison, WI 53706.
References
- Received July 17, 2000.
- Accepted after revision March 17, 2001.
- Copyright © American Society of Neuroradiology
In this issue


Jump to section
Related Articles
Cited By...
- The cerebellar components of the human language network
- Cognitive reserve linked to network-specific brain-ventricle coupling
- Temporal and Spatial Scales of Resting-state Human Cortical Activity Throughout Lifespan
- Large-scale Signal Propagation Modes in the Human Brain
- Functional divergence between the two cerebral hemispheres contributes to human fluid intelligence
- Precision fMRI reveals that the language network exhibits adult-like left-hemispheric lateralization by 4 years of age
- Theoretical proposal for restoration of hand motor function utilizing plasticity of motor-cortical interhemispheric interaction
- Younger adult brain utilizes interhemispheric strategy of recruiting ipsilateral dorsal premotor cortex for complex finger movement, but not aging brain
- Reliability of brain metrics derived from a Time-Domain Functional Near-Infrared Spectroscopy System
- Transient destabilization of whole brain dynamics induced by DMT
- Event Integration and Temporal Differentiation: How Hierarchical Knowledge Emerges in Hippocampal Subfields through Learning
- Exploring the neuronal and systemic physiological contributions to spontaneous cerebral fluctuations - Insights from functional MRI in The Maastricht Study
- Traumatic brain injury disrupts state-dependent functional cortical connectivity in a mouse model
- Event integration and temporal differentiation: how hierarchical knowledge emerges in hippocampal subfields through learning
- Model connectivity: leveraging the power of encoding models to overcome the limitations of functional connectivity
- Comparing data-driven physiological denoising approaches for resting-state fMRI: Implications for the study of aging
- Single Ventricle Reconstruction III: Brain Connectome and Neurodevelopmental Outcomes: Design, Recruitment, and Technical Challenges of a Multicenter, Observational Neuroimaging Study
- Optimizing network neuroscience computation of individual differences in human spontaneous brain activity for test-retest reliability
- Consolidation-dependent behavioral integration of sequences related to mPFC neural overlap and hippocampal-cortical connectivity
- Low-dimensional organization of global brain states of reduced consciousness
- Model-based whole-brain perturbational landscape of neurodegenerative diseases
- Data-driven discovery of canonical large-scale brain dynamics
- BOLD cofluctuation 'events are predicted from static functional connectivity
- Ultra-slow fMRI fluctuations in the fourth ventricle as a marker of drowsiness
- Callosal Fiber Length Scales with Brain Size According to Functional Lateralization, Evolution, and Development
- Callosal fiber length scales with brain size according to functional lateralization, evolution, and development
- The universal language network: A cross-linguistic investigation spanning 45 languages and 12 language families
- Differential tracking of linguistic vs. mental state content in naturalistic stimuli by language and Theory of Mind (ToM) brain networks
- Chemogenetic activation of Locus Coeruleus Noradrenergic Neurons Modulates the Default Mode Network
- Functional connectome of arousal and motor brainstem nuclei in living humans by 7 Tesla resting-state fMRI
- Brain stimulation boosts perceptual learning by altering sensory GABAergic plasticity and functional connectivity
- External drivers of BOLD signals non-stationarity
- Study on acupuncture in the treatment of painful diabetic peripheral neuropathy based on rs-fMRI: a protocol for systematic review and meta-analysis
- Developmental coupling of cerebral blood flow and fMRI fluctuations in youth
- Frequency-specific coactivation patterns in resting-state and their alterations in schizophrenia: an fMRI study
- Rare long-range cortical connections enhance information processing
- Predicting behavior through dynamic modes in resting-state fMRI data
- Neural dynamics of parametrically modulated human mechanical pain determined using whole-brain quantitative perfusion imaging
- Cingulo-opercular control network and disused motor circuits joined in standby mode
- Visual processing speed is linked to functional connectivity between right frontoparietal and visual networks
- Turbulent-like dynamics in the human brain
- Atlas55+: Brain Functional Atlas of Resting-state Networks for Late Adulthood
- Attention network modulation via tRNS correlates with attention gain
- Cingulo-Opercular Control Network Supports Disused Motor Circuits in Standby Mode
- Predicting Sex from Resting-State fMRI Across Multiple Independent Acquired Datasets
- Noise-driven multistability versus deterministic chaos in phenomenological semi-empirical models of whole-brain activity
- Modular and state-relevant connectivity in high-frequency resting-state BOLD fMRI data: An independent component analysis
- Dynamical Mechanisms of Interictal Resting-State Functional Connectivity in Epilepsy
- Altered Thalamocortical Connectivity in Six-Week Old Infants at High Familial Risk for Autism Spectrum Disorder
- Low variability of dynamical functional connectivity in cerebellar networks
- The Developing Human Connectome Project: typical and disrupted perinatal functional connectivity
- Data augmentation based on dynamical systems for the classification of brain states
- Dynamical informational structures characterize the different human brain states of wakefulness and deep sleep
- Studying the precuneus reveals structure-function-affect correlation in long-term meditators
- Predicting the fMRI signal fluctuation with echo-state neural networks trained on vascular network dynamics
- A robust deep neural network for denoising task-based fMRI data: An application to working memory and episodic memory
- Increased soluble amyloid-beta causes early aberrant brain network hypersynchronisation in a mature-onset mouse model of amyloidosis
- No evidence for functional distinctions across fronto-temporal language regions in their temporal receptive windows
- A dynamical systems framework to uncover the drivers of large-scale cortical activity
- Early maltreatment experience increases resting-state functional connectivity in the theory of mind (ToM) network
- The (dis)similarities between neural networks based upon functional connectivity, representational similarity, and univariate analyses
- Group ICA for Identifying Biomarkers in Schizophrenia: 'Adaptive Networks via Spatially Constrained ICA Show More Sensitivity to Group Differences than Spatio-temporal Regression
- Hyperconnectivity of the default mode network in multiorgan dysfunction syndrome
- Modular preprocessing pipelines can reintroduce artifacts into fMRI data
- Interaction information along lifespan of the resting brain dynamics reveals a major redundant role of the default mode network
- Assessment of Functional Connectome Construction Strategies in Neurodegeneration
- Interhemispheric Integration for Complex Behaviors, Absent the Corpus Callosum in Normal Ontogeny
- Study on Linear Combination of Long Memory Processes Corrupted by Additive Noises for fMRI Time Series Analysis
- What the structural-functional connectome reveals about brain aging: The key role of the fronto-striatal-thalamic circuit and the rejuvenating impact of physical activity
- Domain-general brain regions do not track linguistic input as closely as language-selective regions
- The processing of dynamic faces in the human brain: Support for an integrated neural framework of face processing
- The Neuro Bureau ADHD-200 Preprocessed Repository
- Assessing Variations in Areal Organization for the Intrinsic Brain: From Fingerprints to Reliability
- Disruption of periaqueductal grey-default mode network functional connectivity predicts persistent post-traumatic headache in mild traumatic brain injury
- Functional connectivity networks with and without global signal correction
- Abnormal Low-Frequency Oscillations Reflect Trait-Like Pain Ratings in Chronic Pain Patients Revealed through a Machine Learning Approach
- Functional connectivity disturbances of the ascending reticular activating system in temporal lobe epilepsy