
Abstract
BACKGROUND AND PURPOSE: Reconstruction of first-pass bolus information to derive regional cerebral blood volume (rCBV) maps is commonly performed in many centers; however, various protocols with different doses of paramagnetic contrast injections have been reported. We evaluated the dose dependency of rCBV maps in a brain tumor population by using three different doses of gadodiamide injection to evaluate their diagnostic accuracy in blinded reader sessions.
METHODS: Eighty-three patients with intraaxial brain tumors (72 gliomas) were studied at three centers and randomized to receive a bolus injection of 0.1, 0.2, or 0.3 mmol/kg per body weight of gadodiamide. rCBV maps were generated from T2*-weighted gradient-echo echo-planar sequences at 1.5 T. Data processing was performed according to the indicator dilution theory.
RESULTS: The mean contrast-to-noise ratio (CNR) was significantly different between gadodiamide doses of 0.1 and 0.2 mmol/kg (CNR = 8.7 and 15.7) and between 0.1 and 0.3 mmol/kg (CNR = 17.7). No significant difference was found between doses of 0.2 and 0.3 mmol/kg. Sensitivity for the differentiation of benign and malignant brain tumors was 80%, 95%, and 91%, and specificity was 45%, 54%, and 43% by blinded readings at 0.1, 0.2, and 0.3 mmol/kg, respectively, as compared with histologic findings. Nonblinded readings had a sensitivity of 83%, 100%, and 90% and a specificity of 82%, 100%, and 73% at 0.1, 0.2, and 0.3 mmol/kg, respectively.
CONCLUSION: A dose of 0.2 mmol/kg of gadodiamide is recommended for reconstruction of rCBV maps if data are acquired with the T2*-weighted protocol described.
MR imaging is the established method of choice for evaluating brain tumors, both before and after treatment (1–3). However, the use of conventional T1-, T2-, and proton density–weighted sequences limits the application of MR imaging to morphologic information. The relevance of additional hemodynamic information has been shown in various studies with single-photon emission CT (SPECT) or positron emission tomography (4–6) or with blood volume reconstruction using CT or MR imaging (7–9). In addition, economic considerations associated with the workup of patients with tumor make the possibility of deriving both morphologic- and metabolic-related information in a single examination highly attractive. With the advent of echo-planar imaging (EPI) it is possible to monitor rapid changes in signal intensity (SI) as the contrast material passes through the brain (10).
MR imaging has been used to derive measures of regional cerebral blood volume (rCBV) and regional cerebral blood flow (rCBF). The susceptibility T2* effect, induced by a compact bolus injected peripherally and measured as a bolus passage through the organ of interest, allows for the reconstruction of rCBV and rCBF maps (11–15). However, the T1 relaxation effect has been recommended for the same purpose (16, 17). A recent study with an intraindividual comparison of T2* and T1 effects showed that T1 maps, in contrast to T2* maps, are limited with respect to the number of slices that can be acquired in a single bolus passage and to the contrast-to-noise ratio (CNR) (8). Several groups using various protocols (12, 18–21) have evaluated the clinical use of additional hemodynamic information derived from rCBV maps. However, with respect to gadolinium-based contrast medium dosage, only one study reported a preliminary dose comparison in a small number of patients (22), and no evaluation of higher doses has been published to date.
The three purposes of this study were 1) to determine the optimal dose of gadodiamide necessary to achieve good quality, high-CNR rCBV maps under the specific condition of a gradient-echo (GRE) echo-planar sequence used as described; 2) to evaluate sensitivity, specificity, and diagnostic accuracy as determined from on-site reading and blinded off-site reading; and 3) to compare sensitivity, specificity, and diagnostic accuracy achieved with three different doses (0.1, 0.2, and 0.3 mmol/kg per body weight) of gadodiamide injection.
Methods
Patients
Inclusion criteria for patient recruitment were written informed consent, ability of the patient to cooperate, and suspicion of either a low- or high-grade intraaxial intracranial brain tumor. Exclusion criteria included pregnancy, previous chemotherapy, previous radiation therapy, and surgery less than 30 days before the MR examination. A total of 30 women and 53 men participated in the study.
All patients were randomized to receive a gadodiamide injection of 0.1, 0.2, or 0.3 mmol/kg per body weight. The 0.1 mmol/kg dose was received by 29 patients (mean age, 50 ± 13 years), the 0.2 mmol/kg dose by 25 patients (mean age, 49 ± 14 years), and the 0.3 mmol/kg dose by 29 patients (mean age, 51 ± 17 years). Seven, 10, and 13 women and 24, 15, and 14 men received the 0.1, 0.2, and 0.3 mmol/kg dose, respectively.
The 83 patients were studied at three centers. The mean age of the patients in each center was 49, 56, and 52 years, respectively, resulting in a mean age of 50 ± 15 years for the entire population. The percentage of women in each center was 31%, 19%, and 40%, respectively, and the percentage of men was 69%, 81%, and 60%, respectively, resulting in an overall mean female population of 34% and a mean male population of 66%.
In 11 patients, histologic results showed intraaxial but nongliomatous tumors (eg, ependymoma), and these cases were not analyzed further. Of the 72 remaining gliomas, 20 were low grade, 21 were grade III, and 31 were grade IV according to the criteria of the World Health Organization (WHO). Figure 1 shows the distribution of the low- and high-grade gliomas in each dose group. Of these 72 gliomas, 41 were confirmed by open brain surgery, the remaining cases by stereotactic biopsy. The subsequent data analysis was based solely on the findings in the 72 glioma patients, unless indicated otherwise. The study protocol was approved by the local ethics committee at each of the three participating centers, and each patient gave informed written consent for inclusion in the study.

Tumor grade versus dose (given for the three dose groups: 0.1, 0.2, and 0.3 mmol/kg body weight (bw) (n = 72)
Method of Data Acquisition
All patients were recruited at one of the three participating centers. At all centers, 1.5-T systems with echo-planar capability were used for data acquisition. For each patient, a sagittal localizer image was obtained followed by the acquisition of axial T1-weighted spin-echo (SE) images and proton density–and T2-weighted fast SE images with parameters of 530/20/1, 2300/20/1, and 2300/85/1 (TR/TE/excitations), respectively.
The echo-planar T2*-weighted data measurement was started before the injection of the contrast medium to allow for a series of baseline images (two centers, 1500/54/1; one center, 1500/90/1, 90° flip angle for optimized signal to noise, minimum of five slices, with a slice thickness of 5 mm). The data acquisition had a temporal resolution of 1.5 seconds. After 12 seconds of baseline acquisition, the contrast medium (Omniscan, Nycomed Imaging AS, Oslo, Norway) was injected by power injector (Doltron, Heidelberg, Germany, or Medrad Spectris, Medrad, Pittsburgh, PA) into the antecubital vein. The flow rate was 5 mL/s for all doses. The power injector was then set to maintain a saline flush of 15 mL at the same injection rate. Data acquisition of the echo-planar sequence was repeated to acquire 60 images per slice. After the conclusion of the dynamic imaging, contrast-enhanced T1-weighted images were obtained in all patients.
Postprocessing
The dynamic T2*-weighted data were transferred from each MR unit to a remote workstation. Image processing of dynamic raw data was performed on a pixel-by-pixel basis by a program developed at the German Cancer Research Center (13, 23). The signal-time curves were converted to tissue concentration-time curves by the following logarithmic equation:  where C tissue (t) is the contrast agent concentration in the tissue at time (t), k2 is a tissue-specific constant, TE is the echo time, s(t) is the tissue SI at time (t) with contrast agent present, and s0 is the baseline SI before injection. Tracer recirculation was eliminated by fitting a gamma-variate function to the measured concentration time curves with the use of the Marquardt algorithm for nonlinear least-squares fitting (24). Finally, rCBV was calculated pixel-by-pixel according to the indicator dilution theory as the area under the contrast agent concentration–time curve (25). The mathematical analysis assumed no leakage of the blood-brain barrier (BBB) (26, 27); thus, no correction for a possible BBB leak was performed.
CNR
For the assessment of CNR, regions of interest (ROIs) were defined in white and gray matter in the contralateral hemisphere and in the anterior background. The average mean baseline SI was measured, and the minimum SI was documented for each patient. CNR was defined as (minimum SI − baseline SI) / SD of background noise.
Rating
The tumors were graded on the basis of histologic criteria in accordance with the recommendations of WHO, as described earlier (28). For radiologic grading, regions that appeared to have rCBV values larger than those of average normal gray matter were considered likely to be malignant or to belong to a high-grade tumor (grades III–IV). Tumor regions that had lower rCBV values than those of average normal gray matter were considered to reflect a benign or low-grade lesion (grades I–II).
The three interpreters were blinded to the patients' medical history, the confirmatory information, and the dose; among them, they had 8, 5, and 1.3 years' experience reading MR studies. During the reading process, all conventional images (T2 and T1 precontrast, T1 postcontrast) were mounted in parallel and were interpreted by each reader alone. The rCBV maps were similarly read in an analogous fashion, and rated independently. Assessments were also carried out in a nonblinded fashion by the on-site investigators. The on-site readings were also based on all conventional images mounted in parallel, and on the clinical information available, but not on the confirmatory information.
Statistics
SAS software (SAS Institute Inc, Cary, NC) was used for statistical analysis. Analysis of covariance (ANCOVA) was used to test whether there was a significant difference between the dose groups regarding CNR; centers were included as covariates in the statistical model. A P value of less than .05 was considered statistically significant.
Qualitative Assessment
The criteria of image quality and contrast effect of the rCBV maps were rated by all readers on a four-point scale as insufficient, sufficient, good, or excellent. To determine dose dependency, the data from each of the blinded and nonblinded readings were averaged.
Sensitivity, Specificity, and Accuracy
The results of the image interpretations were compared with the tumor grade obtained from the confirmatory information for each patient. Agreement occurred when both the reader and the confirmatory information identified the lesion with the same grade: benign (grade I–II) or malignant (grade III–IV). Sensitivity was defined as the proportion of correctly classified malignant lesions, specificity as the proportion of correctly classified benign lesions, and accuracy as the proportion of correctly classified lesions. A low-grade tumor mistaken for a high-grade tumor would create a false-positive finding and vice versa. Sensitivity, specificity, and accuracy were calculated to test dependency on 1) tumor grade and dose and 2) tumor grade and reader.
rCBV Assessment
To give relative values of the rCBV of each tumor, ROI measurements were analyzed. The mean rCBV of tumor tissue was normalized on the mean rCBV of contralateral gray matter in each patient. The data were then further classified as low-grade tumors (WHO grades I and II) or high-grade tumors (WHO grades III and IV) and analyzed separately for each dose (Fig 1).
Results
CNR
The CNRs were strongly dependent on dose. The 0.1 mmol/kg dose group had a mean CNR of 8.7 whereas the mean CNR for the 0.2 mmol/kg dose group was 15.7 (ANCOVA, P < .01). The 0.3 mmol/kg dose group similarly had a significantly larger CNR, of 17.7, as compared with the 0.1 mmol/kg dose group (P < .01). No significant difference was detected between the 0.2 and 0.3 mmol/kg dose groups (P = .698).
Qualitative Assessment
The dependency of the qualitative assessment on dose and reader is shown in Table 1. For the 0.1 mmol/kg group, the average scores of the three readers resulted in an insufficient image quality in 5% of the patients. Thus, image quality was rated as sufficient, good, or excellent in 95% of the cases. In the 0.2 mmol/kg group, insufficient image quality was found in 1% of the patients, with a sufficient, good, or excellent rating established in 99% of cases. In the 0.3 mmol/kg group, 91% of cases had a sufficient or better rating. As for the on-site assessment, 94%, 93%, and 84% of the images were considered to be of sufficient, good, or excellent image quality in the 0.1, 0.2, and 0.3 mmol/kg groups, respectively. The average contrast effect of the three independent readings was rated as insufficient in 4% of cases in the 0.1 mmol/kg group and in 4% and 2% of cases in the 0.2 and 0.3 mmol/kg groups, respectively. Thus, sufficient, good, or excellent contrast effects were observed in 96%, 96%, and 98% of cases in the 0.1, 0.2, and 0.3 mmol/kg groups, respectively.
Dose dependency of contrast effect and image quality
For details (and nonrounded numbers), please refer to Table 1. Examples of image quality and contrast effects of different doses are shown in Figures 2 to 4.

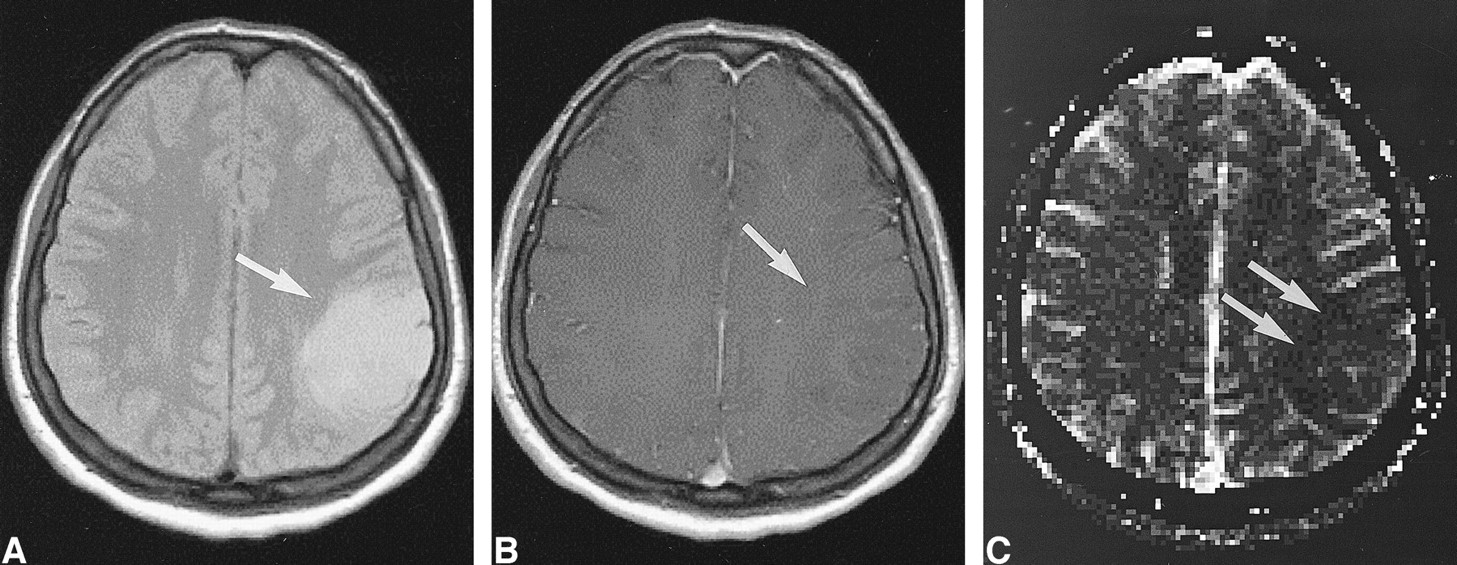
Low-grade tumor: injected dose, 0.1 mmol/kg.
A, Proton density–weighted image (2300/20/1) in a 38-year-old woman with a homogeneous lesion in the left parietal cortex. The tumor (arrow) was proved histologically to be a grade II glioma according to WHO criteria.
B, Contrast-enhanced T1-weighted image (530/20/1) shows no apparent enhancement in the tumor (arrow).
C, rCBV map confirms a low-grade lesion by exhibiting values below that of normal gray matter (arrows). However, at this dose the contrast within the rCBV maps was rated as limited.

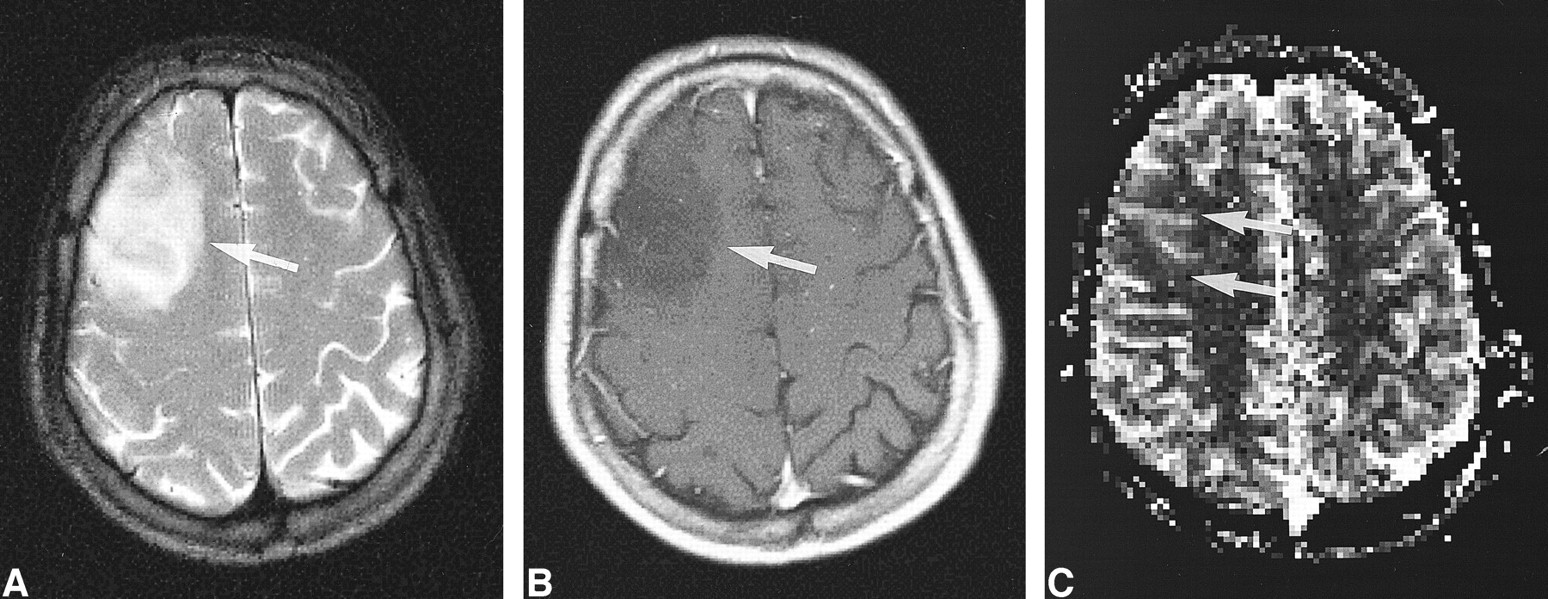
Low-grade tumor: injected dose, 0.2 mmol/kg.
A, T2-weighted image (2300/85/1) in a 31-year-old man shows a mass in the right frontal cortex with an appearance not unlike that of a low-grade intraaxial brain tumor.
B, Contrast-enhanced T1-weighted image (530/20/1) shows a tumor without contrast enhancement (arrow).
C, rCBV map shows low values in the tumor (arrows), confirmed to be a WHO grade II glioma. The contrast effect and the image quality of the rCBV map were graded superior to that in figure 2.

Low-grade tumor: injected dose, 0.3 mmol/kg.
A, T2-weighted image (2300/85/1) in a 22-year-old woman shows a large mass in the right insular region (white arrow). The dark dots are flow voids from the branches of the middle cerebral artery (black arrow).
B, rCBV map shows low values in the tumor (arrow), even below those of adjacent white matter. The lesion was confirmed to be a WHO grade II glioma.

High-grade tumor: injected dose, 0.1 mmol/kg.
A, Contrast-enhanced T1-weighted image (530/20/1) in a 44-year-old man with a mass in the left central region shows irregular contrast enhancement (arrow).
B, rCBV map shows elevation of the rCBV of the tumor (arrow) but with little contrast. The lesion was confirmed to be a WHO grade VI glioma.

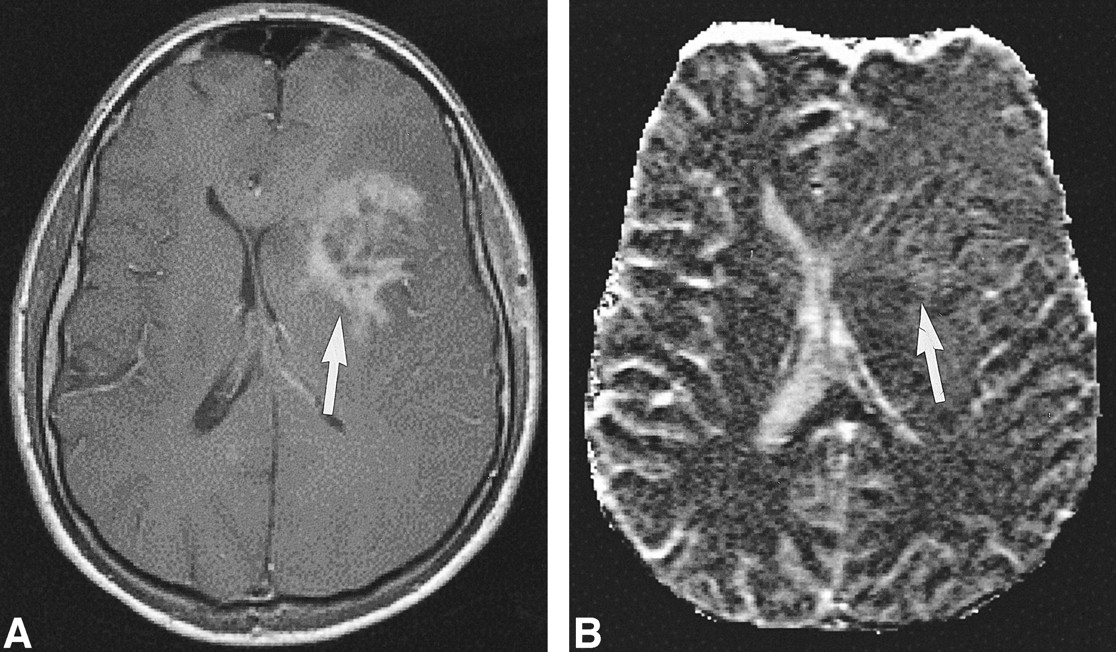
High-grade tumor: injected dose, 0.2 mmol/kg.
A, Contrast-enhanced T1-weighted image (530/20/1) in a 50-year-old man examined 4 month after initial surgery for a WHO grade VI glioma suggests recurrent tumor (arrow).
B, rCBV map shows elevated values of the tumor in a small rim (arrow), indicative of only a small portion of active tumor with high rCBV.

High-grade tumor: injected dose, 0.3 mmol/kg.
A, Contrast-enhanced T1-weighted image (530/20/1) shows a large enhancing lesion in a 60-year-old woman. Mass effect and poorly defined margins are also present.
B, rCBV map shows increased values in almost the entire tumor, except for a necrotic region (arrow) in this WHO grade VI glioma.
Sensitivity, Specificity, and Accuracy
The sensitivity, specificity, and accuracy data for the image interpretations as compared with the confirmatory data are given in Table 2. All individual data from the independent readers were pooled to derive dose dependency. On the blinded reading, low specificities of 45%, 54%, and 43% in the 0.1, 0.2, and 0.3 mmol/kg groups, respectively, were observed, with the highest specificity in the 0.2 mmol/kg dose group. The sensitivity was generally high and within a range of 80% to 100% (0.1 and 0.3 mmol/kg doses) (Table 2). Owing to the high sensitivity, the average accuracy was calculated to be 67%, 87%, and 75% for the 0.1, 0.2, and 0.3 mmol/kg groups, respectively.
Dose dependency of specificity, sensitivity, and accuracy of brain CBV imaging with gadodiamide injection at doses of 0.1, 0.2, and 0.3 mmol/kg per body weight (n = 72)
Specificity was variable, as reader 2 had the most experience in image interpretation and reached a specificity of 73% (reader 1, 18%; reader 3, 42%). Sensitivity, however, was high for readers 1 and 3 (100% and 93%, respectively) (Table 3). Diagnostic accuracy was nearly equivalent among all readers, ranging from 74% to 77%, but different from the on-site reading (88%).
Agreement rates of diagnosis based on rCBV maps correlated to the confirmatory information for individual readers (all doses averaged)
rCBV Assessment
In the low-grade tumors (WHO grades I and II), the mean rCBV normalized on gray matter was 1.11, 1.10, and 1.03 for the 0.1, 0.2, and 0.3 mmol/kg dose groups, respectively. For high-grade tumors (WHO grades III and IV), the mean rCBV normalized on gray matter was 2.12, 3.54, and 3.34 for the 0.1, 0.2, and 0.3 mmol/kg doses, respectively.
Center effects regarding age, sex, histologic findings, dose, and rCBV values were not statistically significant and, thus, were not analyzed further.
Discussion
This study was conducted to compare the effects of different doses of gadodiamide during serial MR imaging on rCBV maps. The double dose of gadodiamide injection (0.2 mmol/kg) was superior to the 0.1 mmol/kg dose in terms of CNR, image quality, contrast effect, sensitivity, and specificity. Even though the 0.3 mmol/kg dose was slightly better than the 0.2 mmol/kg dose with respect to CNR, image quality and contrast effects were less favorably rated, and sensitivity and specificity were also lower. These results are in agreement with preliminary results of testing doses of 0.1 and 0.2 mmol/kg (22, 29, 30).
The higher doses of gadodiamide (0.2 and 0.3 mmol/kg) gave superior results with respect to CNR. We hypothesize that the 0.1 mmol/kg dose was too small to induce a sufficient susceptibility effect with the sequences and field strength used. Possibly, a change in the injection protocol with bolus injection rates exceeding 5 mL/s would result in a more compact bolus formation and subsequently in a larger susceptibility contrast at the 0.3 mmol/kg dose. It is important to be aware, however, that injection rates exceeding this rate would not be acceptable in all patients because of limitations associated with the nature of the individual's peripheral veins. Although in this study the injected doses varied with body weight while the concentration was kept constant, this does not necessarily limit the significance of our observations, because only commercially available concentrations were used. CNR is also dependent on the sequence used. While a T2*-weighted sequence with a mean TE of about 66 (range, 54–90) was used, variations in TE and other parameters may affect the relative benefit of the different doses administered.
Sensitivity, specificity, and accuracy are the most important indicators in this study. The blinded reading protocol for the rCBV maps may in part explain the differences observed between the on-site and blinded assessments. Because only the rCBV maps were used for the readings, the interpreters were denied the benefit of morphologic details, such as the variegated, polymorphous appearance of malignant tumors or signs of tumor spread (1) or the breakdown of the BBB (26, 31, 32), all of which are known signs of malignancy. Sensitivity, specificity, and accuracy were based on the pooling of all benign and malignant tumors. Therefore, possible differentiations among the diverse features and histologic characteristics within one group were not tested. Also, the areas of highest grade on the rCBV maps were not correlated to individual sampling areas.
The results of the image interpretations were based on the assumption that areas of markedly elevated rCBV correspond to areas of malignancy. This result has been observed previously by various investigations (8, 16, 17, 30). A marked difference in the relative rCBV values between low- and high-grade tumors has also been reported (9, 22), and this finding was replicated in our data. However, the aim of our study was to evaluate patients in a prospective fashion and to assess sensitivity and specificity of the method when rCBV maps are read in a blinded fashion.
Interestingly, the less experienced readers had a lower specificity but a higher sensitivity than the more experienced ones, reflecting uncertainty in classifying tumors as benign (see Table 3). These readers preferentially assessed a tumor as malignant in the case of doubt. We conclude that training and experience are necessary to safely diagnose a low-grade lesion. Additional criteria for differentiating tumors, such as extent, infiltration, or edema, were not separately taken into consideration when reading the rCBV maps, partly because of the limited spatial resolution of the echo-planar data and partly because of the limited anatomic information provided by the maps. In addition, the confirmatory information rendered from the different trial centers was not detailed enough to enable a more detailed correlative analysis as to infiltration or tumor matrix. As previously reported, tumor progression was detected a median of 4 months earlier on rCBV maps than on MR images in 32% of a tumor population and earlier than on 201Tl-SPECT studies in 63% of that population (9). This provides a strong argument for using rCBV maps in the management of tumor patients. The current study did not intend to screen for early dedifferentiation or tumor progression, and therefore follow-up studies were not included.
Data necessary for the construction of rCBV maps can be measured with minimum time and expense (20, 33). Some extra costs apply, as a double-dose injection is recommended. The major advantage of the rCBV maps is that they provide reliable and sensitive hemodynamic information in addition to that obtained from routine MR imaging in a single study. The rCBV measures were given in relative values, which are influenced by various factors, such as the permeability surface product (31, 32). T2*-weighted pulse sequences and their postprocessing tend to yield an underestimation of the blood volume when extravasation is present (22). Also, the mathematical analysis used was adapted from Rempp et al (13), which assumes no leakage of contrast material into the interstitial space. This approach does not correct for BBB breakdown, thus creating the possibility for errors in the assessment of rCBV in areas of tumors with leakage.
All centers used an EPI sequence, which is known for its sensitivity to first-pass contrast bolus imaging. It has been shown that this sequence can be influenced by large-vessel contributions (20, 29). However, it is beyond the scope of this article to discuss the relative merits of GRE-derived rCBV versus SE-derived rCBV for defining malignant versus benign tumors. We assume that using an SE sequence would increase the relative contribution of small vessels at the cost of CNR and further hypothesize that this would be a trade-off of the above-mentioned sensitivity of the GRE sequence against improved microvascular specificity.
As the TR was chosen to be 1500, with a flip angle of 90° in all examinations, competing T1 saturation could occur with this sequence setting. However, owing to the need for a reasonable temporal resolution (1.5 seconds), we did not select a longer TR. The flip angle was kept constant, as it could not be changed on all scanners. Further studies are warranted to evaluate the relative benefit of variations in the flip angle in these bolus-tracking measurements.
There were differences in the patient recruitment among the three centers involved; however, the center effects were not found to be statistically relevant and were not analyzed further. Nonetheless, because different scanners were used, with a slight variation in protocol, and because tumor subtypes varied, it is possible that these variables influenced the analysis of the data.
The blinded reading did not lead to optimal tumor classification. In this trial, the limitation of the rCBV interpretation was probably due to errors induced by low CNR or low specificity, thus reducing diagnostic accuracy. However, use of the recommended optimal dose and training in a nonblinded setting should lead to a further increase in sensitivity and specificity. Whether the costs involved in double-dose administration are justified by the increased sensitivity and specificity cannot be answered by this study; however, an outcome analysis presumably could shed light on this issue.
Conclusion
An optimal dose of contrast material of 0.2 mmol/kg per body weight is recommended for the susceptibility effect based on the generation of rCBV maps with MR imaging, if scanned with the parameters described. The results indicate that rCBV MR imaging has high diagnostic accuracy for the noninvasive investigation of intraaxial brain tumors.
Acknowledgments
We acknowledge the input of Laurie Gauger, Juergen Weber, Michael Peller, Frederik Wenz, Joerg Reinhard, and others who gave generous support to this study.
Footnotes
↵1 Address reprint requests to Dr. Roland Bruening, Institute of Clinical Radiology, Klinikum Großhadern, Marchioninistr. 15, 81377 Munich, Germany.
References
- Received June 28, 1999.
- Accepted after revision March 16, 2000.
- Copyright © American Society of Neuroradiology


