
Abstract
BACKGROUND AND PURPOSE: Intravoxel phase dispersion and flow saturation often prevent adequate depiction of intracranial giant aneurysms on 3D time-of-flight (3D-TOF) MR angiography (MRA). Additional diagnostic difficulties may arise from T1 contamination artifact of an associated blood clot. Our aim was to assess whether contrast-enhanced MRA could improve the evaluation of giant aneurysms and to compare two different types of contrast-enhanced MRA.
METHODS: We studied 11 aneurysms in 10 patients (age range, 31–77 years) with giant aneurysms of the anterior (n = 9) and posterior (n = 2) cerebral circulation by comparing 3D-TOF, first-pass dynamic contrast-enhanced MRA, and steady-state contrast-enhanced 3D-TOF sequences. Additional comparison with digital subtraction angiography (DSA) was performed in eight aneurysms.
RESULTS: In nine of 11 aneurysms, 3D-TOF did not adequately show the lumen and exiting vessels. Contrast-enhanced 3D-TOF and dynamic contrast-enhanced MRA showed the aneurysm sac and exiting vessels in all of these cases. Dynamic contrast-enhanced MRA showed a better intravascular contrast than did contrast-enhanced 3D-TOF, which led to better delineation of the aneurysms. T1 contamination artifact from intra- or extraluminal blood clot was evident on the 3D-TOF images in four cases. The artifact was less marked on the contrast-enhanced 3D-TOF image and was completely eliminated on the dynamic contrast-enhanced MRA image by subtraction of precontrast images. The diagnostic information provided by dynamic contrast-enhanced MRA was comparable to that provided by DSA.
CONCLUSION: Precontrast 3D-TOF is inadequate for the assessment of giant cerebral aneurysms. Both contrast-enhanced 3D-TOF and dynamic contrast-enhanced MRA reliably show the aneurysm sac and connected vessels. Dynamic MRA provides a superior contrast between flow and background and eliminates T1 contamination artifact. It should therefore be considered as the MRA sequence of choice.
Technical advances in MR angiography (MRA) throughout the 1990s have continued to improve the sensitivity of this imaging technique for detecting cerebral aneurysms. Aneurysms as small as 3 mm can now be detected with this method (1–3). Nevertheless, the clear depiction of giant cerebral aneurysms still represents a challenge for MRA. Slow and turbulent flow in giant aneurysms leads to flow saturation and phase dispersion, which often preclude complete delineation on 3D time-of-flight (3D-TOF) studies (4–6). In addition, there may be high signal artifact from intraluminal thrombus or perianeurysmal hemorrhage, which can be mistaken for flow signal (6, 7). Contrast-enhanced MRA has the potential to overcome some of these problems, because its MR signal depends more on T1 shortening than on flow-related enhancement (8).
In this study, we compare first-pass dynamic contrast-enhanced MRA and contrast-enhanced 3D-TOF with conventional 3D-TOF angiography for the diagnosis of giant cerebral aneurysms. We also compare MRA studies with digital substraction angiography (DSA), when available.
Methods
Patients
Ten patients with 11 giant aneurysms underwent MRA. Six patients were male and three were female, with an age range of 31 to 77 years (mean, 67). Seven aneurysms involved the cavernous portion of the internal carotid artery, two the basilar artery, one the middle cerebral artery, and one the anterior communicating artery complex. Seven of these patients (eight aneurysms) also underwent intraarterial DSA. In the remaining three patients, performing invasive angiography was clinically not justified. Patient demographics and the precise anatomic extent of the aneurysms, based on Fischer's classification (9), are listed in Table 1.
Demographic patient data and anatomical location of giant aneurysms
MRA Sequences
Patients were examined either on a 1.5-T Signa magnet (GE, Milwaukee, WI) or on a 1.5-T Vision magnet (Siemens, Erlangen, Germany). Both systems were equipped with mid-range gradients of peak amplitudes of 23–25mT/m and rise times of 300μs.
A precontrast 3D-TOF sequence was performed first using the following parameters: 35–40/6.0–6.9/1 (TR/TE/excitations), 220–250 × 165–185-mm field of view, 320 × 224 matrix, 0.8-mm slice thickness, magnetization transfer prepulse, and ramped radiofrequency pulse with a nominal flip angle of 20°.
Dynamic contrast-enhanced MRA was performed during a single-dose manual injection of 0.1 mmol/kg Gd DOTA (Dotarem; Laboratoire Guerbet, Villepinte, France) at a rate of approximately 1 mL/sec, “chased” with a 20-mL saline injection. We used either a 3D spoiled gradient-echo (SGRE) sequence (1.5-T Signa unit; 6.0–8.7/1.4–1.8 [TR/TE]; flip angle, 30°; matrix, 256 × 128; acquisition, 1; field of view, 24 cm; slices, 16–40 of 1.5- to 3-mm thickness; imaging time, 18–27 s) or a 3D fast imaging with steady precession (FISP) sequence (1.5-T Vision unit; 5.0/2.0 [TR/TE]; flip angle, 25°; matrix, 128 × 256; acquisition, 1; field of view, 30 × 35 cm; slices, 30–36 of 2.22-mm thickness; imaging time, 20–25 s). Both scanners used sequential k-space filling. Imaging was performed either in a coronal or sagittal plane, depending on the spatial orientation of the giant aneurysm.
The 3D-SGRE or 3D-FISP sequence was repeated three times. Injection of Gd DOTA was started 10 s prior to commencing the second volume acquisition, with the aim of achieving peak arterial enhancement during the acquisition of the central k space of the second volume scan. The first volume acquisition was used as a mask for subtraction from the peak arterial time frame, which was either the second or, in the case of a low cardiac output and/or very slow flow in the aneurysm, the third volume acquisition.
The contrast-enhanced 3D-TOF sequence was performed immediately after dynamic contrast-enhanced MRA by using parameters identical to those of the 3D-TOF sequence, with the exception of the flip angle, which was increased to 45°.
DSA Studies
Intraarterial DSA was performed on a biplane angiography unit with a 1024 × 1024 pixel matrix (Toshiba Medical Systems, Tokyo, Japan). The standard acquisition rate for DSA images was two frames per second.
Image Analysis
Hardcopy films of the DSA runs, maximum intensity projections (MIP) and source data of the 3D-TOF, subtracted dynamic contrast-enhanced MRA, and contrast-enhanced 3D-TOF sequences were produced and reviewed separately. Two neuroradiologists (HRJ and WT) determined the visualization of the entering vessels, aneurysm sac, exiting vessels, and distal arterial branches by consensus, using a five-point scoring system: −, structure not visible; (+), structure only partially visible; +, ++, and +++, the entire structure had to be visualized with further distinction between + fair, ++ moderate, and +++ excellent depiction. The source data of the MRA studies were compared for the detection of clot within the aneurysm sac.
Results
Table 2 compares 3D-TOF, contrast-enhanced 3D-TOF, dynamic contrast-enhanced MRA, and DSA sequences for the visualization of the entering vessels, the aneurysmal lumen, exiting vessels, and peripheral branches of the artery bearing the aneurysm. One dynamic contrast-enhanced MRA study was nondiagnostic owing to patient movement during the bolus injection.
Visualization of entering vessels and aneurysm sac
The raters found “moderate” or “excellent” depiction of the vessels entering the aneurysm with DSA and all three MRA methods, except for one low-resolution dynamic contrast-enhanced MRA study on which depiction of these vessels was rated “fair.”
The aneurysmal lumen was incompletely shown by the 3D-TOF MRA technique in nine of 11 cases (Figs 1–3). The other two cases, in which 3D-TOF showed the patent lumen fully, were largely thrombosed aneurysms with a relatively small residual lumen. Both the contrast-enhanced 3D-TOF and the dynamic contrast-enhanced MRA techniques were able to show the full extent of the aneurysmal lumen in all cases (Figs 1–3), but the latter provided a much clearer depiction of the lumen and had a higher intravascular contrast. Compared with DSA, which was available for eight aneurysms, delineation of the sac by contrast-enhanced 3D-TOF technique was inferior in four and equal in the other four cases. Contrast-enhanced dynamic MRA, however, scored higher ratings than did DSA in three, equal ratings in three, and lower ratings in two cases for visualization of the aneurysm sac. In six of eight aneurysms, complete opacification of the aneurysm sac was not concurrent with that of the parent artery but took place over several angiographic time frames, the initial frame showing only a high velocity entry jet with areas of sluggish and turbulent flow filling more slowly. Opacification of the entering vessel was therefore often already decreased by the time optimal delineation of the aneurysm sac could be achieved (Fig 3).

78-year-woman with bilateral cavernous carotid aneurysms. A–D, T2-weighted fast spin-echo (FSE) image (A) (4200/99/2 [TR/TEeff/excitations]) shows bilateral enlargement of cavernous sinus by giant aneurysms of internal carotid arteries. These are of mixed signal intensity with high signal in areas of turbulent flow. 3D-TOF (B) (40/6.9/1; flip angle, 20°) shows only the entering vessels, but not aneurysm sacs nor exiting vessels, which are seen on contrast-enhanced 3D-TOF (C) (40/6.9/1/45°) and dynamic contrast-enhanced MRA sequences (D) (6.4/1.4/1/30°, slice thickness = 1.5 mm). These also show extension of aneurysmal dilatation into both middle cerebral arteries (MCAs). On the contrast-enhanced 3D-TOF sequence (C), the signal intensity of aneurysm sacs and distal vessels is attenuated compared with that of contrast-enhanced dynamic MRA (D), which provides excellent contrast between vessels and background

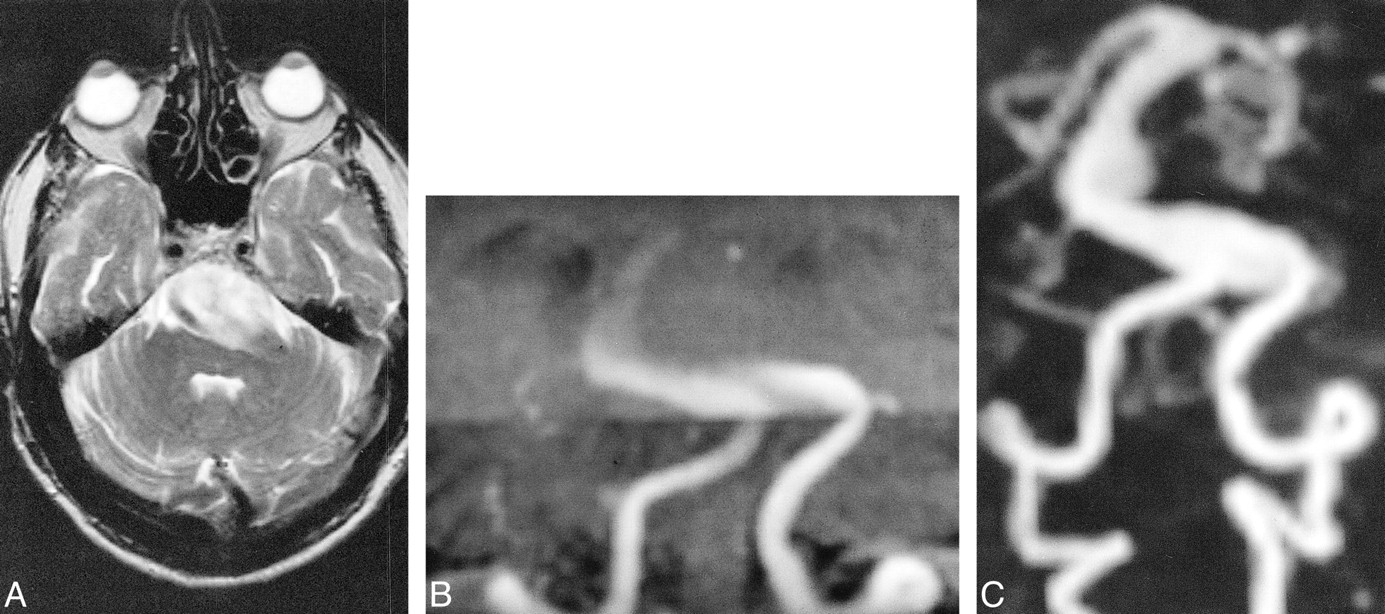
77-year-old man with giant basilar artery aneurysm. A–C, On T2-weighted FSE image (A) (5182/99/1), a giant basilar artery aneurysm is mainly of high signal. Patency of its lumen can therefore not be assumed. Targeted MIP projection of the posterior circulation from the 3D-TOF (B) (35/6/1/20°) sequences, acquired with overlapping slabs, shows the entering vessels, only a small part of the aneurysm sac, and no exiting vessels. Aneurysm and exiting vessels are well seen on dynamic contrast-enhanced MRA sequence (C) (5/2/1/25°)

62-year-old woman with giant aneurysm of left cavernous carotid artery (CCA). A–F, early (A) and late (B) frames of DSA run after left CCA injection. Early frame (A) shows entering vessel and high-velocity inflow jet. Full extent of aneurysm sac and exiting vessels are only shown on late frame of DSA run (B) where visualization of distal vessels is faint owing to turbulent flow and contrast dilution in the aneurysm sac. MIP of 3D-TOF (C) (40/6.9/1/20°) and contrast-enhanced 3D-TOF (D) (40/6.9/1/45°). Precontrast 3D-TOF (C) shows only entering vessels and high-velocity inflow jet, similar to early frame of the DSA (A), accounting for different projection angle, whereas contrast-enhanced 3D-TOF (D) also shows aneurysm sac and distal vessels. Axial source images of 3D-TOF (E) and contrast-enhanced 3D-TOF (F) show intraluminal clot. Low signal clot adherent to posterolateral wall of aneurysm is visible on 3D-TOF axial source images (E), but dropout of signal from nonlaminar flow anteriorly does not allow exclusion of additional clot. Interface between patent aneurysm lumen and low signal clot is much clearer on axial source images of contrast-enhanced 3D-TOF (F)
In six cases, the exiting vessels and peripheral branches of the aneurysmal artery were not visualized using 3D-TOF. In all of these cases, the exiting and distal vessels were shown on the contrast-enhanced 3D-TOF and dynamic contrast-enhanced MRA images (Figs 1–3). Visualization of the exiting vessels was similar on contrast-enhanced 3D-TOF, dynamic contrast-enhanced MRA, and DSA images. Contrast-enhanced 3D-TOF was overall slightly superior to dynamic contrast-enhanced MRA in the depiction of distal branches of the aneurysm-bearing artery owing to its higher spatial resolution. Distal branches were usually well shown by DSA. However, in two saccular aneurysms with a very slow intraaneurysmal flow, dilution of contrast medium resulted in an only “fair” visualization of the distal branches (Fig 3).
An intraaneurysmal blood clot was found in six cases. It was of low signal intensity in four and of mixed signal intensity in two cases. For detection of low signal thrombus, the source images of contrast-enhanced 3D-TOF and dynamic contrast-enhanced MRA were always better than those of 3D-TOF where the lumen was often incompletely shown and low signal thrombus was sometimes difficult to delineate from areas of signal loss due to complex flow (Fig 3).
There were two ruptured aneurysms with perianeurysmal hemorrhage of mixed signal intensity. T1 contamination artifact from methemoglobin in the two mixed signal thrombi and two perianeurysmal hematomas was of similar intensity to flow signal on 3D-TOF studies and interfered with the assessment of the aneurysmal lumen and boundaries. T1 contamination artifact was also present on the contrast-enhanced 3D-TOF image but could be reliably distinguished from flow signal in three of four cases, because there was a higher contrast between the intravascular and artifactual high signal. In one case, however, this distinction was also difficult to discern on the dynamic contrast-enhanced MRA images (Fig 4). T1 contamination artifact was not apparent on the dynamic contrast-enhanced MRA images, because high signal intensity from stationary tissue was eliminated by subtraction of the preenhancement volume from the contrast-enhanced time frame (Fig 4).

31-year-old man with ruptured giant aneurysm of the right MCA. A–E, T1-weighted SE image (A) (540/11/2) shows hematoma in right temporal lobe and insula with high signal from methemoglobin. It was shown to be due to rupture of fusiform giant aneurysm of right MCA by DSA (B). On 3D-TOF image (C) (40/6.9/1/20°), aneurysm lumen is indistinguishable from surrounding T1 contamination artifact. Contrast-enhanced 3D-TOF (D) (40/6.9/1/45°) faintly delineates aneurysm but remains severely degraded by T1 contamination artifact. Note that exiting vessel and M2 branches of right MCA, not seen by use of 3D-TOF (C), are, however, visualized. The dynamic contrast-enhanced MRA findings (E) (8.7/1.8/1/30°/3 mm), which is of low spatial resolution in this case, correlate well with those of DSA (B), showing only the aneurysm lumen, and not the hematoma
Discussion
Large cerebral aneurysms are often incompletely delineated on 3D-TOF MRA images due to saturation of slow flow and intravoxel phase dispersion in the presence of turbulent flow (4–6, 10). Phase-contrast MRA with appropriate velocity encoding was initially reported to be superior to 3D-TOF for the imaging of large aneurysms (10) but was subsequently found to produce images of inadequate quality for reliable depiction of the neck and lumen of giant aneurysms (6).
Additional diagnostic difficulties can arise from high signal artifact from intraluminal thrombus or hematoma surrounding a recently ruptured aneurysm, which can mimic flow signal (6, 7). For example in one of the cases described by de Jesus and Rifkinson (7), an acute hemorrhage into a pituitary adenoma was misdiagnosed as a giant aneurysm of the internal carotid artery on the basis of 3D-TOF findings.
Brugières et al (6) proposed a method of distinguishing subacute clot from flow signal by repeating the 3D-TOF sequence with a proximal presaturation pulse over the cervical arteries. Subsequent comparison of unsaturated and presaturated source images allowed distinction between hemorrhage, thrombus, and flow signal, because only the latter is suppressed in the presaturated sequence. This technique is time-consuming and the true aneurysm lumen is of low signal on the presaturated images, which precludes its representation on MIP images.
In our study, we examined whether the T1 shortening of flowing blood on contrast-enhanced MRA images provides a solution to the problems associated with conventional 3D-TOF findings of giant aneurysms.
Contrast-enhanced MRA was first described in the early 1990s (11) and has undergone important modifications since the introduction of fast imaging techniques (12–14). There are two principle techniques of contrast-enhanced MRA, which differ in acquisition time and pharmacodynamic distribution of contrast material during the image acquisition: it can either be performed during the initial transit or during the steady state after IV injection of a contrast medium bolus (8). The former uses a rapid gradient-echo sequence with a short TR during the first pass of the contrast medium bolus, when T1 of blood becomes as low as 30 to 60 ms for a duration up to 20 s (8). The second technique is performed during the steady state when contrast material is distributed throughout the intravascular and extravascular space. The elimination of contrast medium by the kidneys is slow, and the intravascular gadolinium concentration remains relatively uniform for some 30 min, lowering the T1 of blood to 200–400 ms (8). Gadolinium does not cross the intact blood-brain barrier, which has the advantage that, unlike in other organs, cerebral enhancement is essentially confined to the intravascular space during the steady state.
First-pass dynamic contrast-enhanced MRA is the more recent of the two techniques. It was first applied to MR aortography (12) and has more recently been used for examination of the extracranial carotid arteries (13, 15, 16). There have, however, been very few studies of intracranial dynamic contrast-enhanced MRA (8, 17). Its intracranial applications have been mainly limited because of the short time window between arterial and venous enhancement in the cerebral circulation, which precludes selective arterial imaging of a large area with acceptable spatial resolution.
With contrast-enhanced 3D-TOF, which is performed in the steady state, the restriction on imaging time is less severe, allowing high-resolution coverage of a large area. There have been several studies of intracranial contrast-enhanced 3D-TOF, describing optimization of technical parameters and contrast medium dose (18, 19) and clinical applications (11, 19–21). Jung et al (19) used 5-, 10-, and 20-mL injections of gadopentetate dimeglumine with 3D-TOF and found improved arterial detail compared with the precontrast 3D-TOF technique for all doses, although visualization of venous structures was more dose-dependent. Higher gadolinium volumes resulted in obscuring of small arterial detail by veins. Another important consideration is that the optimal flip angle for intravascular signal is inversely proportional to the T1 of blood. In line with the findings of previous studies, we increased the flip angle to 45° for the contrast-enhanced 3D-TOF technique (8, 18).
Contrast-enhanced 3D-TOF has been shown to improve the visualization of peripheral arterial branches and cerebral veins for revealing artifactual narrowing of middle cerebral arteries on precontrast 3D-TOF images (19), to improve visualization of venous angiomas (20) and venous components of cerebral arteriovenous malformations (8, 11, 19), and to increase the detection of small- and medium-sized cerebral aneurysms (8, 21).
This is, to our knowledge, the first study comparing contrast-enhanced 3D-TOF and dynamic contrast-enhanced MRA with precontrast 3D-TOF in the investigation of giant cerebral aneurysms. Intraarterial digital subtraction angiography, as an invasive procedure, was only performed in patients in whom it was thought to be justified from the point of clinical management and decision making. This was the case in the majority of patients and enabled additional comparison with DSA in eight of 11 aneurysms.
In our study, 3D-TOF did not adequately show the aneurysm lumen in the majority of cases owing to flow saturation and intravoxel phase dispersion, with the exception of two largely thrombosed aneurysms having a relatively small residual lumen, where these effects did not prevail. The slow transit of blood through the aneurysm sac with progressive saturation of its protons also explains the poor visibility of the distal branches of the aneurysm-bearing artery.
Progressive saturation of protons can limit the depiction of normal cerebral arteries at the top of the imaging volume (22). This can be compensated for by the use of a spatially variable flip angle, known as RAMP or TONE technique, or by the use of multiple overlapping slabs (23). In all our cases, we used either a spatially variable flip angle for single slab acquisitions or overlapping slabs for larger imaging volumes, as in the case of the two basilar artery aneurysms.
Both contrast-enhanced 3D-TOF and dynamic contrast-enhanced MRA depicted the aneurysm lumen, exiting vessels, and distal branches in all the cases where these had not been visualized on 3D-TOF images. The more marked T1 shortening achieved by the dynamic contrast-enhanced MRA provided a better intravascular contrast and delineation of the aneurysms compared with the contrast-enhanced 3D-TOF sequence. Enhancing venous structures were present on all the contrast-enhanced 3D-TOF images and could not always be avoided on the dynamic contrast-enhanced MRA images with a temporal resolution of 20–25 s, despite efforts to make the peak arterial enhancement coincide with the acquisition of the central k space. Venous enhancement, however, did not interfere significantly with the assessment of the giant aneurysms and could be partially eliminated by creating targeted subvolumes during postprocessing.
Contrast-enhanced 3D-TOF had a better spatial resolution (slice thickness 0.8 mm) than did the dynamic contrast-enhanced MRA technique when the slice thickness varied between 1.5 and 3 mm. For assessment of large structures, such as the sac of the giant aneurysm, the higher spatial resolution of contrast-enhanced 3D-TOF did not outweigh its poorer vessel-to-background contrast. For the visualization of small structures, such as distal arterial branches, the superior spatial resolution of contrast-enhanced 3D-TOF proved to be an advantage. The poorer spatial resolution of the dynamic contrast-enhanced MRA was more evident in the beginning of our study when we used 3-mm-thick slices. After a software upgrade, we were able to decrease the slice thickness to 1.5 mm without any time penalty, which significantly improved the image quality of dynamic contrast-enhanced MRA images.
The delineation of entering vessels, aneurysm sacs, and exiting vessels on dynamic contrast-enhanced MRA images was comparable overall to DSA findings. Assessment of vascular disease on DSA images, however, required analysis of a number of successive DSA frames in most cases, whereas the MIP images of the dynamic MRA provided this information on a single image. Both DSA and contrast-enhanced dynamic MRA exploit the first pass of an intravascular contrast medium, but differ significantly in the time and method of image acquisition. Image acquisition with dynamic contrast-enhanced MRA takes several seconds and produces a composite image of the structures opacifying during filling of the central k space. Image acquisition on DSA is much more rapid (2 images per second in this study) and produces a number of “snap shot” images of the passage of contrast medium through the giant aneurysm and connected vessels. Contrast-enhanced dynamic MRA thereby provides a better overview, whereas DSA allows a time-resolved analysis with possible deductions on hemodynamics.
A great advantage of the dynamic contrast-enhanced MRA over the other two MRA techniques is the elimination of T1 contamination artifact by subtraction of the preenhanced images. This allows accurate assessment of the patent lumen in aneurysms associated with high signal clot. The presence of high signal from methemoglobin markedly hampered the assessment of vascular boundaries on the 3D-TOF sequence, and to a lesser degree on the contrast-enhanced 3D-TOF sequence. The difference between intravascular signal and T1 high signal from blood was greater on the contrast-enhanced 3D-TOF sequence, partly because of T1 shortening of the blood and partly because of more efficient background suppression with an increased flip angle.
Intraluminal clots were best shown on the source images of the contrast-enhanced studies, which provided a higher contrast between clot and flowing blood than did the 3D-TOF technique.
Conclusion
In the diagnostic workup of cerebral giant aneurysm, contrast-enhanced MRA remedies the shortcomings of precontrast 3D-TOF studies. Dynamic contrast-enhanced MRA is comparable to DSA and superior to contrast-enhanced 3D-TOF in showing the aneurysmal sac, owing to its better contrast between flowing protons and background and elimination of high signal artifact from intra- or extraluminal clot. Its relative disadvantage of inferior spatial resolution compared with contrast-enhanced 3D-TOF will continue to decrease with wider availability of high-performance gradients and software that will improve the spatial resolution and area coverage of dynamic contrast-enhanced MRA.
References
- Received September 20, 1999.
- Accepted after revision May 8, 2000.
- Copyright © American Society of Neuroradiology
In this issue


Jump to section
Related Articles
Cited By...
- Surveillance of Unruptured Intracranial Saccular Aneurysms Using Noncontrast 3D-Black-Blood MRI: Comparison of 3D-TOF and Contrast-Enhanced MRA with 3D-DSA
- Quality-Evaluation Scheme for Cerebral Time-Resolved 3D Contrast-Enhanced MR Angiography Techniques
- Diagnostic Accuracy of Magnetic Resonance Angiography for Cerebral Aneurysms in Correlation With 3D-Digital Subtraction Angiographic Images: A Study of 133 Aneurysms