
Abstract
BACKGROUND AND PURPOSE: Integrated PET/MR allows the simultaneous acquisition of PET biomarkers and structural and functional MRI to study Alzheimer disease (AD). Attenuation correction (AC), crucial for PET quantification, can be performed by using a deep learning approach, DL-Dixon, based on standard Dixon images. Longitudinal amyloid PET imaging, which provides important information about disease progression or treatment responses in AD, is usually acquired over several years. Hardware and software upgrades often occur during a multiple-year study period, resulting in data variability. This study aims to harmonize PET/MR DL-Dixon AC amid software and head coil updates and evaluate its accuracy and longitudinal consistency.
MATERIALS AND METHODS: Tri-modality PET/MR and CT images were obtained from 329 participants, with a subset of 38 undergoing tri-modality scans twice within approximately 3 years. Transfer learning was used to fine-tune DL-Dixon models on images from 2 scanner software versions (VB20P and VE11P) and 2 head coils (16-channel and 32-channel coils). The accuracy and longitudinal consistency of the DL-Dixon AC were evaluated. Power analyses were performed to estimate the sample size needed to detect various levels of longitudinal changes in the PET standardized uptake value ratio (SUVR).
RESULTS: The DL-Dixon method demonstrated high accuracy across all data, irrespective of scanner software versions and head coils. More than 95.6% of brain voxels showed less than 10% PET relative absolute error in all participants. The median [interquartile range] PET mean relative absolute error was 1.10% [0.93%, 1.26%], 1.24% [1.03%, 1.54%], 0.99% [0.86%, 1.13%] in the cortical summary region, and 1.04% [0.83%, 1.36%], 1.08% [0.84%, 1.34%], 1.05% [0.72%, 1.32%] in cerebellum by using the DL-Dixon models for the VB20P 16-channel coil, VE11P 16-channel coil, and VE11P 32-channel coil data, respectively. The within-subject coefficient of variation and intraclass correlation coefficient of PET SUVR in the cortical regions were comparable between the DL-Dixon and CT AC. Power analysis indicated that similar numbers of participants would be needed to detect the same level of PET changes by using DL-Dixon and CT AC.
CONCLUSIONS: DL-Dixon exhibited excellent accuracy and longitudinal consistency across the 2 software versions and head coils, demonstrating its robustness for longitudinal PET/MR neuroimaging studies in AD.
ABBREVIATIONS:
- AC
- attenuation correction
- AD
- Alzheimer disease
- ICC
- intraclass correlation coefficient
- MAE
- mean absolute error
- MRAE
- mean relative absolute error
- pCT
- pseudo-CT
- PiB
- Pittsburgh compound B
- SD
- standard deviation
- SUVR
- standardized uptake value ratio
- wCV
- within-subject coefficient of variation
SUMMARY
PREVIOUS LITERATURE:
Several studies have proposed deep learning–based MR attenuation correction methods by using MR images acquired with the same scanner software version and head coil. Thus far, no study has evaluated the accuracy and longitudinal consistency across both software and hardware upgrades, which often occur in longitudinal studies over several years in patients with Alzheimer disease.
KEY FINDINGS:
DL-Dixon demonstrated high accuracy across data acquired by using 2 scanner software versions and head coils, passing all 4 qualification criteria proposed by a recent consensus paper. Moreover, the longitudinal consistency of DL-Dixon attenuation correction is similar to that of CT attenuation correction over 3 years.
KNOWLEDGE ADVANCEMENT:
DL-Dixon exhibited excellent accuracy and longitudinal consistency across 2 software versions and 2 coils, demonstrating its efficacy as a robust MR-based PET attenuation correction method for longitudinal Alzheimer disease research and clinical trials by using PET/MR.
In vivo amyloid PET imaging plays a crucial role in Alzheimer disease (AD) diagnosis and treatment.1⇓⇓⇓-5 A recently FDA-approved lecanemab amyloid reduction therapy uses PET or CSF tests to determine patients’ eligibility for treatment.5 Integrated PET/MR imaging is beneficial because it allows the simultaneous acquisition of PET biomarkers and structural and functional MRI data in a single examination. Quantitative PET imaging requires accurate attenuation correction (AC), one of the most critical factors. MR-based methods have been explored to synthesize pseudo-CT (pCT) for PET AC by using a variety of deep learning architectures, including convolutional encoder-decoder,6⇓-8 UNet,9⇓⇓-12 generative adversarial networks,13 CycleGAN,14 and Bayesian deep learning.15 Recently, a 3D patch-based residual UNet method demonstrated highly accurate PET AC by using ultra-short echo MRI, T1 MPRAGE, or Dixon images.9 Among these methods, the deep learning-based T1-enhanced selection of linear attenuation coefficients network achieved the highest AC accuracy by including quantitative R1 maps derived from a dual-flip-angle and dual-echo ultra-short echo time MRI sequence. Chen et al9 also demonstrated high PET/MR AC accuracy from a network by using vendor-provided Dixon images as inputs (DL-Dixon). The ultra-short echo sequence, with an acquisition time of 3 minutes and 50 seconds, is a custom sequence not widely available. In contrast, the Dixon sequence, a standard PET/MR AC sequence used by the vendor, has an acquisition time of only 19 seconds. An accurate DL-Dixon method offers a practical solution for many existing PET/MR brain images by using only a standard Dixon scan, making it a promising candidate for adoption in PET/MR clinical applications.
Longitudinal amyloid PET scans by using a variety of PET tracers, including 18F-labeled florbetapir, florbetaben, and flutemetamol, and 11C-labeled Pittsburgh compound B (PiB), are usually acquired over several years to monitor disease progression or treatment response. The annual mean changes of PET-measured amyloid deposition for patients with AD have been reported to be 1%-4%.4,5,16,17 Knowledge of the test-retest repeatability of amyloid PET is crucial to distinguishing methodology variability from true pathophysiologic longitudinal changes.18⇓⇓-21 Recently, a Radiological Society of North America Quantitative Imaging Biomarkers Alliance profile was proposed to improve the test-retest repeatability of amyloid PET imaging by standardizing the imaging acquisition approach.22
MR scanner upgrades, including software and hardware upgrades, are often introduced by vendors. For example, the scanner software version of the Biograph mMR scanner (Siemens) at our institution was upgraded, and a new 32-channel head coil was introduced. Images acquired by using different software versions or head coils have different spatial distributions of signal and noise, leading to increased PET/MR AC variabilities in longitudinal studies. Thus far, the longitudinal consistency of PET/MR AC has not yet been evaluated across both software and hardware upgrades.
This study aims to evaluate the accuracy and longitudinal consistency of DL-Dixon AC in amyloid PET with software and hardware upgrades between visits over approximately 3 years. We also performed power analyses to estimate the sample size required to detect longitudinal PET standardized uptake value ratio (SUVR) changes.
MATERIALS AND METHODS
The methodology proposed in the TRIPOD checklist was followed in this study.
Participants and Image Acquisition
Tri-modality PET/MR and CT images were acquired from 329 participants at Washington University School of Medicine with institutional review board approval and participants’ written consent.
PET and MR images were acquired simultaneously by using a Biograph mMR PET/MR scanner (Siemens Healthineers) between July 2014 and September 2022. Over this period, the PET/MR scanner had a software upgrade from Syngo VB20P to Syngo VE11P and a coil upgrade from a 16-channel head/neck coil to a 32-channel head coil. PET listmode data were acquired with 18F-florbetapir (Amyvid [Avid], Eli Lilly) or 11C-PiB tracer. T1 MPRAGE images were acquired (TE/TR = 2.95/2300 ms, TI = 900 ms, flip angle = 9°, matrix size = 240 × 256 × 176, voxel size = 1.05 × 1.05 × 1.2 mm3). In- and opposed-phase Dixon MR images were acquired by using the vendor-provided standard Dixon AC scan (TE1/TE2/TR = 1.23/2.46/3.6 ms, flip angle = 10°, matrix size = 192 × 126 × 128, voxel size = 2.6 × 2.6 × 3.1 mm3, acquisition time = 19 seconds). Low-dose CT images were acquired by using a Biograph 40 or Biograph Vision PET/CT scanner (Siemens Healthineers) at 120 kVp, with voxel size = 0.59 × 0.59 × 3.0 mm3 or 0.59 × 0.59 × 2.0 mm3.
Image Processing
T1 MPRAGE images were segmented and parcellated by using FreeSurfer 5.3 for regional analysis. Dixon head masks were determined by using the in-phase Dixon images with an empirically determined threshold to remove the background. Bias field correction was performed by using the FMRIB Automated Segmentation Tool23 in the FSL toolbox (FAST; http://fsl.fmrib.ox.ac.uk/fsl/fslwiki/fast). The level-set segmentation tool24 in the Computational Morphometry Toolkit was used to segment the head region from the background in CT images. CT images were aligned to the Dixon images by using a rigid registration with the FSL FLIRT (https://fsl.fmrib.ox.ac.uk/fsl/fslwiki/FLIRT).25
Deep Learning Network and Models for pCT Estimation
A 3D residual UNet with Dixon in- and opposed-phase images as inputs was developed to estimate pCT. The network structure and training strategy, including hyperparameter initialization, objective function, optimizer, learning rate, patch size, and patch combination approach, were described previously.9 Means and standard deviations (SDs) of CT HU were calculated from all participants. Means and SDs of Dixon images were obtained from Dixon in- and opposed-phase image pairs to preserve the relative contrast for each participant. The normalized image was calculated as (image – mean)/(2 × SD) and then used in the deep learning network training.
As summarized in Table 1, 3 DL-Dixon models were trained by using Dixon images acquired by using different software versions and head coils. PET/MR data were acquired with VB20P by using a 16-channel head/neck coil from 176 participants (median [interquartile range] age: 70 [65, 75], 101 women) −6 [−30.2, 0.2] days from CT (negative numbers indicate that the PET/MR scan was performed earlier than the CT scan). A VB20P-16Ch model was trained with 69 participants for training and 18 participants for validation. The model was applied to the remaining 89 participants for testing. PET/MR data were acquired with VE11P by using a 16-channel head/neck coil from 105 participants (median [interquartile range] age: 71 [65, 76], 58 women) 1 [−6, 20] day from CT. A VE11P-16Ch model was obtained by using transfer learning from the VB20P-16Ch model, with 42 participants for training and 11 participants for validation. The model was applied to the remaining 52 participants for testing. PET/MR data were acquired with VE11P by using a 32-channel head coil from 48 participants (median [interquartile range] age: 72.5 [68, 78], 27 women) 4 [−7.8, 38.2] days from CT. A VE11P-32Ch model was obtained by using transfer learning from the VE11P-16Ch model, with 19 participants for training and 5 participants for validation. The model was applied to the remaining 24 participants for testing.
Three DL-Dixon models were trained based on the software and coil used
A subset of participants (n = 38; median [interquartile range] age: 71 [68, 75] years, 22 women) underwent tri-modality images at 2 time points (PET1/MR1/CT1 and PET1/MR2/CT2). These data were used to evaluate the longitudinal consistency of DL-Dixon as network testing data. The median [interquartile range] time between the same participant’s first and second PET1/MR (PET/MR1 versus PET2/MR2) and first and second CT scans (CT1 versus CT2) were 39 [36, 47] and 39 [36, 47] months, respectively. The details of the software version and coil used in the data acquisition at PET/MR1 and PET/MR2 are summarized in Table 2. The VB20P-16Ch, VE11P-16Ch, or VE11P-32Ch model was applied to Dixon images acquired with the corresponding software version and head coil.
The longitudinal consistency of DL-Dixon was evaluated in 38 participants with repeated scans over approximately 3 years
μ-Map Generation and PET Reconstruction
A piecewise linear conversion was used to convert CT and DL-Dixon pCT images to μ-maps for AC.26 Using the vendor-provided e7tools software (Siemens Medical Solutions), PET listmode data acquired from 50 to 70 minutes or 30 to 60 minutes after tracer injection for 18F-florbetapir and 11C-PiB PET, respectively, were reconstructed with Poisson ordered subset expectations maximization algorithm (3 iterations, 21 subsets) with a 5-mm postreconstruction Gaussian filter.
To evaluate the longitudinal consistency of CT AC and MR AC, the CT μ-maps and DL-Dixon μ-maps at 2 time points of each participant were first aligned by using FSL FLIRT.25 The same PET listmode data (18F-florbetapir: n = 25,11C-PiB: n = 13) was then reconstructed with the CT μ-maps and DL-Dixon μ-maps from 2 scan visits.
Accuracy Analysis
The pCT images were visually inspected for artifacts. The accuracy of pCT was evaluated by using the acquired CT images as the reference standard. The whole head pCT mean absolute error (MAE) was calculated as,

The accuracy of DL-Dixon PET AC was evaluated by using CT PET AC as the reference standard. The PET images of individual participants were first aligned to their T1 MPRAGE images by using FSL FLIRT and then aligned to the International Consortium for Brain Mapping Atlas by using Advanced Normalization Tools.27,28
The voxelwise PET relative error was calculated as,
 and the voxelwise PET relative absolute error was calculated as,

The regional PET mean relative absolute error (MRAE) was calculated in 6 FreeSurfer-defined ROIs used by the Alzheimer’s Disease Neuroimaging Initiative (ADNI) pipeline29 and the medial temporal lobe.30 Among these ROIs, the cortical summary region is often used to examine global amyloid deposition, while the cerebellum is a reference region.29,31
The accuracy of DL-Dixon PET/MR AC was evaluated following the 4 qualification criteria recommended by a consensus paper.32 These criteria include 1) the MRI-based AC maps and corresponding PET should be free of artifacts and without misregistration; 2) PET relative absolute error should be less than 10% in over 90% brain voxels; 3) PET MRAE should be below 10% in all study-specific ROIs; and 4) PET MRAE should be below 5% in the reference ROI if reference tissue analysis is involved.
The accuracy of DL-Dixon models was compared by using the 2-sample t test with the Benjamini-Hochberg procedure to control for false discovery rate in multiple comparisons by using R 4.3.2 (Foundation for Statistical Computing).
Longitudinal Consistency Analysis
PET SUVR in the cortical summary region was calculated by using the cerebellum as the reference region.29,31 The longitudinal consistency of the CT-based and DL-Dixon methods was assessed by using the Bland and Altman method33 and the intraclass correlation coefficient (ICC; single rater, absolute-agreement, 2-way mixed-effects model34) by using Matlab 2021a (The MathWorks) and R 4.3.2. The mean and SD of the PET SUVR relative differences between the 2 scans were calculated for CT or DL-Dixon AC. In addition, the within-subject coefficient of variation (wCV) was obtained. Furthermore, a power calculation by accounting for longitudinal consistency was performed to estimate the number of participants needed to detect certain levels of PET SUVR changes with 80% power.
Data Availability
Investigators can access the data by following the steps outlined on the Knight ADRC Web site at our institution (https://knightadrc.wustl.edu/professionals-clinicians/request-center-resources/). Data access will be available upon the request’s approval by the Knight ADRC. The authors will share the code used in this study upon the publication of this manuscript.
RESULTS
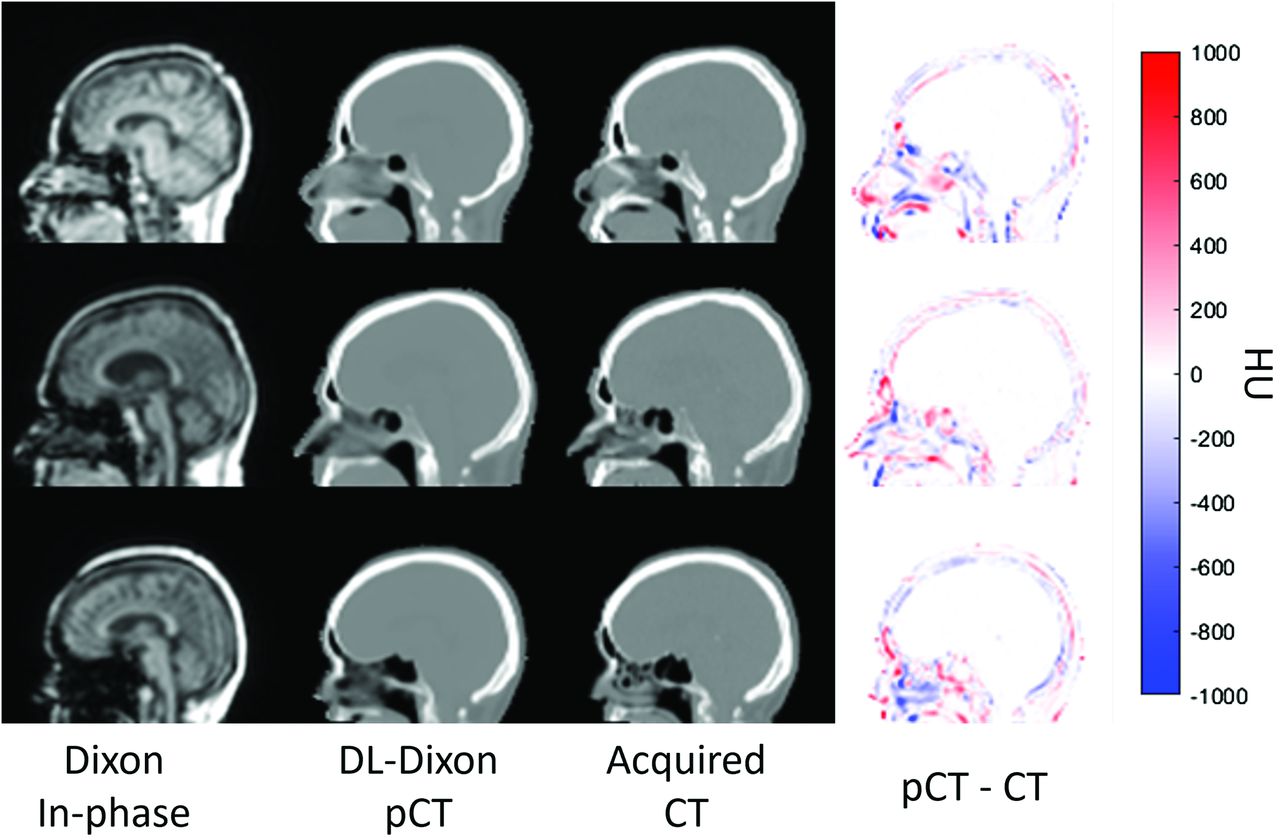
Fig 1 shows the Dixon in-phase MR images, DL-Dixon pCT images, acquired CT images, and the difference map between pCT and CT images from 3 representative participants. MR images were acquired by using different software versions and head coils. All 3 models generated pCT maps similar to the acquired CT maps without artifacts. The whole head pCT MAE (mean ± SD) was 64.7 ± 9.2 HU, 61.6 ± 7.2 HU, and 62.3 ± 10.0 HU for VB20P-16Ch, VE11P-16Ch, and VE11P-32Ch models, respectively. There was no significant difference in pCT MAE among different DL-Dixon models (P > .1).

Dixon in-phase MR images (first column), DL-Dixon pCT images (second column), CT images (third column), and HU difference map between pCT and CT (fourth column) from 3 representative participants. The PET/MR scans were acquired by using the VB20P software version and a 16-channel head/neck coil (first row), the VE11P software version and a 16-channel head/neck coil (second row), and the VE11P software version and a 32-channel head coil (third row).
Accuracy of DL-Dixon PET AC
Fig 2 shows the PET images reconstructed by using the DL-Dixon AC and CT AC. PET/MR images were acquired by using different software versions and head coils. As demonstrated in Fig 3, the mean PET relative error was between −1% and 1% in most brain regions for all 3 models. Fig 4 demonstrates the cumulative voxelwise relative absolute error of PET reconstructed by using DL-Dixon AC. 99.81% ± 0.42%, 99.64% ± 0.67%, and 99.91% ± 0.14% of brain voxels had PET relative absolute error less than 10% for VB20P-16Ch, VE11P-16Ch, and VE11P-32Ch models, respectively. All participants had over 95.6% brain voxels with PET relative absolute error of less than 10%.

PET reconstructed with the DL-Dixon AC (first column) or the CT AC (second column) from 3 representative participants. The PET/MR scans were acquired by using the VB20P software version and a 16-channel head/neck coil (first row), the VE11P software version and a 16-channel head/neck coil (second row), and the VE11P software version and a 32-channel head coil (third row).

Mean (A) and SD (B) of PET relative error on the voxel basis across testing participants of the VB20P-16Ch model (n = 89), the VE11P-16Ch model (n = 52), and the VE11P-32Ch model (n = 24). The CT AC method is used as the reference.

Cumulative voxelwise PET MRAE by using DL-Dixon AC. The acquired CT AC method is used as the standard reference. Each blue curve represents 1 participant. If the line stayed within the green region, the participant passed the qualification criteria.
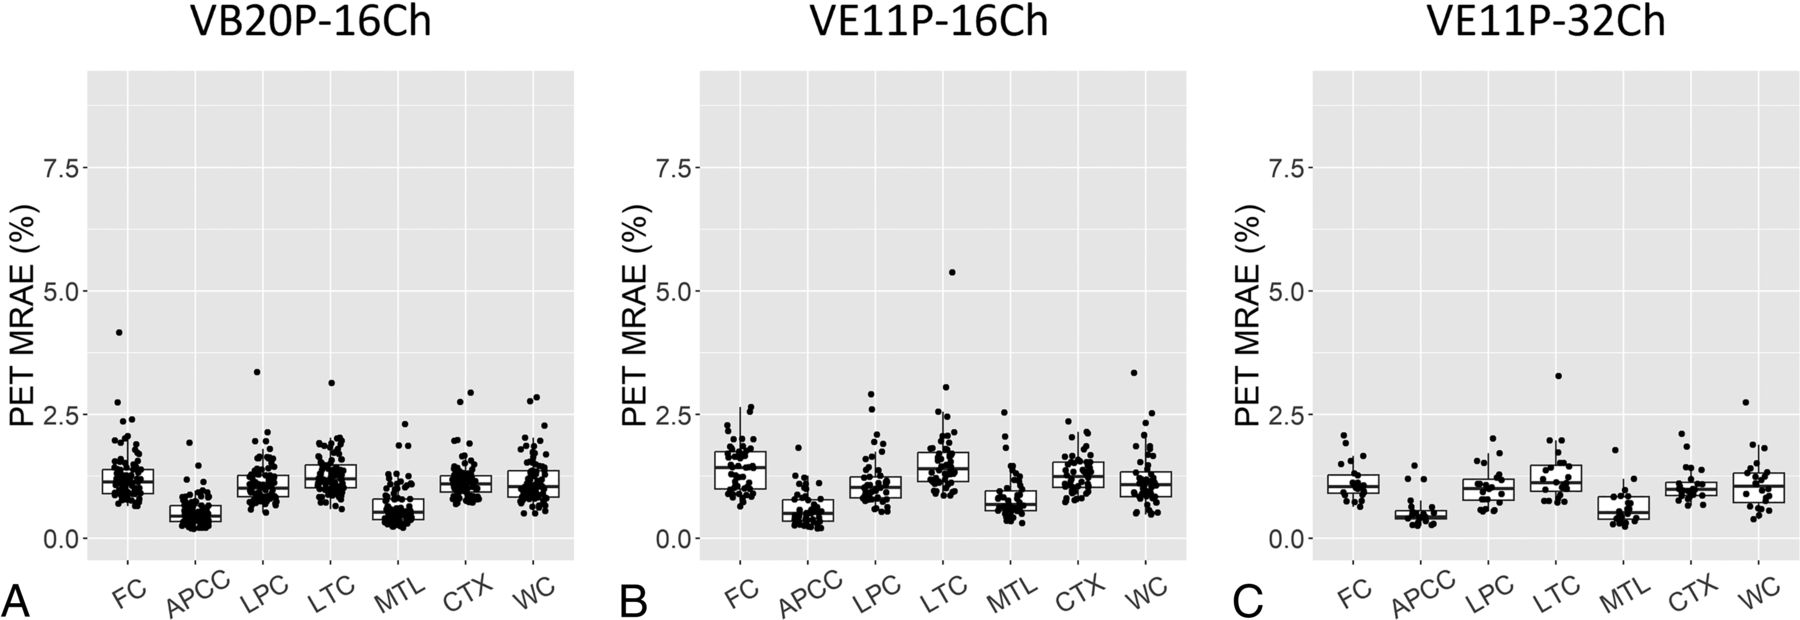
Fig 5 demonstrates PET MRAE in 7 amyloid PET-related ROIs. The median [interquartile range] PET MRAE was 1.10% [0.93%, 1.26%], 1.24% [1.03%, 1.54%], 0.99% [0.86%, 1.13%] in the cortical summary region, and 1.04% [0.83%, 1.36%], 1.08% [0.84%, 1.34%], 1.05% [0.72%, 1.32%] in the cerebellum by using the VB20P-16Ch, VE11P-16Ch and VE11P-32Ch models, respectively. Except for VE11P-16Ch having significantly higher PET MRAE than VE11P-32Ch in the frontal cortex region (P = .02) and the medial temporal lobe (P = .05), and VB20P-16Ch in the lateral temporal cortical region (P = .04) and the medial temporal lobe (P = .03), the 3 models had comparable PET MRAE in the remaining ROIs.

PET MRAE in 7 cerebral cortical and cerebellum ROIs. The boxplots show the 25th, 50th (median), and 75th percentiles. FC = frontal cortical region; APCC = anterior and posterior cingulate cortical region; LPC = lateral parietal cortical region; LTC = lateral temporal cortical region; MTL = medial temporal lobe; CTX = cortical summary region; WC = whole cerebellum region.
Longitudinal Consistency of DL-Dixon
The Bland-Altman plots and ICC plots in Fig 6 show the longitudinal consistency of regional PET SUVR by using CT AC and DL-Dixon AC in the cortical summary region. Table 3 summarizes the mean SUVR relative differences, wCV, and ICC. PET SUVR by using CT AC and DL-Dixon AC had similar wCV and ICC. Moreover, 18F-florbetapir PET (blue symbols) and 11C-PiB PET (red symbols) had comparable longitudinal consistency with either CT AC or DL-Dixon AC.

Longitudinal consistency of PET by using CT and DL-Dixon AC. The Bland-Altman plots of the PET SUVR difference between 2 CT (A) and 2 DL-Dixon (B) ACs in the cortical summary region are shown. The red horizontal line, dotted black horizontal lines, and solid black horizontal lines represent the mean, ± SD, and ±1.96 SD of the PET SUVR differences, respectively. Scatterplots of the PET SUVR between 2 CT (C) and 2 DL-Dixon (D) ACs in the cortical summary region are shown. The solid blue line and dotted black line represent the linear fitting line and line of identity, respectively. Symbol colors indicate different tracers (blue symbols: 18F-florbetapir PET, red symbols: 11C-PiB PET).
PET SUVR longitudinal consistency of CT AC and DL-Dixon AC in the cortical summary region
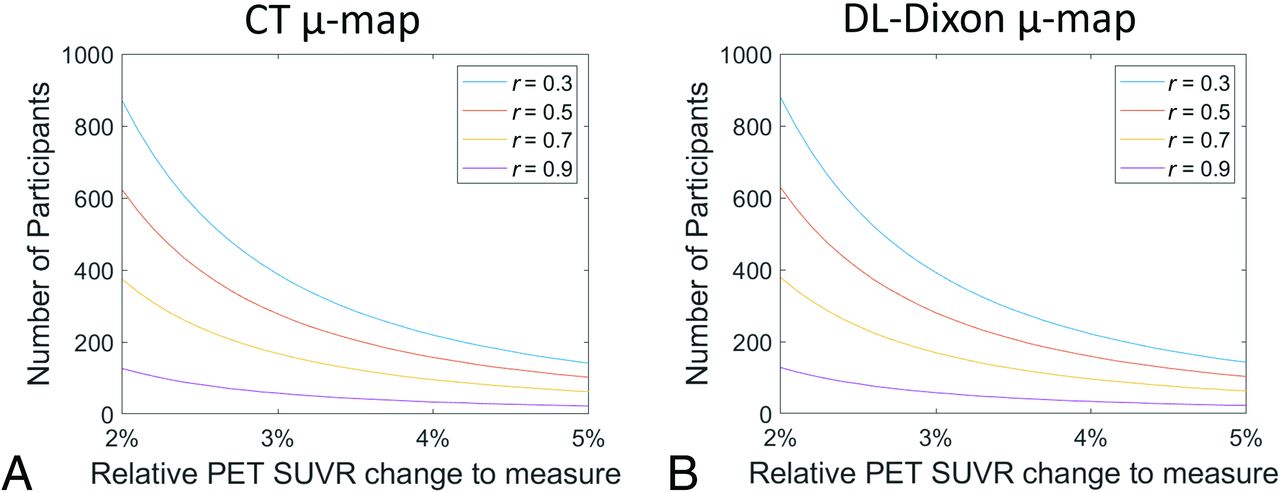
The number of participants required to detect real longitudinal PET SUVR changes in the cortical summary region with 80% power is shown in Fig 7. Assuming the correlation between the paired measurements from a participant of 0.3, 0.5, 0.7, and 0.9, the required numbers of participants needed to detect a 3% change in SUVR in the cortical summary region are 388, 278, 168, and 58 by using CT AC and 392, 280, 169, and 58 by using DL-Dixon AC.

Number of participants required to detect longitudinal change in the cortical summary region with 80% power. The r is the assumed correlation between the paired measures from a participant.
DISCUSSION
Deep learning-based image synthesis has been widely implemented for transforming imaging between MR and CT for PET/MR AC and radiation therapy planning.9,13,14,35 However, there is no consensus on the extent to which deep neural network–synthesized pseudo-images should be accepted. Addressing this question requires rigorous evaluation. In this study, we used the acquired CT images as the ground truth for such evaluation. We demonstrated that MR-synthesized pCT closely resembles the acquired CT, and the proposed method meets the qualification criteria outlined in a consensus paper.32 Furthermore, excellent longitudinal consistency of MR-based PET AC over several years was achieved across software and hardware upgrades, which is crucial for the use of PET/MR in AD longitudinal trials. To the best of our knowledge, our study is the first to evaluate the accuracy and longitudinal consistency of a PET/MR AC approach across both scanner software and head coil updates.
Several existing deep learning methods achieved PET MRAEs of 1%–3% in cortical and cerebellum ROIs by using the same software version and head coil.9,11,12,14 It is unclear whether these methods may be generalized to MR images acquired after MR scanner software and hardware upgrades. One study used the MR images acquired by using the same head coil but 2 software versions.10 This method showed PET MRAE of 1.5%–2% in the cortical ROIs and over 2% in the cerebellum ROI. The proposed DL-Dixon models have a median PET MRAE from 0.99%–1.24% and 1.04%–1.08% in the cortical summary region and the cerebellum, respectively, across both software and hardware upgrades (Fig 5). Moreover, all 3 DL-Dixon models passed the recommended qualification criteria for all participants.32
Test-retest repeatability is crucial for including a quantitative biomarker in longitudinal research and clinical trials. The test-retest repeatability of amyloid PET by using PET/CT or standalone PET scanners has been investigated in previous studies. Joshi et al18 found an 18F-florbetapir cortical SUVR wCV of 1.94% and 1.20% for patients with AD and healthy controls over 4 weeks. Vandenberghe et al19 found an 18F-flutemetamol SUVR wCV of 1.15% in the composite cortical ROI for patients with AD over 7–13 days. The long-term cortical SUVR wCV was reported to be 1.25%–3.38% for cognitively normal subjects over 2 years by using the 18F-florbetapir tracer.20⇓-22 Based on these studies, the Quantitative Imaging Biomarkers Alliance profile suggests that 18F-labeled amyloid PET SUVR should have a wCV of less than 1.94%.22
Several studies evaluated the repeatability or longitudinal consistency of MR-based PET AC methods. One study found a whole-brain SUVR difference of 0.65% ± 0.95% over 10 days,36 while another study found an SUVR difference of −0.65% ± 1.62% and wCV of 1.15% in the mean cortical region over 3 years.9 In this study, longitudinal SUVR difference and wCV of DL-Dixon AC (0.25% ± 0.75% and 0.55%) are similar to those of CT AC (−0.16% ± 0.74% and 0.53%) despite software and hardware updates over 3 years (Fig 6, Table 3). To detect a specific level of longitudinal change in amyloid PET SUVR, a similar number of participants would be needed by using DL-Dixon compared with CT AC (Fig 7). The longitudinal consistency of DL-Dixon meets the Quantitative Imaging Biomarkers Alliance recommendation.
Recently, the Centiloid approach was proposed to normalize the amyloid burden measured by using various tracers on different scanners to a standard scale.37 The annualized absolute Centiloid change was reported to be 2.2 to 3 Centiloid in dominantly inherited AD mutation-positive participants38 and 2.43 Centiloid in patients with mild dementia or mild cognitive impairment due to AD5. Using the SUVR-to-Centiloid transformations for the ADNI FreeSurfer 5.3 pipeline,31,37 the longitudinal Centiloid difference was −0.39 ± 1.58 for CT AC and 0.45 ± 1.59 for MR AC. It is worth noting that the studies mentioned above used separately acquired PET data at 2 time points, while this study used the same PET data but separately acquired CT or MR to derive μ-maps. The longitudinal differences might be higher if 2 separately acquired PET data were used. This study used the MR and CT images acquired twice over 3 years. Possible structural changes over this period may partially affect the longitudinal consistency.
Numerous deep learning–based methods have been developed to synthesize pCT images by using MRI.6⇓⇓⇓⇓-11,13⇓-15 CT images measure tissue electron density, while MR signal depends on magnetic properties, such as proton density and tissue relaxation rates. There is no direct relationship between the signal intensity of Dixon MR and CT HU, which results in challenges in intensity-based methods. Despite differences in imaging physics, the paired MR and CT images are obtained from the same patients. Therefore, MR and CT images share the same anatomic structures. In this study, a 3D residual UNet was trained to learn complex nonlinear relationships between MR and the corresponding CT image by minimizing differences between the predicted pCT and CT. The transformation of MR to CT involves anatomic, geometric, image contrast, and texture information derived from millions of paired MR and CT patches.
This study has several limitations. First, all data in this study were obtained from elderly participants by using amyloid tracers at a single research site. The accuracy and longitudinal consistency of DL-Dixon should be further evaluated by using different scanners in multicenter studies with patients of a broader age range. Second, participants in this study do not have bone abnormalities. The performance of DL-Dixon in such cases is unclear.
CONCLUSIONS
DL-Dixon exhibited excellent accuracy and longitudinal consistency across 2 software versions and 2 coils, demonstrating its efficacy as a robust MR-based AC method for longitudinal research and clinical trials by using PET/MR.
Footnotes
This work is supported by NIH grants P30AG066444, P01AG003991, P01AG026276, RF1NS116565, R01EB032713, and R21NS127425. Image acquisition received additional support from UL1TR00044, P30NS098577, and Siemens Healthineers. Avid Radiopharmaceuticals (a wholly owned subsidiary of Eli Lilly) provided the doses of 18F-florbetapir and partially funded the cost of the PET scans.
Disclosure forms provided by the authors are available with the full text and PDF of this article at www.ajnr.org.
References
- Received May 30, 2024.
- Accepted after revision September 4, 2024.
- © 2025 by American Journal of Neuroradiology


Jump to section
Related Articles
Cited By...
- No citing articles found.