
Abstract
BACKGROUND AND PURPOSE: Given their overlapping features, pituitary metastases frequently imitate pituitary neuroendocrine tumors in neuroimaging studies. This study aimed to distinguish pituitary metastases from pituitary neuroendocrine tumors on the basis of conventional MR imaging and clinical features as a practical approach.
MATERIALS AND METHODS: In this 2-center retrospective study, backward from January 2024, preoperative pituitary MR imaging examinations of 22 pituitary metastases and 74 pituitary neuroendocrine tumors were analyzed. Exclusion criteria were as follows: absence of a definitive histopathologic diagnosis, history of pituitary surgery or radiation therapy before MR imaging, and pituitary neuroendocrine tumors treated with medical therapy. Two radiologists systematically evaluated 13 conventional MR imaging features that have been reported more commonly as indicative of pituitary metastases and pituitary neuroendocrine tumors in the literature. Age, sex, history of cancer, and maximum tumor size constituted the clinical/epidemiologic features. The primary cancer origin for this study was also noted. Univariable and multivariable logistic regression was used for the selection of variables, determining independent predictors, and modeling. Interobserver agreement was evaluated for all imaging parameters using the Cohen κ statistic or intraclass correlation coefficient.
RESULTS: A total of 22 patients with pituitary metastases (8 women; mean age, 49.5 [SD, 13] years) and 74 patients with pituitary neuroendocrine tumors (36 women; mean age, 50.1 [SD, 11] years) were enrolled. There was no statistically significant distributional difference in age, sex, or maximum tumor size between the 2 groups. Lung cancer (9/22; 41%) was the most commonly reported primary tumor, followed by breast (3/22; 13.6%) and unknown cancer (3/22; 13.6%). Logistic regression revealed 3 independent predictors: rapid growth on control MR imaging, masslike or nodular expansion of the pituitary stalk, and a history of cancer. The model based on these 3 features achieved an area under the curve, accuracy, sensitivity, specificity, and Brier score of 0.987 (95% CI, 0.964–1), 97.9% (95% CI, 92.7%–99.8%), 95.5% (95% CI, 77.2%–99.9%), 98.6% (95% CI, 92.7%–100%), and 0.025, respectively.
CONCLUSIONS: Two conventional features based on pituitary MR imaging with the clinical variable of history of cancer had satisfying predictive performance, making them potential discriminators between pituitary metastases and pituitary neuroendocrine tumors. In cases in which differentiation between pituitary metastases and pituitary neuroendocrine tumors poses a challenge, the results of this study may help with the diagnosis.
ABBREVIATIONS:
- AUC
- area under the curve
- PitNET
- pituitary neuroendocrine tumor
- PM
- pituitary metastasis
- ROC
- receiver operating characteristic
SUMMARY SECTION
PREVIOUS LITERATURE:
Findings to distinguish between pituitary metastases (PMs) and pituitary neuroendocrine tumors (PitNETs) are limited in the literature to case reports or series, with overlapping features. Nearly all of these papers present PMs as mimickers of PitNETs and emphasize some indicative signs. However, lack of original research studies providing distinctive features through statistical analysis poses a challenge for radiologists and clinicians. Additionally, review articles have been written on this topic, often discussing epidemiological and demographic characteristics. According to these papers, PMs are more commonly seen in elderly patients, with the most frequent primary cancer origins being the lung, breast, and kidney.
KEY FINDINGS:
Rapid growth on control MR imaging, masslike or nodular expansion of pituitary stalk, and history of cancer, exhibit an area under the curve, accuracy, sensitivity, and specificity of 0.987, 97.9%, 95.5%, and 98.6%, respectively. These satisfactory performance make them potential discriminators between PMs and PitNETs.
KNOWLEDGE ADVANCEMENT:
By using three independent predictors including two conventional MR imaging features and one clinical variable, the findings of this study can facilitate the discrimination of PMs from PitNETs, with high accuracy. This noninvasive and highly accurate method has a potential to significantly contribute to early diagnosis and treatment planning.
Pituitary metastasis (PM) is an uncommon entity, accounting for 1%–3.6% of surgically treated sellar lesions and 0.4% of all metastatic intracranial tumors.1 In postmortem cases, this proportion increases to approximately 28% due to its frequently asymptomatic presentation.1,–,3 PM is frequently observed in elderly patients, between 45 and 74 years of age with a mean age of around 60 years, with no sex predilection.4,5 Although the most commonly encountered primary sites are lung and breast cancers, metastasis from almost every primary cancer location including kidney, liver, prostate, and colon cancers has been reported.1,4,6,7 About 3%–4% of cases arise from an unknown primary cancer.8 Nearly 80% of the reported PMs are identified concomitantly with widespread disseminated metastatic disease; nevertheless, solitary metastatic lesions to the pituitary gland have also been reported.1,8⇓–10 Advances in cancer treatment options and neuroimaging techniques, along with improvement in the survival of patients with cancer, have led to an increase in the frequency of PMs.2,11 However, when they are diagnosed, the prognosis is generally very poor, with a median survival of 6 months.1
Given their frequently overlapping imaging features and shared symptomatology such as visual dysfunction and endocrine abnormalities, PMs often imitate pituitary neuroendocrine tumors (PitNETs), known as pituitary adenomas.12⇓⇓⇓⇓–17 For diagnosing a PM without other intracranial metastases on the first surveillance, brain MR imaging can pose a challenge,18 leading to difficulties for radiologists and clinicians, so there is frequently a need for a histopathologic diagnosis.13 Being able to preoperatively differentiate PMs from the more frequently encountered PitNETs helps in determining the correct treatment approach.12 For instance, while most PitNETs are resected using a transsphenoidal surgical approach, in PM cases, stereotactic radiosurgery, chemotherapy, or systemic targeted medical treatment can be optimal treatment methods.4,8,19,20 Therefore, there is a critical need for a noninvasive method for differentiating PM from PitNETs.
In neuroradiology practice, we have noticed some distinctive features on pituitary MRIs of PM cases, such as stalk involvement and rapid growth on follow-up imaging. We realized that the state of the existing literature in this area consists solely of case reports or series, and the lack of a study providing distinctive features through statistical analysis has led to diagnostic challenges for radiologists. To facilitate radiologic diagnosis and clinical decision-making in the management of sellar tumors, this study aimed to distinguish PMs from PitNETs on the basis of conventional MR imaging and clinical features as a practical approach.
MATERIALS AND METHODS
Ethics
This 2-center retrospective study was conducted in compliance with the Declaration of Helsinki, and institutional review board approval was obtained from the local ethics committee of Basaksehir Cam and Sakura City Hospital (decision no: 556; decision date: August 11, 2023). The requirement of written informed consent was waived.
Data Collection and Exclusion Criteria
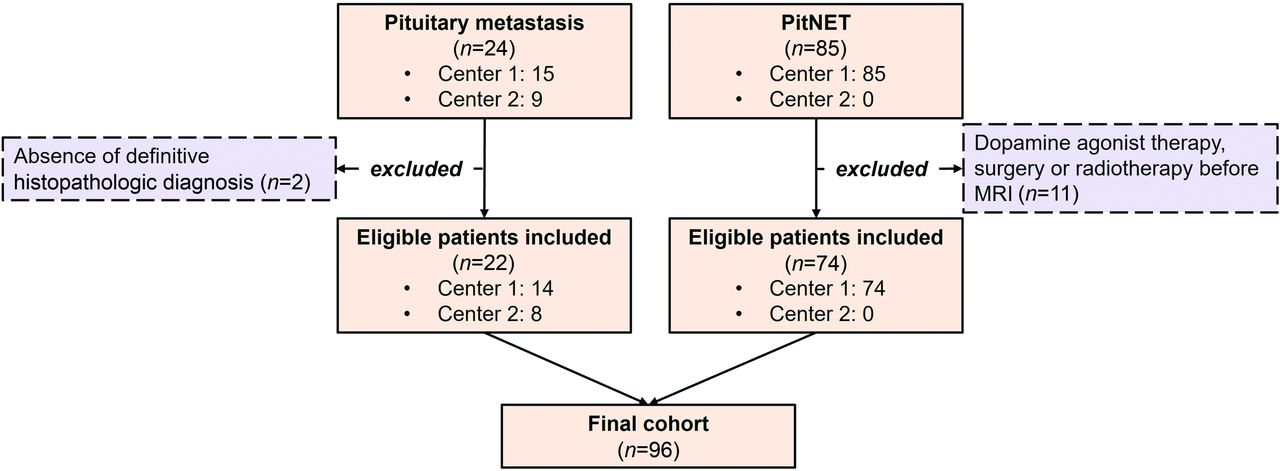
Backward from January 2024, a retrospective search for patients with histopathologic diagnoses of PM (n = 24) and PitNET (n = 85) who underwent preoperative MR imaging was conducted. All PitNETs consist of benign adenomas. Pituitary carcinoma cases were not included in the study. Due to the rarity and to increase the number of PM cases, as much as possible, data were collected consecutively from 2 institutions, one being a tertiary research hospital (main center, Basaksehir Cam and Sakura City Hospital) and the other a university hospital (Ege University School of Medicine Hospital). In contrast, PitNETs, being relatively more common, were collected from the main center. The following criteria determined exclusion: 1) the absence of a definitive histopathologic diagnosis; 2) history of pituitary surgery or radiation therapy before MR imaging examination; and 3) cases of PitNETs treated with dopamine agonist therapy before imaging.
Pituitary MR Imaging Protocol
All pituitary MR imaging examinations were conducted with a 3T MR imaging unit (Ingenia; Philips Healthcare) and a 1.5T MR imaging scanner (Magnetom Amira; Siemens). The imaging protocol for each patient comprised coronal and sagittal spin-echo T1WI, coronal and sagittal spin-echo T2WI, coronal dynamic contrast-enhanced T1WI, and conventional coronal and sagittal late contrast-enhanced T1WI sequences following the administration of gadolinium-based contrast agents. For each examination, 0.1 mmol/kg of gadolinium-based contrast agent was administered. Pituitary MR imaging sequence parameters are detailed in the Online Supplemental Data. Pituitary MR imaging protocols complied with recommendations of the European Society of Endocrinology guidelines for the management of aggressive pituitary tumors and carcinomas.21
Conventional MR Imaging Features and Image Analysis
All anonymized MR imaging data were reviewed independently by 2 radiologists with 4–5 years of experience in neuroimaging. Radiologists were blinded to all clinical history, histopathologic diagnoses related to the patients, or the interpretations of the other radiologist. The decision of the most experienced reader was included in the analysis. The radiologists were from different institutions. The data were shared and assessed using a commercial PACS system. For each case, radiologists systematically evaluated a total of 13 conventional MR imaging features as described below.
In neuroimaging studies, the following 7 features have been reported more commonly as indicative of a PM: 1) rapid growth on control MR imaging, defined as a 20% increase in the maximum tumor diameter within 6 months.22 In statistical analysis, the most recent (preoperative) MR images of the cases were considered, and whether there were any previously obtained MR imaging was investigated. In statistical analysis, cases showing a >20% increase in size within 6 months compared with the previous MR imaging were categorized as “yes,” while cases without observed growth were categorized as “no.” If there was no previously obtained MR imaging or if the time interval between the previous and preoperative MR imaging was <6 months and there was no more than a 20% increase in size, these cases were considered “unclear.” For example, if a case had an MR imaging obtained 1 month before preoperative MR imaging and the tumor did not show growth during this period, it was categorized as unclear. In the statistical analysis, unclear was assigned as the reference level. Subsequent features are the following: 2) leptomeningeal seeding or the presence of other intracranial metastases;12 3) irregular infiltrative contour;12 4) dumbbell-shaped appearance, defined as the 2 components of the mass being of similar size or having a thin waist between them;22,23 5) masslike or nodular expansion of pituitary stalk;12 6) edema along the visual pathway, meaning the presence of hyperintensity on T2-weighted images;4 and 7) adjacent bone invasion. When necessary, CT was used in addition to MR imaging to define adjacent bone invasion. Bone replacement on MR imaging was considered sufficient for invasion. If a case was uncertain on MR imaging, the reader evaluated the patient’s CT scan, and if there were lytic/destructive changes, it was accepted as invasion.18
The following 3 MR imaging features more commonly associated with PitNETs were also included in the group-based analysis: 1) snowman-like appearance, typically defined as the body component of the mass being larger than the head component;24 2) cavernous sinus invasion, according to the Knosp classification;25 and 3) sellar enlargement.24
Tumor location (anterior sella dominance, posterior sella dominance, or nondominant), enhancement homogeneity (homogeneous or heterogeneous), and enhancement degree (marked or mild/moderate) based on postcontrast T1WI constituted the remaining 3 MR imaging features analyzed in both groups.26
Figure 1 includes sample cases for each of these conventional MR imaging features.

Conventional MR imaging features assessed in this study. A and B, Highlighting rapid growth on follow-up MR imaging within only 37 days and the poorly defined irregular contour feature (arrows). C, Snowman-like appearance (arrow), sellar enlargement, and adjacent bone invasion (dashed arrow). D, Adjacent bone invasion (arrow). E, Dumbbell-shaped appearance (arrow) and edema along the visual pathway (arrowheads). F, Masslike or nodular expansion of the pituitary stalk (arrow). G, Anterior sella dominance involvement (arrow). H, Posterior sella dominance and infundibular involvement (arrow). I, Entire sella (nondominant) involvement (arrow) with leptomeningeal seeding along the surface of the brainstem and the fourth ventricle (dashed arrows).
In addition, recorded data also included age, sex, history of cancer, maximum tumor size, primary cancer type for PMs, and a control MR imaging interval. In univariate analysis, age, sex, history of cancer, and maximum tumor size were included, in addition to the 13 MR imaging features described above.
Statistical Analysis
The statistical analysis was performed using JASP (Version 0.17.3.0; https://jasp-stats.org/), Jamovi (Version 2.2.5; https://www.jamovi.org/), MedCalc (Version 22.021; MedCalc Software), pROC (Version 1.18.5; https://www.rdocumentation.org/packages/pROC/versions/1.18.5), and rms (Version 6.7–1; https://cran.r-project.org/web/packages/rms/index.html) packages in R (http://www.r-project.org/). Descriptive statistics were presented using mean, median, SD, or interquartile range based on the normality of distribution, assessed with the Shapiro-Wilk test. For categoric variables, the χ2 test, with or without continuity correction, was used depending on the number of cells in the contingency tables. On the basis of the statistical normality of distribution at the group level (for each class), a parametric or nonparametric test was used to assess statistical differences between groups for continuous variables. For the screening of the variables, univariable logistic regression was used with a P value criterion of .05. In multivariable logistic regression, variables achieving statistical significance in univariable logistic regression were further analyzed using a purposeful variable selection strategy that included the exclusion of variables with the highest P value one at a time.27
Because the sample size is small, the median estimates and ORs of the multivariable logistic regression model were also obtained using 1000 bootstraps. Diagnostic performance metrics included the area under the receiver operating characteristic (ROC) curve, accuracy, sensitivity, and specificity. Calibration was assessed with the Brier score. P values < .05 were regarded as statistically significant. The Cohen κ or intraclass correlation coefficient was used to assess the reliability of predictors between independent raters, depending on the data type.
RESULTS
Baseline Characteristics
A total of 24 patients with a diagnosis of PM and 85 patients with a diagnosis of PitNET who underwent pituitary MR imaging examinations were assessed for eligibility. A total of 13 cases were excluded from the study. Ultimately, 22 patients with PM (8 women; mean age, 49.5 [SD, 13] years) and 74 patients with PitNET (36 women; mean age, 50.1 [SD, 11] years) who met the inclusion criteria were enrolled (Fig 2).

Flow chart of the study.
There was no statistically significant distributional difference in age or sex between the 2 groups (P = .626 and P = .440, respectively). The mean maximum tumor size was 26.6 (SD, 8.8) mm (range, 12–48 mm) for the PitNET group and 26.9 (SD, 7.5) mm (range, 14–39 mm) for the PM group (P = .883). In total, 44 (59%) PitNETs and 15 (68%) cases of metastasis had a control MR imaging. The median control MR imaging interval was 10.5 months (interquartile range, 19.6 months; range, 6–54 months) in the PitNET group and 2.5 months (interquartile range, 4.2 months; range, 0.5–12 months) in the PM group. Demographic features are presented in the Online Supplemental Data in detail. The detailed results of tumor location analysis and endocrine features can be found in the Online Supplemental Data.
Primary Malignancy
The Online Supplemental Data provide a detailed list of the histopathologic results of primary tumors of metastases to the pituitary gland. Lung cancer was the primary tumor in 41% of all cases (n = 9/22) and served as the primary origin in 50% of affected male patients. Figure 3 shows an example of a histomorphologic view of lung cancer metastasis to the pituitary gland with a rapid growth on follow-up MR imaging. The second most prevalent primary tumor was breast cancer (n = 3/22; 13.6%), followed by unknown cancer (n = 3/22; 13.6%), and colorectal cancer (2/22; 9.1%). The youngest patient with PM was an 18-year-old male patient (primary, Ewing sarcoma), and the oldest was a 70-year-old female patient (primary, breast cancer).

Histomorphologic view of a 57-year-old male patient with lung adenocarcinoma metastasis into the pituitary gland, H&E, ×200. A and C, Positive staining of the tumor cells with thyroid transcription factor-1 immunohistochemistry supporting a pulmonary origin, H&E, ×200. Preoperative sagittal postcontrast T1WI of the same patient demonstrates rapid growth (arrows) in the follow-up period (B) compared with the MR imaging performed 12 months ago (D).
Univariate Analysis of Features
For the analysis of group differences, 13 MR imaging features and 4 clinical/epidemiologic features were assessed. A statistically significant difference in their distribution was observed between the groups for 10 MR imaging features (P < .001 for most of the features) and the clinical feature history of cancer (P < .001). No statistically significant difference between the groups was observed for the features of adjacent bone invasion, enhancement homogeneity, and enhancement degree (P = .686, P = .792, and P = .318, respectively). The details are presented in the Online Supplemental Data.
Univariable Logistic Regression
In this analysis, the presence of the following 5 MR imaging features and a history of cancer showed statistical significance: rapid growth on control MR imaging (with a reference level of unclear), irregular infiltrative contour, masslike or nodular expansion of pituitary stalk, edema along the visual pathway, and cavernous sinus invasion. The outcomes of univariable logistic regression analysis are presented in the Online Supplemental Data.
Multivariable Logistic Regression
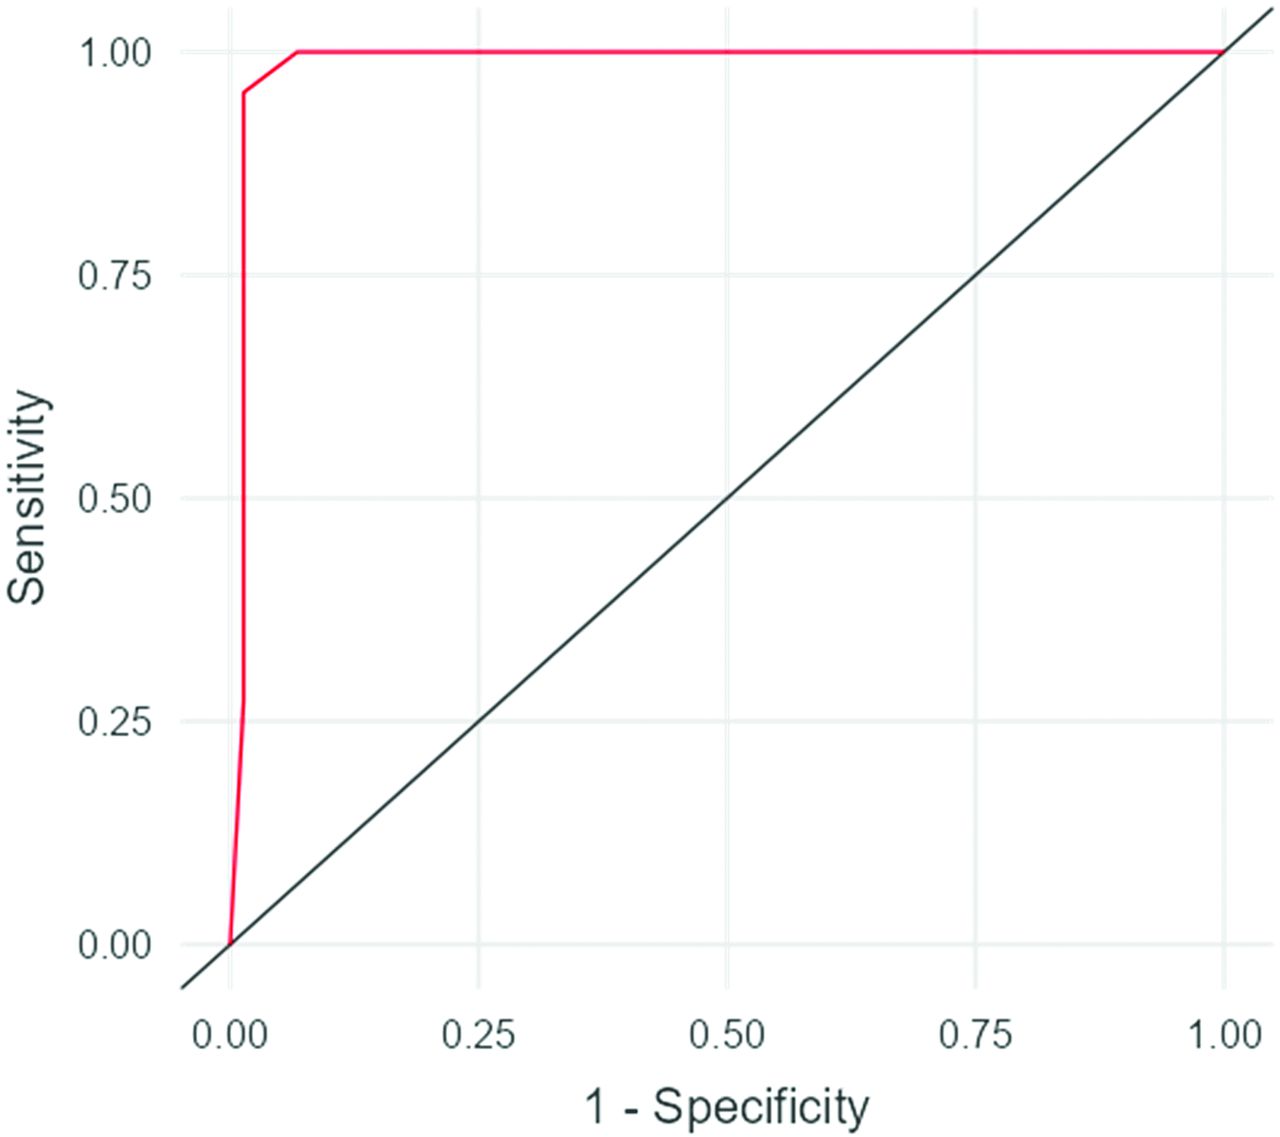
First, 10 imaging variables and 1 clinical variable with statistical significance in the univariate analysis were included in the multivariable analysis, and this approach revealed no independent predictors but resulted in perfect predictive ability (ie, area under the curve [AUC], 1). However, this approach was not adopted due to the high risk of overfitting, considering its dimensionality. Then, in multivariable logistic regression, the 5 MR imaging features and 1 clinical feature showing statistical significance in the univariable analysis were included. By means of adopting the purposeful variable selection strategy detailed in the Materials and Methods, the following 3 features showed statistical significance as independent predictors: rapid growth on control MR imaging (with reference level of unclear), masslike or nodular expansion of the pituitary stalk, and a history of cancer (P = .034, P = .011, and P = .003, respectively). Multivariable logistic regression analysis results are shown in Table 1. A new and final model based on these 3 features (Table 1) achieved an AUC, accuracy, sensitivity, and specificity of 0.987 (95% CI, 0.964–1), 97.9% (95% CI, 92.7%–99.8%), 95.5% (95% CI, 77.2%–99.9%), and 98.6% (95% CI, 92.7%–100%), respectively. The Brier score was 0.025, indicating very good calibration. The Online Supplemental Data presents bar plots of independent predictors. Figure 4 and the Online Supplemental Data show the ROC curve and the nomogram of the final model for practical use, respectively. Table 2 presents the confusion matrix.

ROC curve of the final model.
Multivariable logistic regression analysis
Confusion matrix of the final model
Interobserver Agreement Analysis
There was an almost perfect interobserver agreement between the 2 radiologists’ qualitative assessments in identifying the independent predictor (Cohen κ = 1 for masslike or nodular expansion of the pituitary stalk). The Online Supplemental Data present further details and the results of other evaluated qualitative variables. The intraclass correlation coefficient value for the only quantitative data, which was the maximum tumor size, was 0.972 (95% CI, 0.958–0.981).
DISCUSSION
In this 2-center retrospective study, we aimed to distinguish PMs from PitNETs on the basis of conventional pituitary MR imaging and clinical features. We identified 3 independent predictors: rapid growth on control MR imaging, masslike or nodular expansion of pituitary stalk, and a history of cancer. We developed a multivariable logistic regression model based on these 3 features and found a satisfactory predictive performance with an AUC, accuracy, sensitivity, specificity, and Brier score of 0.987, 97.9%, 95.5%, 98.6%, and 0.025, respectively.
To the best of our knowledge, there is no literature on the differentiation between PMs, which are critically important masses in the sellar region, and PitNETs. Although PMs have been increasingly reported during the past few decades, nearly all of the literature on this subject consists of single case reports or small case series.6,9,10,13⇓–15,17,23 The primary advantage of our study is its differentiation of these 2 entities through statistical analysis, which distinguishes it from previous literature, and its successful diagnostic performance. By means of the data we have shared, the identification of a metastasis to the pituitary gland can be performed with high predictive performance, thereby enabling the earlier detection of the primary tumor origin. Furthermore, we anticipate that the findings we have presented will be taken into consideration in the treatment decision-making process in cases, especially, in which surgery is declined or not feasible.
Distinguishing PM from pituitary adenomas has critical importance due to major differences in treatment strategies. While follow-up or transsphenoidal surgery is the primary treatment method for adenomas, treatment strategies for PM vary widely. In a recent article written by Hong et al28 analyzing the treatment outcomes of 48 cases of PM, various treatment methods were used, including surgical resection, single-session stereotactic radiosurgery, hypofractionated stereotactic radiosurgery, external beam radiation therapy, standard chemotherapy without surgery or radiation therapy, and palliative care. In their study, a total of 14 patients (29%) underwent surgery. Among them, transsphenoidal surgery was performed in 13 cases, while in 1 patient, a transcranial approach was used to resect both the PM and the temporal lobe mass simultaneously. This study revealed whether the metastasis was solitary or nonsolitary and whether the choice of treatment method (surgery and/or radiation therapy) for the selected population was associated with patients’ overall survival.28
PMs are frequently discussed in case reports and series, particularly regarding tumor localization. They tend to affect the neurohypophysis more than the adenohypophysis, likely due to differences in blood supply.3,16 In our study, involvement of the entire sella was seen in more than one-half of cases, possibly due to larger tumor sizes. Epidemiologically, PMs often originate from lung (27.7%), breast (18.7%), and renal (14.5%) cancers, with no sex predilection and typically affecting older individuals.17 Our study cohort had a slightly lower average age (49.5 years) and a male predilection (64%), possibly influenced by the cohort size. This might be related to the limited number of patients with PM in our cohort, which may skew such demographic results.
This study has some limitations. First, although it differs from much of the relevant literature in including a relatively larger population with PM, we consider the number of cases to be a limitation. This was inevitable given the low incidence of PM. Previous research on this topic is restricted to case reports and case series in the literature. Nevertheless, we believe that our findings need to be supported by larger prospective studies. Second, although most of the primary sites consisted of lung cancer, the primary tumor group was heterogeneous and comprised various subtypes. Third, follow-up MR imaging was missing in some cases. Fourth, due to the retrospective nature of the study, follow-up intervals were not standardized in patients who had follow-up MR imaging. Fifth, given the retrospective nature of the study, the frequent presence of missing values in clinical data (ie, diabetes insipidus, visual dysfunction) has directed the focus of this study toward radiologic features rather than clinical symptoms. Sixth, the study did not solely include cases of single metastases to the sellar region. Seventh, our model was not tested on external data. However, we also performed a powerful bootstrapping method in the evaluation of the multivariable model in addition to the native one. Finally, the class imbalance was evident due to the rarity of the PMs.
CONCLUSIONS
We found 2 imaging features obtained from pituitary MR imaging (ie, rapid growth on control MR imaging and masslike or nodular expansion of pituitary stalk) with the clinical variable of history of cancer that had satisfactory performance characteristics, making them potential discriminators between PMs and PitNETs. In cases in which differentiation between PMs and PitNETs poses a challenge, the results of this study may help with the diagnosis. Furthermore, multicenter research with a larger sample size is needed to confirm our findings.
Footnotes
Disclosure forms provided by the authors are available with the full text and PDF of this article at www.ajnr.org.
References
- Received January 18, 2024.
- Accepted after revision March 14, 2024.
- © 2024 by American Journal of Neuroradiology


Jump to section
Related Articles
Cited By...
- No citing articles found.