
Abstract
BACKGROUND AND PURPOSE: While Graves disease is the most common cause of extraocular muscle enlargement, case reports have also associated growth hormone-secretory pituitary adenomas with this same phenomenon. We investigated the prevalence and response to treatment of extraocular muscle enlargement in patients with growth hormone-secretory pituitary adenomas.
MATERIALS AND METHODS: We retrospectively reviewed extraocular muscle sizes using MR imaging in patients with growth hormone–secretory pituitary adenomas who underwent a transsphenoidal surgical resection compared with a matched control group with nonsecretory pituitary adenomas. Descriptive and comparative statistics were used to evaluate patient characteristics and extraocular muscle sizes between the 2 groups.
RESULTS: We identified 16 patients who presented with growth hormone–secreting pituitary adenomas and underwent transsphenoidal surgical resection from 2010 to 2019. The average diameter of the extraocular muscle at the time of diagnosis for the group with growth hormone-secretory pituitary adenomas was larger than that in the control group (4.7 versus 3.8 mm, P < .001). Nine patients achieved insulin-like growth factor 1 level normalization at a median of 11.5 months before their most recent MR imaging evaluation. The average size of the extraocular muscles of patients who achieved a normalized insulin-like growth factor 1 was smaller compared with those that did not (difference, 0.7 mm; 95% CI, 0.3–1.2 mm; P < .001), approaching the size of extraocular muscle in the control group.
CONCLUSIONS: We describe a high prevalence of extraocular muscle enlargement in patients with growth hormone–secreting pituitary adenomas. Additionally, we note that the size of extraocular muscles decreased with associated improvement in the biochemical control of acromegaly.
ABBREVIATIONS:
- EOM
- extraocular muscle
- GH
- growth hormone
- IGF-1
- insulin-like growth factor 1
- TED
- thyroid eye disease
- TSS
- transsphenoidal surgical
- ULN
- upper limit of normal
Acromegaly is an uncommon disease, with an incidence of 3–4 per million per year, characterized by excessive secretion of growth hormone (GH)–inducing organomegaly.1 A GH-secreting pituitary adenoma causes 95% of described cases of acromegaly.2 The features of such disease are related to excessive growth due to elevated GH and insulin-like growth factor 1 (IGF-1). This, in turn, leads to stimulation of growth of many tissues, including skin, bone, viscera, and epithelial tissue leading to features such as prognathism, macroglossia, goiter, arthropathy, cardiomyopathy, skin tags, and colon polyps.3
Although a rare presentation of the disease process, acromegaly is associated with clinically relevant growth of orbital structures resulting in proptosis, increased corneal thickness, and even total ophthalmoplegia.4 The current literature is limited to case reports describing the association between acromegaly and extraocular muscle (EOM) enlargement, which, in turn, is related to the duration of the disease process as measured by levels of GH and IGF-1.5 This unrecognized finding of EOM enlargement on imaging studies may lead a clinician to perform multiple diagnostic tests investigating other causes of EOM enlargement such as thyroid eye disease (TED) associated with Graves disease or other inflammatory/neoplastic processes.
There is limited knowledge regarding the prevalence of EOM enlargement in patients with GH-secreting pituitary adenomas, the correlation of IGF-1 and EOM enlargement, or the efficacy of adenoma-directed treatment to halt or reverse EOM enlargement in this patient population. We present our institutional data to contribute to the understanding of this phenomenon.
MATERIALS AND METHODS
Study Design
We undertook a single-institution retrospective review of EOM size at diagnosis and last follow-up in patients with GH-secreting adenomas as measured by MR imaging. All included patients underwent MR imaging at the time of diagnosis and routinely at follow-up as per their managing physicians. We matched these patients (1:1) with patients with nonsecretory pituitary adenomas. This study was approved by our institutional board.
Patient Selection
We included consecutive patients from 2010 to 2019 who underwent a transsphenoidal surgical (TSS) resection for a GH-secreting pituitary adenoma. Patients were excluded if they had a history of Graves disease or signs/symptoms of TED, including the presence of laboratory-detected thyroid abnormalities (elevated Free T4). Patients were excluded if they could not undergo MR imaging. We matched (1:1) a control group of patients with nonsecretory pituitary adenomas to the patients with GH-secreting adenomas on the basis of age, sex, type of definitive treatment, and date of definitive treatment. All patients in the control group had clinically nonfunctioning pituitary adenomas. Patients were not included in the control group if they had, at any point, abnormal IGF-1 levels, which may be associated with a GH-secretory adenoma or treatment-associated hypopituitarism. Standard hormonal replacement of hypopituitarism did not cause exclusion in either group.
Laboratory Evaluation
IGF-1 was evaluated using quantitative chemiluminescent immunoassay. Laboratory assessment was outsourced to ARUP Laboratories (www.aruplab.com). The IGF-1 upper limit of normal (ULN) was defined as 2 SDs above the associated laboratory value adjusted by sex and age as presented by Shimon et al.6,7 A corresponding z score was reported with the IGF-1 laboratory value. A z score is the number of SDs that a given result is above (positive score) or below (negative score) the age- and sex-adjusted population mean. Results that are within the IGF-1 reference interval will have a z score between −2.0 and +2.0. IGF-1 laboratory findings were identified as abnormal if they were outside the above-stated reference range or had an associated z score of >2.0. A GH-secretory status of a pituitary adenoma was diagnosed per the following criteria: patients with a presenting IGF-1 of >1.2 times the ULN or between 1.0 × ULN and 1.2 × ULN with a serum GH nadir of >1 μ/l on oral glucose tolerance testing with associated symptoms of acromegaly. IGF-1 normalization (remission) following an operation and/or salvage management was defined as ≤1.0 × IGF-1 ULN in 2 different serum collections.
Treatment
All patient management took place at an academic medical center. Treatment decision and techniques were based on the most current international acromegaly management guidelines,8 and recommendations for adjuvant and salvage therapy were as per the managing neurosurgeon, radiation oncologist, and endocrinologist. All patients underwent a TSS resection. Radiation therapy was recommended for partial resection or identification of recurrent disease and was delivered in conventional fractionation (4500–5400 cGy in 25–30 fractions) or using a stereotactic radiosurgery technique (1400–2200 cGy in 1 fraction). Indications for salvage endocrine therapy included an elevated IGF-1 level or symptoms of acromegaly. Endocrine therapy included cabergoline, somatostatin receptor ligands, and pegvisomant.
Treatment-Response Evaluation
Patients were regularly evaluated for evidence of recurrent tumor with routine follow-up MR imaging every 6–12 months according to the Endocrine Society guidelines. Laboratory evaluation included IGF-1 level, random GH level, cortisol level, thyroid levels (thyroid stimulating hormone, T3, and T4), and other pituitary hormones as indicated. The response of EOM enlargement to treatment was evaluated by comparing the patient’s most recent MR imaging (following treatment completion) with their MR imaging at the time of diagnosis.
MR Imaging Technique
Patients underwent MR imaging of the sella for the initial evaluation or routine follow-up of their pituitary adenoma. MR imaging examinations were performed using 1.5T and 3T systems. The retrospective nature of the study and the various clinical setups did not allow standardization of sequences. The imaging protocols included coronal and sagittal T1-weighted image acquisitions of the pituitary gland, cavernous sinus, and orbital structures. The 2 most common protocols (encompassing 78.1% of the retrospectively reviewed MR images) were an inversion recovery protocol performed on a 1.5T system (section thickness/gap thickness = 1.0–2.0/1.0–2.0 mm; TR/TE/TI = 2000/8.7–20.0/800 ms) and a fast spin-echo protocol performed on a 3T system (section thickness/gap thickness = 2.5–3/3–3.5 mm; TR/TE = 400–500/8.4–20.0 ms).
EOM Measurement
MR images were processed with Change HealthCare Radiology Solutions, Version 12.4.1 (https://www.changehealthcare.com/enterprise-imaging/radiology/radiology-solutions), within which the annotation distance tool was used for measurements. The short-axis diameter of each muscle was measured at its maximum.9 Measurements were performed on magnified images to improve the accuracy of the measurements, with the same magnification for all MR images. A board-certified neuroradiologist (M.W.) and an endocrine fellow (D.A.A) analyzed the images independently and were found to have concordant measurements of EOM size. Physicians performing the measurements were not blinded to individual patient factors. Measurements of the diameter of the superior oblique muscle were found to be discordant between independent measurers and across patients and were thus removed from this analysis.
Statistical Analysis
Descriptive statistics were performed by calculating the frequencies of categoric variables and the median and range for continuous variables. Patient characteristics were compared using an independent-samples t test and a χ2 test. The level of significance was set at a P value < .05. EOM enlargement was defined as a greater than the 95% confidence interval of the control group. Statistical analysis was performed using SPSS software, Version 26 (IBM).
RESULTS
We identified 16 patients who presented with GH-secreting pituitary adenomas who underwent TSS resection from 2010 to 2019 (Online Supplemental Data). The median patient age at the time of the operation was 44 years (range, 25–62 years). Five patients (31%) were men and 11 (69%) were women. The median IGF-1 at diagnosis was 2.15 times the upper limit of the normal (range, 1.06–3.57). The median size of the identified pituitary adenoma at diagnosis was 19.5 mm (range, 7–42 mm), with 9 patients (56%) presenting with cavernous sinus involvement and optic chiasm abutment/compression. Nine patients (56%) were identified as having pituitary adenomas that co-secreted prolactin. All patients underwent TSS resection of their adenoma, and residual disease was identified on immediate postoperative MR imaging (representing a resection of local relapsed tumor) in 12 patients (75%). No patients reported symptoms of ophthalmoplegia, orbital pain, or diplopia; however, 6 patients (37.5%) reported headaches, 2 patients (12.5%) reported epiphora, and 2 patients (12.5%) reported bitemporal hemianopsia.
At a median follow-up of 37.4 months (range, 12.5–126.0 months), 14 patients (87.5%) with GH-secreting adenomas had a normalized IGF-1 level. Four patients (25%) had a normalized IGF-1 level within 3 months of the operation without additional medical management. The median time from diagnosis to salvage therapy, including salvage radiation therapy or endocrine therapy, was 14.7 months (range, 0–117.2 months). Twelve patients (75%) underwent salvage medical therapy including cabergoline (56%), lanreotide (50%), and pegvisomant (19%). Seven patients (44%) underwent salvage radiation therapy at a median 21.4 months (range, 4.1–117.2 months) after the operation.
The control group consisted of 16 patients matched for age and sex at the time of definitive local therapy. Compared with the patients with GH-secreting pituitary adenomas, the control group had larger pituitary adenomas at the time of diagnosis (19.5 versus 30.0 mm, P = .02). Consistent with the selection process, the patients with GH-secretory pituitary adenomas had a higher IGF-1/ULN (2.15 versus 0.44, P < .01) and a higher rate of prolactin co-secretion (56% versus 0%, P < .01) than the control group. There were no differences between the GH-secretory and control groups in the rate of cavernous sinus involvement (56% versus 75%, P = .458), optic chiasm abutment or compression (56% versus 63%, P = 1.00), Resection of local relapsed tumor as defined by gross residual disease identified on immediate postoperative imaging (75% versus 56%, P = .458), or the rate of salvage radiation therapy (44% versus 63%, P = .287).
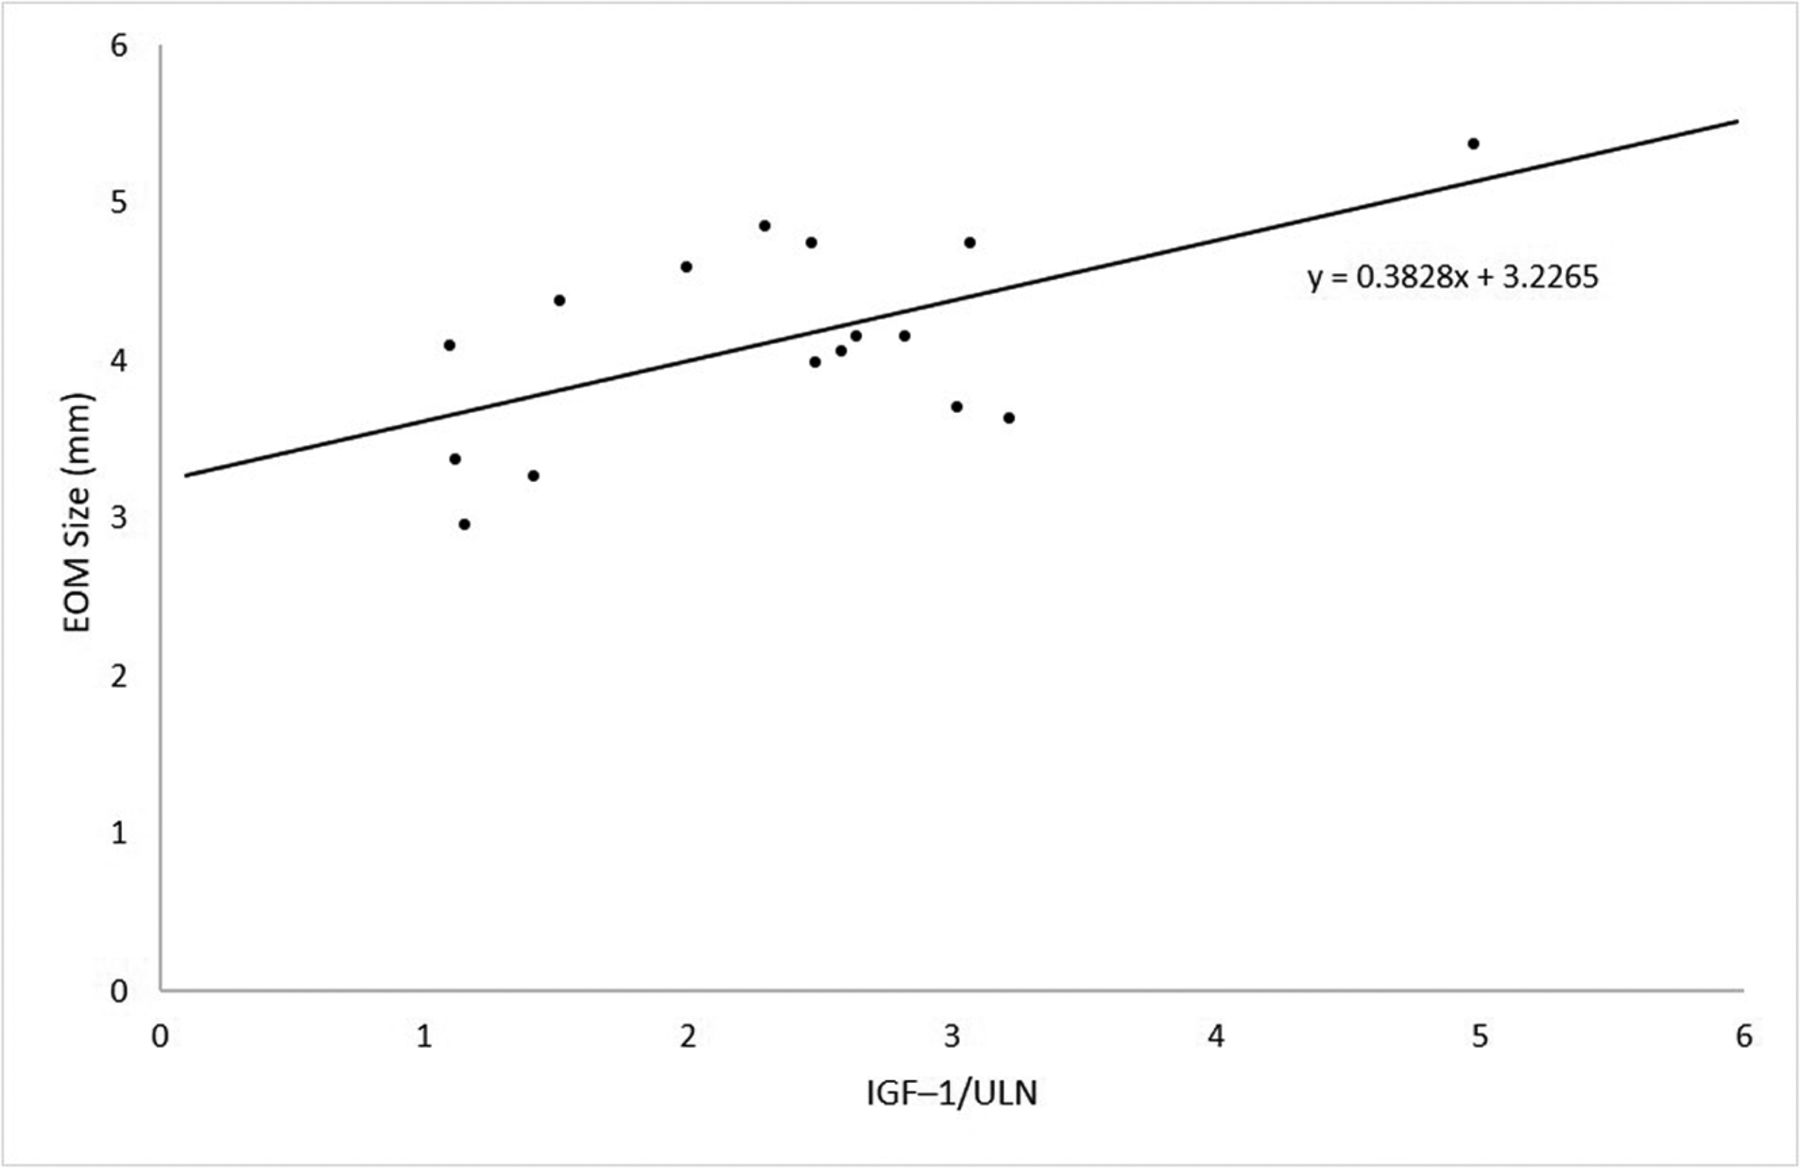
In patients with GH-secretory adenomas, the EOM size is positively correlated with IGF-1/ULN at diagnosis. The Pearson correlation of the relationship is 0.599 (P = .014). The average diameter of the EOM at the time of diagnosis for the group with GH-secretory pituitary adenomas was larger than that in the control group (4.7 mm; 95% CI, 4.4–4.9 mm versus 3.8 mm; 95% CI, 3.6–3.9, P < .001) (Fig 1). The medial rectus muscles demonstrated the greatest difference in size between the group with GH-secretory pituitary adenomas compared with the control group (difference, 1.2 mm; 95% CI, 0.7–1.6 mm; P < .001) (Table 1). Fourteen patients (87.5%) with GH-secretory pituitary adenomas had average EOM diameters greater than the 95% confidence interval of the control group. There was no association between cavernous sinus involvement and ipsilateral extraocular muscle enlargement (3.8 versus 3.7 mm, P = .660).

In patients with GH-secretory adenoma, EOM size is positively correlated with IGF-1/ULN at diagnosis. The Pearson correlation of the relationship is 0.599 (P = .014).
EOM sizes at the time of diagnosis and at time of most recent MR imaging evaluation of patients with GH-secreting pituitary adenomas compared with nonsecretory pituitary adenomas
The median time interval from their initial MR imaging to the most recent follow-up MR imaging was 32.5 months for the GH-secretory pituitary adenoma group compared with 74.8 months for the control group (P = .126) (Table 1). At the time of the most recent MR imaging, all patients had undergone resection of their pituitary adenoma and 9 patients (56.3%) had met acromegaly remission criteria. Of the 9 patients who met the remission criteria, the median time from IGF-1 normalization to the most recent MR imaging was 11.5 months. At the most recent MR imaging following treatment, the enlargement of EOMs in the GH-secretory group compared with the control group persisted (4.3 mm; 95% CI, 4.0–4.4.5 mm versus 3.6 mm; 95% CI, 3.5–3.8 mm; P < .001). However, patients with GH-secretory pituitary adenomas overall achieved a decrease in the size of EOM from their first MR imaging to their most recent MR imaging (difference, −0.4 mml 95% CI, −0.7–0.0 mm; P = .037) (Table 2). While the lateral and inferior rectus muscles had a decrease in size (−0.6 and −0.4 mm, respectively), the decrease in size of the superior rectus muscle did not achieve statistical significance (−0.4 mm, P = .075) and no decrease in the size of the medical rectus muscle was appreciated (−0.2 mm, P = .546).
Change in size of EOMs with time of patients with GH-secreting pituitary adenomas
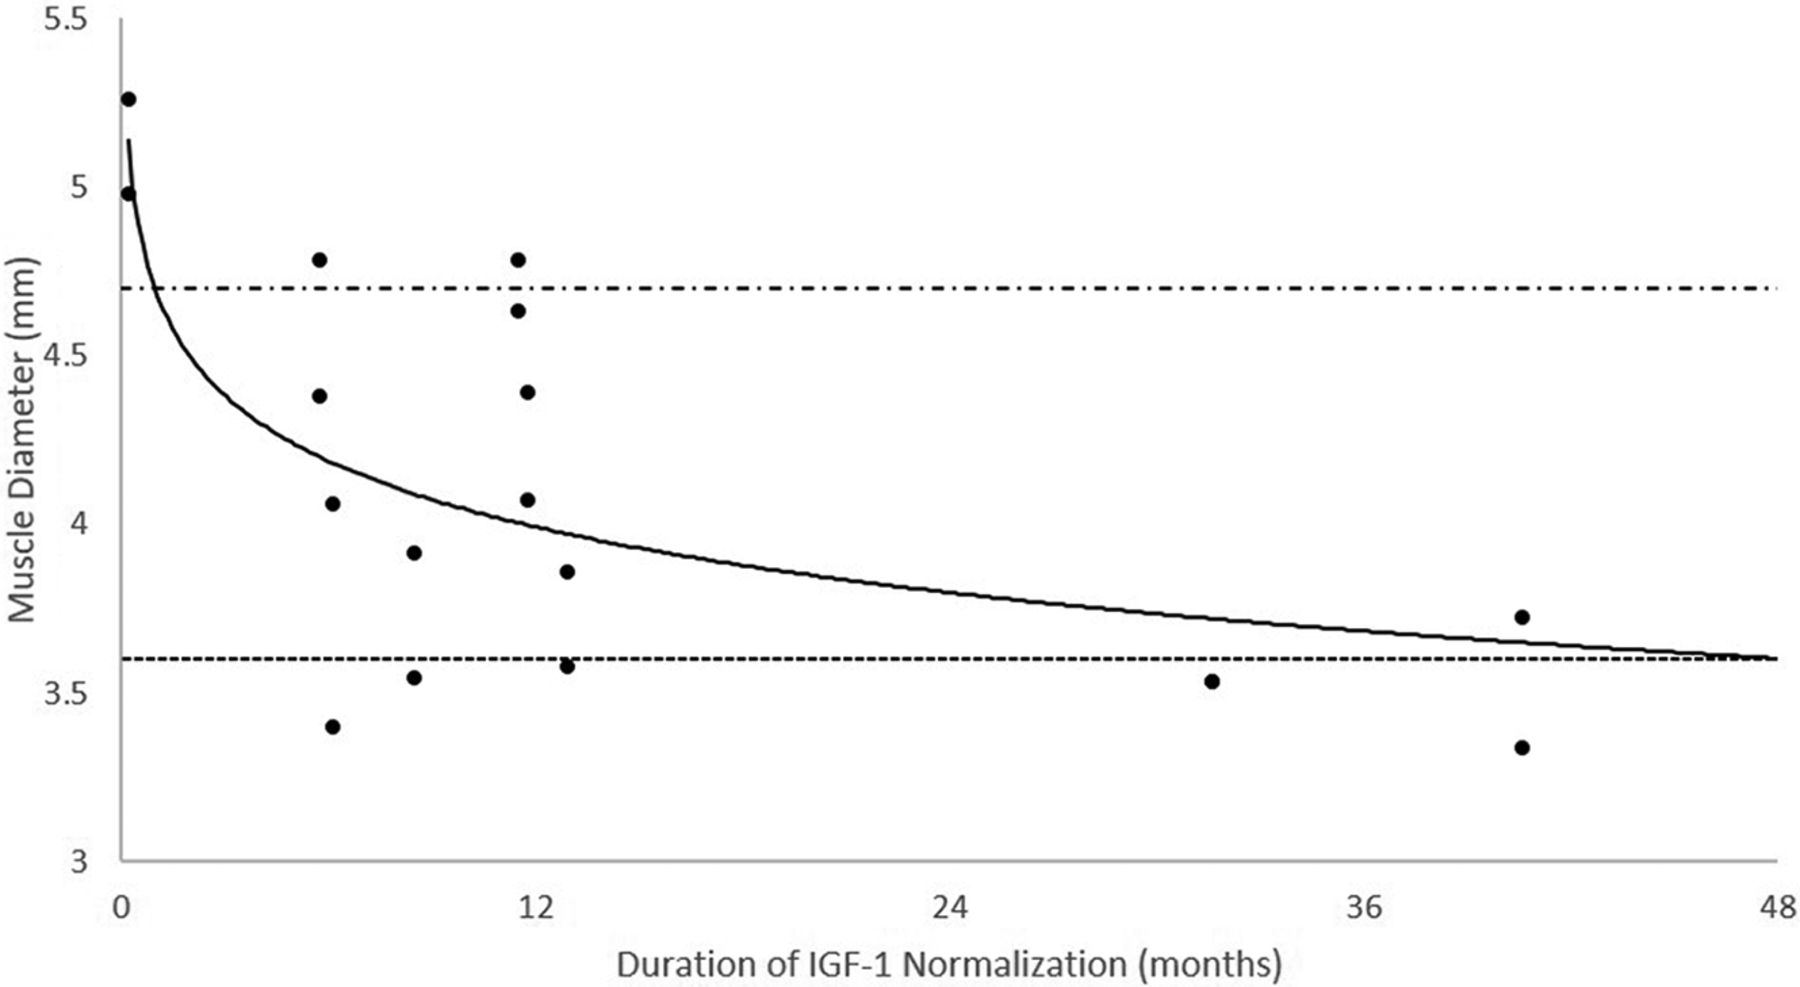
Of the 9 patients who achieved IGF-1 normalization before their most recent MR imaging, average EOM sizes were smaller compared with the group that did not achieve IGF-1 normalization (0.7 mm; 95% CI, 0.3−1.2 mm; P < .001) (Table 3). The EOM size of patients who achieved IGF-1 normalization approached that of the control population (Fig 2). Achieving IGF-1 normalization before the most recent MR imaging was associated with a lower average IGF-1/ULN at diagnosis (difference, 0.88; 95% CI, 0.23–1.53; P = .010). Four patients (25%) with GH-secretory pituitary adenomas experienced further growth of their EOM diameter at the time of their most recent MR imaging (relative change, 0.5 mm; range, 0.0–1.2 mm), of whom only 1 patient did not achieve a normalized IGF-1 by the time of the last follow-up.
Patients with GH-secretory pituitary adenomas who did or did not achieve a normalized IGF-1 level before their most recent MR imaging

EOM size in patients who achieved normalization of the IGF-1 before their most recent MR imaging. The average EOM size appears to decrease as the duration (months) of IGF-1 normalization increases. The alternating dashed/dotted line represents the average EOM size (4.7 mm) in patients who did not achieve IGF-1 normalization before their most recent MR imaging. The dashed line represents that average EOM size (3.6 mm) in patients without acromegaly at the time of their most recent MR imaging.
DISCUSSION
This is the first study that has systematically reported the prevalence of EOM enlargement in patients with GH-secretory pituitary adenomas compared with a control group. Most patients (87.5%) with GH-secretory pituitary adenomas with or without other symptoms of acromegaly had EOM enlargement compared with the control group. Normalization of IGF-1 was associated with a decrease in EOM size. An analysis of the duration of IGF-1 normalization and the timing of follow-up imaging suggested that EOM size approaches the average size of the matched cohort, given sufficient time for biochemical control. Limited follow-up and persistent elevation of IGF-1 levels in a subset of the population with the most recent MR imaging may limit our observation that EOM size did not decrease in the entire cohort after surgical resection. There is scant description on the prevalence and management of EOM enlargement associated with acromegaly in the published literature. Pozzo et al10 described a series of 10 patients with acromegaly, in which 8 patients had extraocular muscle enlargement identified on CT. Apart from this case series, we identified 4 published case reports of 6 patients (age range, 23–60 years) with symptomatic EOM enlargement associated with acromegaly published from 1962 to 2013. Associated symptoms at the time of presentation included proptosis, ptosis, epiphora, and lower eyelid edema. Our study contributes to the published literature of acromegaly-associated extraocular enlargement detectable by MR imaging.10⇓⇓-13
Clinically identified EOM enlargement even in the setting of a GH-secretory pituitary adenoma has historically required an expensive and time-consuming investigation of a differential diagnosis including TED. Our findings further support the association between EOM size and GH-secretory pituitary adenomas and suggest that beyond obtaining free T4 and thyroid-stimulating hormone measurements (which is a part of routine assessment of patients with pituitary adenomas), further evaluation of EOM enlargement may be of low clinical yield. Furthermore, our findings suggest the reversibility of the EOM size with effective adenoma-directed surgical and appropriate salvage medical management. Nevertheless, the reversibility of GH-associated organomegaly is debated because the Acromegaly Consensus Conference has reported that in patients with acromegaly, comorbidities may not remit even when full biochemical control is achieved.5,14,15
Although the most common cause of EOM enlargement is Graves disease–associated TED, our study demonstrates a high prevalence of EOM among patients with GH-secretory pituitary adenomas. A retrospective analysis of 60 patients with nonthyroidal enlarged EOMs performed by Patrinely et al16 demonstrated that only 3% of the cases were caused by acromegaly. However, the pathophysiology of EOM enlargement is largely understudied. In TED, overexpression of the insulin–like growth factor 1 receptor in fibroblasts and T-cells may lead to overactivation of T-cells playing an important part in the development of EOM enlargement across disease processes. It is hypothesized that IGF-1 promotes inflammation by cytokine activation and hyaluronic acid deposition, which causes edema and enlargement of the EOM. This process might also explain the EOM enlargement phenomenon that we identified in GH-secretory pituitary adenomas. To this point, the use of a novel medication recently approved for clinically active TED, teprotozumab, an insulin–like growth factor 1 receptor inhibitor, has demonstrated clinical improvement in diplopia and proptosis compared with a placebo, further confirming the importance of insulin–like growth factor 1 receptor expression and activity in such disease.17
In our study, we describe EOM enlargement in patients with GH-secretory pituitary adenomas relative to a control group, given the lack of normative measurements of orbital structures by MR imaging. Ozgen8,18 proposed criteria for the diameters of normal EOMs on MR imaging, with a proposed normal mean for diameters of the EOM as follows: medial rectus, 4.0 mm; lateral rectus, 3.7 mm; superior group, 4.4 mm; inferior rectus, 4.8 mm; and superior oblique, 3.2 mm. Measurements were similar to previously proposed normative measurements of the EOM by CT imaging.18 However, EOM measurements can differ depending on race and the measurement technique. Our average measurements of the control group’s lateral rectus muscles (lateral rectus, 3.6 mm; 95% CI, 3.3–3.9 mm) were less than the proposed normal means.
We recognize that our study has limitations. The retrospective nature and limited number of patients and short follow-up period limit the wide application of these results. We limited our analysis to objective radiologic findings rather than clinical findings, including measured proptosis and self-reported patient symptoms, which may have greater clinical implications. Furthermore, patients were evaluated using variable MR imaging protocols, not all of which included thin slices through the EOM. Finally, follow-up of the cohort of patients with abnormal IGF-1 levels may reveal further normalization of EOM size beyond what is reported in this study. Despite these limitations, we believe that this study contributes to our understanding of the effects of acromegaly on EOM thickness and both the incidence and reversibility of this finding.
CONCLUSIONS
Notwithstanding the limitations of this study, we identified a strong association between EOM enlargement and the GH-secretory status of pituitary adenomas. We conclude that further investigation of alternative causes of EOM enlargement may be of limited clinical utility in this population. Our data also suggest the potential reversibility of EOM enlargement with pituitary adenoma–directed treatment with salvage management indicated on the basis of IGF-1 elevation. These findings warrant further investigation with larger observation studies because they might assist in patient care and reduce the cost of extraneous testing.
Footnotes
B. Coutu and D.A. Alvarez are co-first authors.
Disclosures: Andjela Drincic—UNRELATED: Board Membership: Corcept Therapeutics/WellCare, Comments: Advisory Board for Corcept Therapeutics on Cushing disease (it was >2 years ago), advisory board for WellCare (Medicaid) for population health related to diabetes management; Grants/Grants Pending: Toyota, Comments: grant for research on diabetes and driving*; Travel/Accommodations/Meeting Expenses Unrelated to Activities Listed: Corcept paid travel money for Principal Investigator–related travel cost for the Cushing trial*; Other: I serve on the Endocrine Society writing committee for inpatient diabetes (no monetary compensation) and the Endocrine Society Special Program Committee developing educational activities (no monetary compensation) and was elected to the Pituitary Society Centers of Excellence Committee (no monetary compensation); I am a Principal Investigator for clinical trial in acromegaly with Chiasma (no personal financial gain) and for Cushing medication with Corcept. *Money paid to the institution.
References
- Received December 11, 2020.
- Accepted after revision September 17, 2021.
- © 2022 by American Journal of Neuroradiology


