
Abstract
BACKGROUND AND PURPOSE: The spinal cord is subject to a periodic, cardiac-related movement, which is increased at the level of a cervical stenosis. Increased oscillations may exert mechanical stress on spinal cord tissue causing intramedullary damage. Motion analysis thus holds promise as a biomarker related to disease progression in degenerative cervical myelopathy. Our aim was characterization of the cervical spinal cord motion in patients with degenerative cervical myelopathy.
MATERIALS AND METHODS: Phase-contrast MR imaging data were analyzed in 55 patients (37 men; mean age, 56.2 [SD,12.0] years; 36 multisegmental stenoses) and 18 controls (9 men, P = .368; mean age, 62.2 [SD, 6.5] years; P = .024). Parameters of interest included the displacement and motion pattern. Motion data were pooled on the segmental level for comparison between groups.
RESULTS: In patients, mean craniocaudal oscillations were increased manifold at any level of a cervical stenosis (eg, C5 displacement: controls [n = 18], 0.54 [SD, 0.16] mm; patients [n = 29], monosegmental stenosis [n = 10], 1.86 [SD, 0.92] mm; P < .001) and even in segments remote from the level of the stenosis (eg, C2 displacement: controls [n = 18], 0.36 [SD, 0.09] mm; patients [n = 52]; stenosis: C3, n = 21; C4, n = 11; C5, n = 18; C6, n = 2; 0.85 [SD, 0.46] mm; P < .001). Motion at C2 differed with the distance to the next stenotic segment and the number of stenotic segments. The motion pattern in most patients showed continuous spinal cord motion throughout the cardiac cycle.
CONCLUSIONS: Patients with degenerative cervical myelopathy show altered spinal cord motion with increased and ongoing oscillations at and also beyond the focal level of stenosis. Phase-contrast MR imaging has promise as a biomarker to reveal mechanical stress to the cord and may be applicable to predict disease progression and the impact of surgical interventions.
ABBREVIATIONS:
- DCM
- degenerative cervical myelopathy
- ECG
- electrocardiography
- PCMR
- phase-contrast MR imaging
- RR
- R wave-to-R wave interval in the ECG
Degenerative changes of the cervical spine lead to cervical spinal stenosis, with consecutive spinal cord compression and degenerative cervical myelopathy (DCM), a common health burden in the elderly population.1 The pathophysiology of DCM is attributed to immediate (ie, direct or static) cord compression, spinal malalignment leading to altered cord tension, impaired vascular supply, and repeat dynamic injury.2⇓⇓-5 Dynamic spinal cord injury is often narrowed to segmental hypermobility; however, cardiac-related periodic cord motion may play a by far underestimated role in this pathophysiologic consideration. The cervical spinal cord is subject to physiologic craniocaudal motion supposedly due to cardiac pulse wave dynamics, which can be readily assessed by phase-contrast MR imaging (PCMR).6,7 In a person with 70 heartbeats per minute, the spinal cord oscillates >100,000 times per day. In patients with DCM, increased spinal cord motion at the level of the cervical stenosis has been independently reported.8⇓⇓-11 However, due to differences in analysis techniques applied,8,10,11 results are not sufficiently comparable. Most interesting, increased spinal cord motion was associated with sensory deficits,8,10 impaired electrophysiologic readouts,10 and decreased functional scores in patients with DCM.11 While measurements of CSF flow have been shown to be less reliable and rather complex (ie, not easy to implement and run for clinical application) at the level of stenosis,11 spinal cord motion appears to be a more feasible alternative.
In summary, altered spinal cord motion provides a potential surrogate of spinal cord tissue distress, contributing to intramedullary damage even before it becomes clinically evident; therefore, it warrants further research to reveal mechanisms of cord damage in cervical spinal cord stenosis.
We hypothesiszed the following: 1) The cord motion pattern during the cardiac cycle is altered in patients with DCM, and 2) due to elastic properties of the spinal cord and its surroundings, increased cord motion will extend to segments remote from the spinal stenosis.
In axial PCMR, craniocaudal spinal cord motion within the cardiac cycle was tracked with an evaluation method established in healthy controls.6 In summary, cord displacement was measured 20 times during the cardiac cycle using a predefined ROI and corrected for the phase drift.
MATERIALS AND METHODS
Population
A consecutive series of 55 patients, prospectively recruited in the outpatient clinic of the University Spine Center, University Hospital Balgrist, Zurich, from October 2016 to August 2019, was used for analysis. Inclusion criteria for patients were a cervical spinal stenosis on MR imaging and clinical symptoms consistent with degenerative cervical myelopathy. Clinical symptoms of DCM comprised pain, sensory or motor deterioration in the upper or lower limbs, gait problems, or bladder dysfunction. Patients with any other neurologic disorder (identified by medical history and neurologic examination) were excluded. In patients with suspicion of any other neurologic disease (eg, radiculopathy at the lower limbs, polyneuropathy, CNS disorders), further examinations (eg, cranial MR imaging, electrophysiologic examinations) were conducted before study inclusion. Eighteen healthy subjects were randomly recruited (randomly chosen from a list) from a research data base of the University Hospital Balgrist, Zurich. Controls had neither neurologic symptoms nor a stenosis on MR imaging. The age for inclusion was 18–80 years. Exclusion criteria consisted of general MR imaging contraindications, epileptic seizures, mental illness, severe medical illness, and pregnancy.
Standard Protocol Approvals, Registrations, and Patient Consents
This prospective study was approved by the local ethics committee (Kantonale Ethikkommission Zurich, KEK-ZH 2012–0343, BASEC Nr. PB_2016-00623) and registered with clinicaltrials.gov (www.clinicaltrials.gov; NCT 02170155). All methods were in accordance with the relevant guidelines and regulations. Informed consent was obtained from all participants before study enrolment. Study data were collected and managed using REDCap electronic data capture tools (https://projectredcap.org/software/) hosted at Balgrist University Hospital, Zurich, Switzerland.12
Imaging
All subjects underwent a 3T MR imaging (Magnetom Skyra fit and Magnetom Prisma; Siemens), including axial T2-weighted (TE = 93 ms; TR = 3600 ms; section thickness = 3 mm; flip angle = 150°; FOV = 160 mm; bandwidth = 284 Hz/Px; base resolution = 320; phase resolution = 80%; spatial resolution = 0.5 × 0.5 × 3.0 mm; parallel acquisition techniques mode: generalized autocalibrating partially parallel acquisition 2) and axial 2D phase-contrast imaging encoding craniocaudal spinal cord motion (TE = 12.36 ms; TR = 60.84 ms; section thickness = 5 mm; flip angle = 10°; FOV = 140 mm; bandwidth = 355 Hz/Px; base resolution = 256; phase resolution = 50%; spatial resolution = 0.3 × 0.3 × 5.0 mm; parallel acquisition techniques mode: none; retrospectively cardiac gated using a finger clip). The velocity encoding value of the phase-contrast sequence was set to 2 cm/s based on previous findings of cord motion.6,8⇓⇓-11,13 During the cardiac cycle, the velocity signal was assessed within 20 time points, and 128 cardiac cycles were averaged per segment. Section orientation in phase-contrast imaging was adjusted perpendicular to the spinal cord. Axial T2-weighted imaging covered segments C2–C6 in all patients and segment C7 in 32 of 55 patients. In controls, axial T2-weighted imaging covered all cervical segments. Section orientation in axial T2-weighted imaging was adjusted to cover most of the spinal cord within the FOV perpendicularly. Breathing was not monitored in any participant. Total scanning time of the whole protocol was approximately 23 minutes.
In all patients, the C2 segment and the stenotic segment (loss of CSF signal in axial T2-weighted imaging ventral and dorsal to the spinal cord) (monosegmental stenosis), respectively, the most stenotic segment (defined as maximum spinal canal narrowing in patients with a multisegmental stenosis) were measured. The stenotic and most stenotic segment, respectively, were judged visually in T2-weighted imaging by 2 investigators (N.P., M.H.; consultant neurologists) well-experienced in neuroradiologic imaging with a focus on spinal cord disorders for several years. In all patients, depending on the available scanning time within the clinical setting, additional measurements in as many as possible other stenotic (multisegmental stenosis) and nonstenotic (monosegmental and multisegmental stenoses) cervical segments were obtained (randomly selected by the investigator [N.P., M.H., Table 1; on average, 2.8 segments per patient). In controls, all cervical segments were recorded.
Number of stenotic segments and number of sufficient phase-contrast measurements in patients
Imaging Analysis
Image analyses were performed using the Osirix free DICOM viewer (www.osirix-viewer.com) and the Horos free DICOM viewer (www.horosproject.org) by 2 investigators (N.P., M.H.). Imaging analyses were supported by a radiologist (R.S.) and a physicist (M.K.). Cervical segments were classified as “stenotic” or “nonstenotic” for analysis. A stenotic segment was defined as a loss of the CSF signal on axial T2-weighted imaging ventral and dorsal to the spinal cord. Segments with visible CSF signal in axial T2-weighted imaging ventral and/or dorsal to the spinal cord were defined as nonstenotic. Additional nonstenotic segments (in patients with monosegmental and multisegmental stenoses, respectively) were measured 1–4 segments apart and stenotic segments (in patients with a multisegmental stenosis) 1–2 segments apart from the next cervical stenosis. Phase-contrast images were visually controlled for artifacts before further analysis. In 55 patients, a total of 154 segmental PCMR measurements were obtained. Due to artifacts, 13 (8.4%) measurements (C2, 2/5 [3.6%]; C3, 1/17 [5.8%]; C4, 0/25; C5, 4/39 [10.3%]; C6, 6/16 [37.5%]; C7, 0/2) could not be used for analysis (Table 1). In 18 controls, no artifacts were observed.
Data Calculations and Parameters of Interest
In phase-contrast measurements, craniocaudal spinal cord motion was analyzed by a predefined ellipsoid ROI (30.52 mm2 in the Osirix Viewer; 30.56 mm2 in the Horos Viewer) midcentered into the spinal cord (Online Supplemental Data). In a subgroup of 10 consecutive patients (22 measurements; C2, ten measurements; C3, four measurements; C4, two measurements; C5, five measurements; C6, one measurement), motion was analyzed in the ventral, dorsal, and right and left aspects of the spinal cord (round ROI, 5.60 mm2; comparison between different regions within the spinal cord over all measurements; Online Supplemental Data). The predefined velocity encoding (2 cm/s) encoded in gray-scale values from −4096 to 4096 in the Osirix and Horos Viewers, respectively. The mean of the measured gray-scale values within the ROI in each of 20 time points during 1 cardiac cycle was used for calculation of the velocity. Velocity data were corrected for phase drift before further statistical analysis. Because phase-contrast imaging is a relative measure of motion, phase drift14 leads to an offset error of the raw data ending in misleading velocity values. Therefore, phase drift will result in over- or underestimation of the velocity measurements, so a correction for phase drift is needed. Phase drift correction was conducted analogous to healthy subjects previously.6 Corrected values were obtained by subtraction of the mean of all 20 velocity measurements within 1 cardiac cycle from the raw velocity value at each time point. Net motion of the spinal cord over 1 cardiac cycle is assumed to be zero (the start and end locations of the spinal cord are expected to be at the same position, assuming that the mean velocity has to be zero). Other approaches to velocity correction (ie, subtraction of velocity values of static tissue surrounding the spinal cord) were dropped due to low reliability previously.
Parameters of interest included the area under the curve (displacement) of the velocity signal over the whole cardiac cycle, within the first (time points 1–10) and second (time points 11–20) half of the cardiac cycle, and the spinal cord motion pattern. The area under the curve was calculated by stepwise summation of calculated squared areas (1/20 RR time multiplied by the mean of 2 consecutive velocity values). Negative velocity values were transformed to a positive value for calculation of the area under the curve. For the spinal cord motion pattern analysis, the velocity value in all 20 time points during 1 cardiac cycle was plotted for single values and the mean of all values per segment. The time point of the motion onset (first negative deflection) and the time point of the subsequent negative and positive motion peak, respectively, within the cardiac cycle (time points 1–20) were manually (visually) identified and analyzed.
Anatomic Measurements
In axial T2-weighted images, the spinal canal and spinal cord cross-sectional areas at the disc level were manually measured in all cervical segments. CSF space was calculated by the spinal canal cross-sectional area minus the spinal cord cross-sectional area.
Statistical Analysis
Statistical analysis was performed using SPSS (Versions 23 and 25; IBM). Measurements were pooled by the cervical segment because previous work showed differences in spinal cord motion among the cervical segments.6 Measurements in segments classified as stenotic and nonstenotic, respectively (pooled by the cervical segment; entire patient group, monosegmental and multisegmental stenoses; patients with monosegmental stenosis only; patients with multisegmental stenosis only), were compared with measurements in controls and between the patient groups. Additional analyses investigated the influence of the number of stenotic segments and how measures of cord motion changed in relation to the distance from the stenotic segment (pooled by the distance to the next stenotic segment or the number of stenotic segments; comparison between patient groups and controls). Metrics are reported as group mean [SD]. Between-group differences were calculated using the Mann-Whitney U test (anatomic measurements, motion measurements, body size, body weight, age, RR time/heart rate, motion onset and peaks) and the χ2 test (sex) if the number of measurements was at least 2 per group. For comparison of >2 groups, the Kruskal-Wallis test with the Bonferroni correction for multiple comparisons was used (distance to next stenosis, number of stenoses, motion in different spinal cord areas). Significance level of α was set to <.05.
Interrater Reliability
Interrater reliability in healthy volunteers has been reported in a previous study.6 Interrater reliability in patients was assessed by calculating intraclass correlation coefficients (2-way mixed model, absolute agreement, average measures). Two independent raters evaluated 34 consecutive patients using 2 different programs (rater 1, Osirix Viewer; rater 2, Horos Viewer) with manually configured ROIs with ellipsoid shapes of nearly the same size (30.52 mm2, Osirix Viewer; 30.56 mm2, Horos Viewer). Additionally, the intraclass correlation coefficients of anatomic measurements and the spinal cord pattern analyses were calculated.
Data Availability
The datasets generated and analyzed during the current study are available from the corresponding author on reasonable request.
RESULTS
Population
Fifty-five patients (37 men; 67.3%) and 18 healthy controls (9 men; 50%) were recruited. No differences between the groups were found for sex (P = .368), body size (P = .947), or RR time/heart rate (P = .263–0.961), but patients were younger (P = .024) and had a higher body weight (P = .007) (Table 2). In the patient group, 19 (34.5%) had a single stenosis and 36 (65.5%) had multiple stenotic segments (Tables 1 and 2). CSF spaces in patients’ segments classified as stenotic were significantly smaller compared with segments classified as nonstenotic (P < .001, Fig 1).
Basic demographics of the control and patient group

CSF space in controls and patients The CSF cross-sectional area (CSA) was smaller in patients with segments classified as stenotic (dark gray plots) compared with segments classified as nonstenotic (light gray plots). At C7 in 32 patients, the CSA was available, but no segment was classified as stenotic. The asterisk indicates P < .001.
Reliability of Anatomic and Spinal Cord Motion Measurements
The excellent interrater reliability of spinal cord motion measurements shown in controls previously6 could be confirmed in patients (intraclass correlation coefficient, 0.838–1.000; P ≤ .020; Online Supplemental Data). At C7, no calculation was possible due to the small number of measurements. Reliability was also good for anatomic measurements (intraclass correlation coefficient, 0.806–0.938; P < .001; Online Supplemental Data).
Altered Spinal Cord Motion Pattern in Patients
In the entire patient group (monosegmental and multisegmental stenoses), the craniocaudal and afterward caudocranial oscillation pattern was comparable with that in controls (stenotic segments: Fig 2; nonstenotic segments: Online Supplemental Data), but the magnitude of the oscillation was increased, corresponding to manifold higher mean displacement values at stenotic (C3 [n = 15]: 1.882 [SD, 1.278] mm versus 0.420 [SD, 0.113] mm; C4 [n = 18]: 2.149 [SD, 1.343] mm versus 0.484 [SD, 0.128] mm; C5 [n = 29]: 1.863 [SD, 0.915] mm versus 0.543 [SD, 0.159] mm; C6 [n = 5]: 2.021 [SD, 0.934] mm versus 0.491 [SD, 0.098] mm; P < .001; number of controls [n = 18] in all segments) but also nonstenotic (C2 [n = 52]: 0.852 [SD, 0.464 mm versus 0.362 [SD, 0.094] mm; C4 [n = 7]: 1.677 [SD, 0.956] mm versus 0.484 [SD, 0.128] mm; C5 [n = 6]: 1.725 [SD, 0.912] mm versus 0.543 [SD, 0.159] mm; C6 [n = 5]: 1.712 [SD, 0.640] mm versus 0.491 [SD, 0.098] mm; P ≤ .025; number of controls [n = 18] in all segments) segments (Fig 3 and Online Supplemental Data).

Spinal cord motion pattern in healthy controls and patients (stenotic segments). Spinal cord velocity values are displayed within 20 time points during the cardiac cycle in healthy controls (left column) and stenotic segments in patients (monosegmental and multisegmental stenoses, right column). Velocity values are pooled per cervical segment. Single measures are displayed in light gray; the black line represents the group mean.

Displacement values in controls and patients. Displacement values (entire cardiac cycle) are increased manifold in patients (monosegmental and multisegmental stenoses) in segments classified as stenotic (dark gray plots) and nonstenotic (light gray plots) compared with controls (white plots). In groups with only 1 measurement, no analysis was possible. Double asterisks indicate P < .001; asterisk, P = .015.
The same was true in subgroup analysis in patients with monosegmental ([n = 19]; stenotic segments: C4 [n = 4]: 2.015 [SD, 1.361] mm versus 0.484 [SD, 0.128] mm; C5 [n = 10]: 2.036 [SD, 1.271] mm versus 0.491 [SD, 0.098] mm; P < .001; nonstenotic segments: C2 [n = 18]: 0.719 [SD, 0.222] mm versus 0.362 [SD, 0.094] mm; C4 [n = 4]: 1.281 [SD, 0.790] mm versus 0.484 [SD, 0.128] mm; C5 [n = 4]: 1.818 [SD, 0.547] mm versus 0.543 [SD, 0.159] mm; C6 [n = 4]: 1.455 [SD, 0.326] mm versus 0.491 [SD, 0.098] mm; P < .001; number of controls [n = 18] in all segments) and, respectively, multisegmental ([n = 36]; stenotic segments: C3 [n = 14]: 1.924 [SD, 1.316] mm versus 0.420 [SD, 0.113] mm; C4 [n = 14]: 2.187 [SD, 1.388] mm versus 0.484 [SD, 0.128] mm; C5 [n = 19]: 1.772 [SD, 0.685] mm versus 0.491 [SD, 0.098] mm; C6 [n = 5]: 2.021 [SD, 0.934] mm versus 0.491 [SD, 0.098] mm; P < .001; nonstenotic segments: C2 [n = 34]: 0.922 [SD, 0.540] mm versus 0.362 [SD, 0.094] mm; C4 [n = 3]: 2.205 [SD, 1.035] mm versus 0.484 [SD, 0.128] mm; P ≤ .002; C5 [n = 2]: 1.540 [SD, 1.776] mm versus 0.543 [SD, 0.159] mm; P = 1.000; number of controls [n = 18] in all segments) stenoses in subgroups with >2 measurements (Online Supplemental Data).
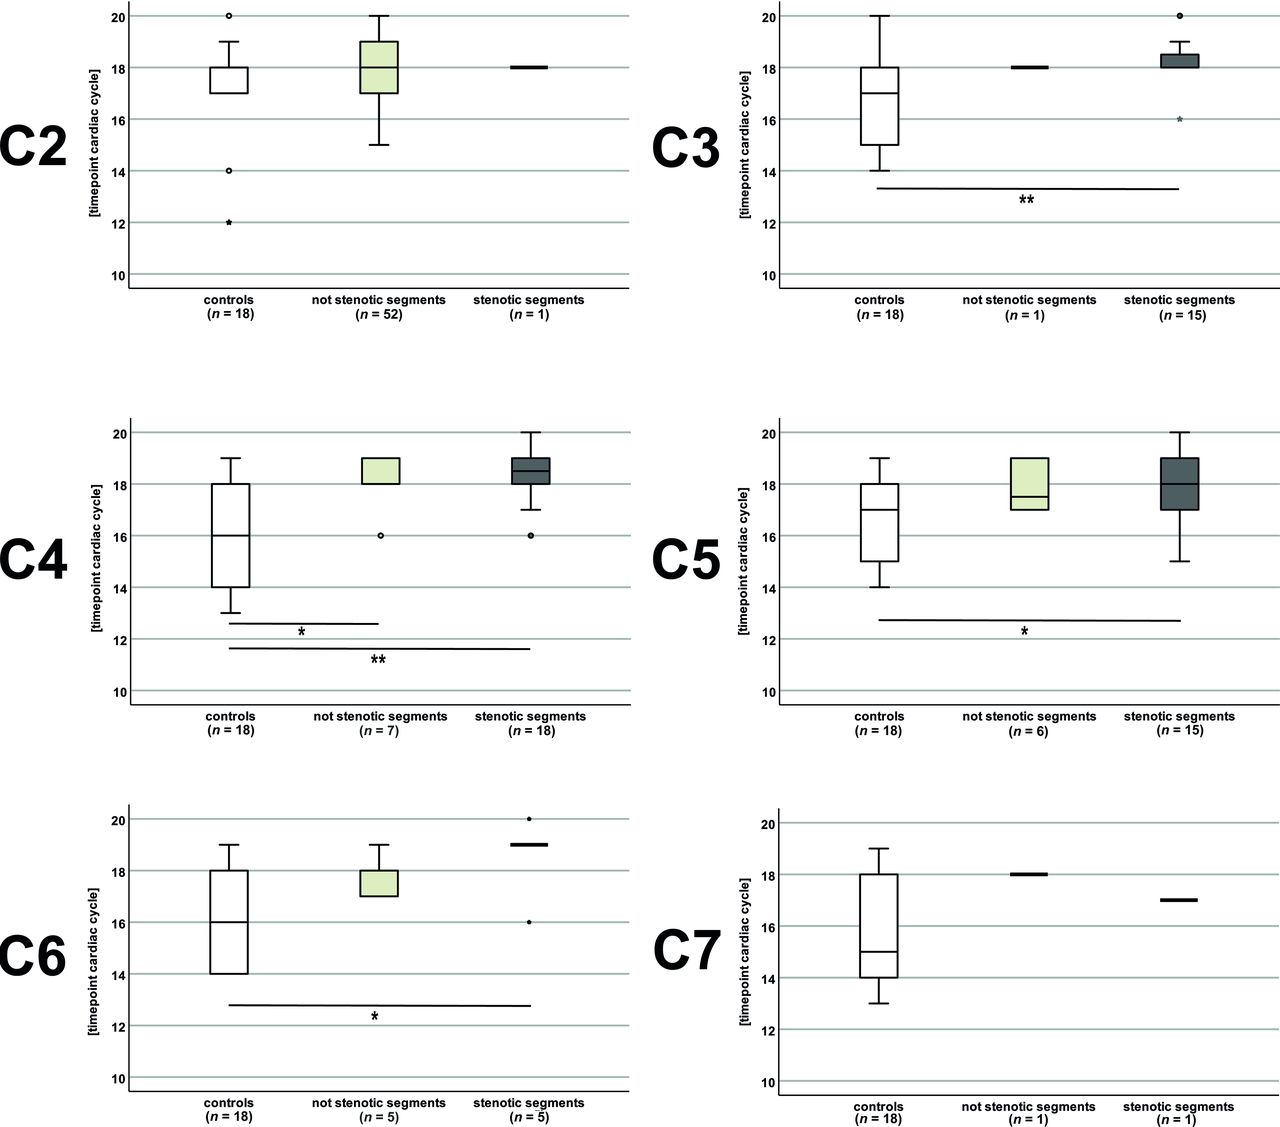
The detailed analysis of the velocity pattern did not show a difference in the timing of the motion onset (first negative deflection; stenotic segments: P ≥ .424; nonstenotic segments: P ≥ .326) and the subsequent negative velocity peak (stenotic segments: P ≥ .161; nonstenotic segments: P ≥ .074) between all patients (monosegmental and multisegmental stenoses) and controls in stenotic and nonstenotic segments (Online Supplemental Data). Most interesting, the mean positive velocity peak in the second half of the cardiac cycle in stenotic segments C3–C6 (time points: patients [entire patient group] versus controls (n = 18): C3 [n = 15]: 18.13 [SD, 1.13] versus 16.61 [SD, 1.85]; C4 [n = 18]: 18.33 [SD, 1.09] versus 16.11 [SD, 2.06]; C5 [n = 23]: 17.93 [SD, 1.13] versus 16.56 [SD, 1.85]; C6 [n = 5]: 18.60 [SD, 1.52] versus 16.17 [SD, 2.01]; P ≤ .018) and in the nonstenotic segment, C4 (patients, entire patient group [n = 7] versus controls [n = 18]: 18.14 [SD, 1.07] versus 16.11 [SD, 2.0]; P = .021) was prolonged in patients (Fig 4 and Online Supplemental Data).

Timing of the positive motion peaks in controls and patients. The positive motion peak was delayed in patients (monosegmental and multisegmental stenoses) in segments classified as stenotic (dark gray plots) at C3, C4, C5, and C6 and in segments classified as nonstenotic (light gray plots) at C4 compared with controls (white plots). In groups with only 1 measurement, no analysis was possible. Double asterisks indicate P < .01; asterisk, P ≤ .021.
Subgroup analysis in patients with monosegmental and multisegmental stenoses, respectively confirmed a delay of the mean positive motion peak in patients with a multisegmental stenosis (time points, patients versus controls [n = 18]: stenotic segments: C3 (n = 14): 18.14 [SD, 1.17] versus 16.61 [SD, 1.85]; C4 [n = 14]: 18.43 [SD, 1.16] versus 16.11 [SD, 2.06]; C5 [n = 19]: 18.26 [SD, 0.99] versus 16.56 [SD, 1.85]; C6 [n = 5]: 18.60 [SD, 1.52] versus 16.17 [SD, 2.01]; P ≤ .015; nonstenotic segment: C4 [n = 3]: 18.67 [SD, 0.58] versus 16.11 [SD, 2.06]; P = .035; Online Supplemental Data).
Additionally, the mean negative motion peak in patients with multisegmental stenoses was delayed at C4 in nonstenotic segments compared with controls (n = 3; 13.67 [SD, 0.58] versus 12.28 [SD, 0.96]; P = .024). In patients with a monosegmental stenosis, a trend for a delay of the mean positive velocity peak could be found at C4 in stenotic (n = 4; 18.00 [SD, 0.82] versus 16.11 [SD, 2.06]; P = .141) and nonstenotic (n = 4; 17.75 [SD, 1.26] versus 16.11 [SD, 2.06]; P = .166) segments compared with controls. While hardly any motion could be observed within the first half (time points 1–10) of the cardiac cycle in healthy controls (reflecting a “resting phase”), spinal cords in most patients showed continuous upward motion during this part of the cycle. This was observed at the stenosis (Fig 2) and also at nonstenotic segments (Online Supplemental Data). Displacement separately calculated for the first (time points 1–10) and the second half of the cardiac cycle (time points 11–20) also revealed highly increased values between patients (monosegmental and multisegmental stenoses) and controls in both parts in stenotic and nonstenotic segments (P ≤ .015; Online Supplemental Data). The same was true in subgroup analysis in patients with monosegmental (P ≤ .003; Online Supple-mental Data) and multisegmental (P ≤ .002; Online Supple-mental Data) stenoses, respectively, in patient groups with >2 measurements.
Motion Differences between Segments Classified as Stenotic and Nonstenotic
No differences of the displacement or the timing of the spinal cord motion pattern could be found between measurements in stenotic and nonstenotic segments in the entire patient group (monosegmental and multisegmental stenoses) and the subgroups with monosegmental and multisegmental stenoses, respectively.
Motion Differences between Patients with Mono- and Multisegmental Stenoses
At C2 in patients with a multisegmental cervical stenosis (n = 34; distance to next stenosis: 1 segment/stenosis, C3, n = 20; two segments/stenosis, C4, n = 6; three segments/stenosis, C5, n = 8), displacement in the first half of the cardiac cycle was increased compared with patients with a monosegmental stenosis (n = 18; distance to next stenosis: 1 segment/stenosis, C3, n = 1; two segments/stenosis, C4, n = 5; three segments/stenosis, C5, n = 10; four segments/stenosis, C6, n = 2) in nonstenotic segments (mean, 0.289 [SD, 0.210] mm versus 0.189 [SD, 0.085] mm; P = .048). This difference was lost in subgroup analysis with regard to the distance to the next stenosis (distance to next stenosis: 1 segment/stenosis, C3: monosegmental, n = 1; multisegmental, n = 20; no analysis due to low monosegmental group size; 2 segments/stenosis, C4: monosegmental, n = 5; multisegmental, n = 6; P = .429; three segments/stenosis, C5: monosegmental, n = 10; multisegmental, n = 8; P = .460; Online Supplemental Data).
In the analysis of the motion velocity pattern, a trend toward a delayed positive motion peak in patients with a multisegmental stenosis could be found at C2 in segments classified as nonstenotic (multisegmental [n = 34]; distance to next stenosis: 1 segment/stenosis, C3 [n = 20]; two segments/stenosis, C4, [n = 6]; three segments/stenosis, C5 [n = 8]: mean, 18.06 [SD, 1.09] versus monosegmental [n = 18]; distance to next stenosis: 1 segment/stenosis, C3, [n = 1]; two segments/stenosis, C4, [n = 5]; three segments/stenosis, C5, [n = 10]; four segments/stenosis, C6, [n = 2]: mean, 17.44 [SD, 1.10]; P = .063). In subgroup analysis with regard to the distance to the next stenosis, this trend could be seen at C2 in measurements 3 segments apart from the next stenosis (distance to next stenosis: 2 segments/stenosis, C4; monosegmental [n = 5] mean, 17.80 [SD, 0.84]; multisegmental [n = 6] mean, 18.17 [SD, 0.7]; P = .537; three segments/stenosis, C5; monosegmental [n = 10] mean, 17.30 [SD, 1.34]; multisegmental [n = 8] mean, 18.50 [SD, 0.93]; P = .068).
Motion Differences Regarding the Distance to the Next Stenosis and the Number of Stenotic Segments
Displacement at C2 in the entire patient group (monosegmental and multisegmental stenoses) in nonstenotic segments was increased with the proximity to the next stenotic segment (distance to next stenosis: 1 segment/stenosis, C3 [n = 21]: mean, 1.074 [SD, 0.622] mm; 2 segments/stenosis, C4 [n = 11]: mean, 0.769 [SD, 0.285] mm; 3 segments/stenosis, C5 [n = 18]: mean, 0.691 [SD, 0.166] mm; 4 segments/stenosis, C6 [n = 2]: mean, 0.420 [SD, 0.025] mm; P = .039, Fig 5A). Subgroup analysis in patients with a monosegmental and multisegmental stenoses, respectively, showed a corresponding trend (displacement in the entire cardiac cycle: monosegmental: [n = 18]; distance to next stenosis: 1 segment/stenosis, C3 [n = 1] 0.900 mm; 2 segments/stenosis, C4 [n = 5] mean, 0.819 [SD, 0.247]; mm; 3 segments/stenosis, C5 [n = 10] mean, 0.710 [SD, 0.247] mm; 4 segments/stenosis, C6 [n = 2] mean, 0.420 [SD, 0.024] mm; P = .113; multisegmental: [n = 34]; distance to next stenosis: 1 segment/stenosis, C3 [n = 20] mean, 1.082 [SD, 0.637] mm; 2 segments/stenosis C4 [n = 6] mean, 0.728 [SD, 0.330] mm; 3 segments/stenosis C5 [n = 8] mean, 0.667 [SD, 0.136] mm; P = .173; displacement at second half of the cardiac cycle: monosegmental: [n = 18]; P = .069; multisegmental: [n = 34]; P = .108, Online Supplemental Data).

Spinal cord motion at C2 regarding the distance to the next stenosis and the number of stenotic segments. In patients (monosegmental and multisegmental stenoses), displacement (entire cardiac cycle) differs with the distance to the next stenosis (A) and the number of stenotic segments (B).
Compared with controls, motion values in patients at the nonstenotic segment C2 were increased up to 3 segments apart from the next cervical stenosis (distance to next stenosis: 1 segment/stenosis, C3: multisegmental [n = 20]; P < .001; two segments/stenosis, C4: monosegmental [n = 5]; P ≤ .001; multisegmental [n = 6]; P ≤ .015, [P = .066 for displacement in the second half of the cardiac cycle]; 3 segments/stenosis, C5: monosegmental [n = 10]; P < .001; multisegmental [n = 8]; P < .001; Online Supplemental Data). The same was true in patients with a monosegmental stenosis in nonstenotic segments, C4 (n = 4; P < .001), C5 (n = 4; P < .001), and C6 (n = 4; P = .002) 1 segment apart from the next stenosis. In patients with a multisegmental stenoses in stenotic segments, C3 (distance to the next stenosis: 1 segment: [n = 9]; P < .001; 2 segments: [n = 4]; P < .001), and C5 (distance to next stenosis: 1 segment: [n = 14]; P < .001; 2 segments: [n = 5]; P < .001) up to 2 segments apart and in nonstenotic (n = 3, P = .002) and stenotic segments, C4 (n = 13; P < .001) and stenotic segments C6 (n = 4; P < .001) 1 segment apart from the next cervical stenosis motion was increased compared to controls. Additionally, displacement at C2 in nonstenotic segments was different according to the number of stenotic segments in the entire (monosegmental and multisegmental) patient group (number of stenotic segments: 1 [n = 18]: mean, 0.719 [SD, 0.222] mm; 2 [n = 20]: mean, 0.880 [SD, 0.415] mm; 3 [n = 10]: mean, 1.173 [SD, 0.743] mm; 4 [n = 4]: mean, 0.504 [SD, 0.097] mm; P = .036; Fig 5B). The same was true for the displacement within the first half of the cardiac cycle (number of stenotic segments: 1 [n = 18]: mean, 0.189 [SD, 0.085] mm; 2 [n = 20]: mean, 0.267 [SD, 0.168] mm; 3 [n = 10]: mean, 0.383 [SD, 0.287] mm; 4 [n = 4]: mean, 0.162 [SD, 0.080] mm; P = .036; P = .047). A subgroup analysis in the patient group with a multisegmental stenosis showed analogous results (n = 34; number of stenotic segments: 2 [n = 20]: mean, 0.880 [SD, 0.415] mm; 3 [n = 10]: mean, 1.173 [SD, 0.743] mm; 4 (n = 4): mean, 0.504 [SD, 0.097] mm; P = .029). While a trend toward higher motion values could be assumed with an increasing number of 1–3 stenotic segments, lower values could be observed in patients with 4 stenotic segments.
Motion Differences between Different Regions of the Spinal Cord
No motion differences could be found comparing the ventral, dorsal, and right and left aspects of the spinal cord (10 consecutive patients; 22 measurements; C2: 10 measurements; C3: four measurements; C4: two measurements; C5: five measurements; C6: one measurement; Online Supplemental Data).
DISCUSSION
This is the first study analyzing spinal cord motion in patients with a cervical spinal stenosis also remote from the stenotic segment, focusing on the motion pattern throughout the cardiac cycle and the impact of the distance to the next stenotic segment and the number of cervical stenotic segments. In addition to a previously reported increase of cord movement in cervical stenosis,7⇓⇓⇓-11,15 our findings revealed a propagation of increased motion to the adjacent cervical segments up to 3 segments apart from the next cervical stenosis and continuous (“restless”) spinal cord movement throughout the whole cardiac cycle in patients, reflecting an emerging pathophysiologic pattern. A resting phase without motion during the first half of the cardiac cycle, which could be observed in healthy controls, was lost in patients irrespective of and remote from the cervical level of stenosis. This finding suggests continuous and increased mechanical stress to the spinal cord tissue as a prominent and potentially contributing dynamic factor in DCM pathophysiology.1,3,16⇓⇓-19
Feasibility-Reliability
For feasibility, high interrater and test-retest reliability of the method was reported previously in healthy controls6 and could be confirmed in patients. Reliability across different scanners should be shown in future measurements.
Spinal Cord Motion Readouts
Increased segmental cord motion readouts at the level of stenosis are in line with previous work.8⇓⇓-11 However, the comparability of this work is limited due to different readouts (half amplitude,8 total displacement,10,11 maximum displacement,10 peak velocities,7,15 mean velocity,10 and velocity difference between cervical segments9) and different evaluation techniques (magnetic field strength,7⇓⇓⇓-11,13,15 ROIs,7⇓⇓⇓-11 velocity encoding,6⇓⇓-9,11,13 no correction for offset error/phase drift11), underlining the need for a standardized evaluation.
Motion Differences in Regard to the Distance to the Next Stenosis and the Number of Stenotic Segments
Patients with a multisegmental stenosis showed a higher displacement within the first half of the cardiac cycle at C2 compared with patients with a monosegmental stenosis, but this difference was lost in subgroup analysis in regard to the distance to the next stenosis and might, therefore, be mostly attributable to the high number of measurements with a proximate stenosis at C3 in the patient group with multisegmental stenoses. Motion at C2 was increased in regard to a higher number of stenotic segments (entire patient group and subgroup multisegmental stenoses) and the distance to the next stenosis (with a trend in subgroup analysis in patients with monosegmental and multisegmental stenoses, respectively). Due to the elastic properties of the spinal cord and its surroundings,20⇓-22 increased motion in the stenotic segment might, therefore, propagate to adjacent segments, ending in a further increased oscillation. Increased motion values compared with controls in nonstenotic segments at C2 up to 3 segments apart from the next stenosis support this hypothesis. However, it remains open why motion in patients with 4 stenotic segments was less compared with motion in those with a lower number of stenotic segments. Potentially, there might be a threshold of obstruction of the spinal canal, where spinal cord motion decreases.
Origin of Spinal Cord Motion
The origin of spinal cord motion was attributed to intracranial CNS and CSF pulsation related to the cardiac cycle,9,11,23⇓⇓⇓-27 breathing,28 and local factors, eg, arterial pulsation. Breathing only causes slower frequency spinal cord movements29,30 and was shown to have minor effects on CSF measurements within steady breathing conditions using cardiac-gated PCMR.31 Because patients and healthy controls in our study underwent no defined breathing protocol, breathing was not monitored systematically but is expected to have only minor effects. Increased spinal cord motion can be attributed to narrowed anatomic conditions inducing changes of fluid dynamics because correlations of higher motion with less CSF space and smaller spinal canal measures could be found in healthy controls6 and patients.8 These findings are comparable with CSF dynamics reported before,32,33 following the law of Hagen-Poiseuille.34 Previous studies also revealed a close interaction between CSF dynamics and spinal cord motion.11 However, CSF measurements at the level of cervical stenosis11 were considered less reliable. Local mechanisms (ie, arterial pulsation) are also affected in spinal stenosis due to the loss of the CSF buffer zone around the spinal cord. When we compared our measurements with those in other studies on spinal cord and cardiovascular motion using electrocardiography (ECG) triggering,7,9,35 a major influence on spinal cord motion could be attributed to the cardiac function,7 causing a strong craniocaudal oscillation shortly after the RR peak in the ECG. Motion readouts were correlated to the heart rate in healthy volunteers,6 underlining a relation to the cardiac action and local vascular pulsation. Most interesting, in a canine model, spinal cord oscillations diminished after transection of the local vascular support,36 speaking to the importance of local arterial pulsation for spinal cord motion. That spinal cord oscillations in conditions with stenosis occur with increased movement throughout the entire cardiac cycle suggests other influences, ie, altered CSF dynamics or elastic properties of the spinal cord and its surrounding structures.
Spinal Cord Motion Pattern
Spinal cord motion in healthy volunteers was shown to start with a strong craniocaudal oscillation shortly after the RR peak in the ECG.7 This caudal motion was followed by a cranial oscillation and subsequent caudal/cranial oscillations of different extents, with no motion at the end of the diastole.7 In line with these reports, hardly any motion was observed in our control group during the first half (time points 1–10) of the cardiac cycle (measured by peripheral pulse triggering), followed by a biphasic craniocaudal oscillation (Fig 6 and Online Video 1). In summary, in line with previous7 work, our findings show craniocaudal oscillations, with an onset shortly after the cardiac systole, extending into the cardiac diastole, but with zero motion at the end of the diastole under physiologic conditions. In cardiovascular MR imaging measurements simultaneously comparing 3 triggering methods (ECG, peripheral pulse, sonography), a temporal right shift of the velocity curve was reported when using a peripheral pulse trigger (about 60% of the RR interval) compared with the ECG trigger.35 These findings correspond well to the shifted spinal cord motion curve in our analysis, using a peripheral pulse trigger, with a motion onset at approximately 50%–55% of the cardiac cycle compared with earlier spinal cord motion studies using the ECG trigger.7,9 Analogous results across studies using various triggering criteria underline the technical robustness of measuring spinal cord motion with PCMR.

Comparison of physiologic and pathologic spinal cord motion. At C5 in a nonstenotic segment in a healthy control (A, axial T2-weighted), only moderate velocities can be observed in phase-contrast imaging with light gray shading of the cord (B, axial PCMR, red dotted circle). In contrast, in a patient’s stenotic segment (C, axial T2-weighted), extensively increased spinal cord motion velocity can be identified by black shading of the spinal cord (D; axial PCMR; red dotted circle). While the phase-contrast images (B, healthy control; D, patient) show the maximum caudal velocity, the velocity graphs (E, healthy control; F, patient) display the velocity at 20 time points during 1 cardiac cycle. While in physiologic conditions, only a moderate biphasic oscillation in the second half of the cardiac cycle (E, time points 11–20) and no motion during the first half (E, time points 1–10) can be observed; in cervical stenosis, the spinal cord shows an extensively increased oscillation in the second half (F, time points 11–20; red arrows) and ongoing upward motion in the first half (F, time points 1–10; red dotted arrow).
Altered Motion Pattern in Patients: The Restless Spinal Cord
Systolic motion in patients showed a craniocaudal followed by a caudocranial oscillation similar to findings in physiologic conditions,6,7 but with manifold higher velocity values (Fig 6 and Online Video 2). While the onset of the oscillation did not differ in patients compared with controls, the subsequent negative velocity peak and the positive velocity peak were significantly delayed. Additionally, while physiologic conditions are present almost without cord motion during the first half of the cardiac cycle (time points 1–10), providing a resting phase for the spinal cord, patients presented with a continuous motion that was seen throughout the whole cardiac cycle, reflecting ongoing upward motion (Fig 6). These findings suggest a timely onset but increased caudal motion driven by arterial pulsation and CSF flow. Downward motion was extended in 1 subgroup, while a delayed and prolonged upward oscillation in cervical stenosis was evident in most patients. The origin of the upward motion might be mostly attributed to a passive recoil, caused by elastic structures like the dental ligaments and the pia mater and the elastic properties of the spinal cord itself.20⇓-22 Additionally, in physiologic conditions, CSF flow shows a sinusoidal pattern with diastolic upward flow,37,38 which is restricted in the stenotic segments. Due to the obstruction of the spinal canal in cervical stenosis, the spinal cord might be subject to diastolic upward motion also driven by CSF backward flow.
In summary, the increased downward motion and the entrapment of the spinal cord at the stenotic segment might cause the delayed and ongoing upward motion. Therefore, in pathologic conditions, the physiologic diastolic resting phase vanished, resulting in a restless oscillation of the spinal cord. Considering >100,000 heartbeats with consecutively increased spinal cord oscillations per day, this ongoing mechanical stress to the spinal cord provides an important dynamic factor in the pathophysiology of DCM beyond static compression, potentially contributing to tissue damage, myelopathy, and its clinical conditions. Associations of increased spinal cord motion with sensory deficits,8,10 impaired electrophysiologic readouts,10 and decreased functional scores11 in patients with DCM are in line with this hypothesis. Additionally, each arterial pulsation acts on the spinal cord tissue with a magnitude corresponding to the blood pressure in patients missing the CSF buffer to absorb each pulsation. Most interesting, the mechanosensitivity of central nervous system tissue to low-level magnitude strains was shown.39⇓-41
Various other pathologic conditions are reported with altered spinal cord motion, underlining its clinical importance. In symptomatic patients with a tethered cord, limited cord motion was revealed, and a markedly decreased cord motion suggested a poor outcome for surgery.42,43 Analogous to our findings, changes with increased spinal cord motion and an impaired passive recoil have been reported in Chiari malformation,44⇓-46 associated with Chiari-associated syringomyelia.45,47 Obstruction of the foramen magnum in Chiari malformations, therefore, shows analogous findings to the obstructed spinal canal in patients with DCM.
In summary, assessing spinal cord motion may help to improve diagnostics and monitoring of disease progression because it reflects mechanical stress to the spinal cord not revealed by standard static MR imaging. Especially in patients with mild DCM, treatment decisions are challenging.48 Increased spinal cord motion in this population may provide a complementary aspect for decision-making. Also, postoperative measurements of spinal cord motion might provide a tool to identify sufficient decompression because normalization of preoperatively increased cord motion has been reported before.8 In contrast to other techniques (ie, multimodal MR imaging protocols49⇓⇓-52) requiring extensive postprocessing, spinal cord motion measurements can be easily implemented in routine MR imaging protocols.
Limitations
Because controls were not matched for age and sex, a possible bias of these characteristics could not be excluded. Due to limited time for MR imaging measurements, not all cervical segments could be evaluated in the individual patients. However, the group findings could show changes of the pattern of cord motion range across the whole cervical spinal segments. The temporal resolution of our motion measurements was limited by the high spatial in-plane resolution and the low velocity encoding value, both leading to a long TR. Due to limited scanning time per patient, a further extension of the phase-contrast acquisition time unfortunately was not possible. However, the approach used here might provide a reasonable compromise for clinical application.
CONCLUSIONS
This study revealed ongoing (restless) spinal cord motion over the whole cardiac cycle and provides further insight into the pathophysiology of degenerative cervical myelopathy contributing to tissue damage beyond static compression. Measuring spinal cord motion provides an interesting surrogate to potentially reveal conditions of spinal cord distress, even before it is clinically evident. This might enable advanced evaluation of patients thought to have DCM and provide a means for a timely surgical intervention at an early stage.
Acknowledgments
We would like to thank all healthy volunteers and patients for participation in this study. We thank Regula Schuepbach and Nathalie Kuehne for the excellent organization of the examinations and the management of the REDCap data base. We also would like to thank the MR imaging team, ie, Alexandra Conte, Zoe Volkart, and Natalie Hinterholzer, for performing the MR imaging measurements. Imaging was partly performed with support of the Swiss Center for Musculoskeletal Imaging, Balgrist Campus AG, Zurich.
Footnotes
Disclosures: Markus Hupp—RELATED: Grant: Balgrist Stiftung, Zurich, Switzerland, Comments: financial support for imaging costs.* Markus Klarhöfer—UNRELATED: Employment: Siemens Healthcare AG. Martin Schubert—RELATED: Grant: Balgrist Stiftung, Comments: compensation paid for MRI*; UNRELATED: Employment: Balgrist University Hospital, Comments: Payment was received for full-time position in regular clinical employment. Patrick Freund—UNRELATED: Employment: University of Zurich. Mazda Farshad—UNRELATED: Board Membership: Incremed (a Balgrist University Startup for augmented reality solutions for surgery)*; Patents (Planned, Pending or Issued): pending patent for a spinal cage device; Stock/Stock Options: usual stock portfolio. Armin Curt—UNRELATED: Employment: University of Zurich, Switzerland. *Money paid to the institution.
The study was supported by Balgrist Stiftung, Zurich, Switzerland. Professor Freund is funded by a Swiss National Science Foundation Eccellenza Professorial Fellowship grant (PCEFP3_181362/1).
Indicates open access to non-subscribers at www.ajnr.org
References
- Received April 19, 2020.
- Accepted after revision October 12, 2021.
- © 2021 by American Journal of Neuroradiology


