
Abstract
BACKGROUND AND PURPOSE: The prediction of treatment response is important in planning and modifying the chemoradiation therapy regimen. This study aimed to explore the quantitative histogram indices for treatment-response prediction of nasopharyngeal carcinoma based on diffusional kurtosis imaging compared with a standard ADC value (ADCstandard).
MATERIALS AND METHODS: Thirty-six patients with an initial diagnosis of locoregionally advanced nasopharyngeal carcinoma and diffusional kurtosis imaging acquisitions before and after neoadjuvant chemotherapy were enrolled. Patients were divided into respond-versus-nonrespond groups after neoadjuvant chemotherapy and residual-versus-nonresidual groups after radiation therapy. Histogram parameters of diffusional kurtosis imaging–derived parameters (ADC, ADC coefficient corrected by the non-Gaussain model [D], apparent kurtosis coefficient without a unit [K]) were calculated. The ADCstandard was calculated on the basis of intravoxel incoherent movement data. The intraclass correlation coefficient, Kolmogorov-Smirnov test, Student t test or Mann-Whitney U test, and receiver operating characteristic analysis were performed.
RESULTS: Most of the parameters had good-to-excellent consistency (intraclass correlation coefficient = 0.675–0.998). The pre-ADCstandard, pre-ADC (10th, 25th, 50th percentiles), pre-D (10th, 25th, 50th percentiles), and pre-K50th were significantly different between the respond and nonrespond groups, while the pre-ADC10th, pre-K90th, post-ADC50th, post-K75th, post-K90th, and the percentage change of parameters before and after neoadjuvant chemotherapy (▵ADC50th%) were significantly different between the residual and nonresidual groups (all P < .05). Receiver operating characteristic analysis indicated that setting pre-D50th = 0.875 × 10⁻³mm2/s as the cutoff value could result in optimal diagnostic performance for neoadjuvant chemotherapy response prediction (area under the curve = 0.814, sensitivity = 0.70, specificity = 0.92), while the post-K90th = 1.035 (area under the curve = 0.829, sensitivity = 0.78, specificity = 0.72), and▵ADC50th% = 0.253 (area under the curve = 0.833, sensitivity = 0.94, specificity = 0.72) were optimal for radiation therapy response prediction.
CONCLUSIONS: Histogram analysis of diffusional kurtosis imaging may potentially predict the neoadjuvant chemotherapy and short-term radiation therapy response in locoregionally advanced nasopharyngeal carcinoma, therefore providing evidence for modification of the treatment regimen.
ABBREVIATIONS:
- CR
- complete response
- D
- ADC coefficient corrected by the non-Gaussain model
- DKI
- diffusional kurtosis imaging
- IMRT
- intensity-modulated radiation therapy
- K
- apparent kurtosis coefficient without a unit
- NAC
- neoadjuvant chemotherapy
- NPC
- nasopharyngeal carcinoma
- PR
- partial response
- SD
- stable disease
- ▵ADC50th%
- the percentage change of parameters before and after neoadjuvant chemotherapy
Nasopharyngeal carcinoma (NPC) is a territorial epidemic in southern China and Southeast Asia; in 2012, seventy-one percent of new NPC cases were in these areas.1 Neoadjuvant chemotherapy (NAC) followed by intensity-modulated radiation therapy (IMRT) has currently been widely accepted as the preferred treatment for NPC. NAC improves quality of life by optimizing the IMRT plan2 due to reducing the overall tumor volume and boosting radiation therapy sensitivity, thereby facilitating local control and reducing the rate of distant metastases.3 However, the resistance of patients with locoregionally advanced NPC to the conventional NAC-plus-IMRT regimen leads to poor survival and poor quality of life after retreatment.4 The prediction of treatment response can offer important references for individualized treatment-strategy planning. The treatment response after 2 NAC cycles has been reported as a valuable time point to choose patients who respond well to chemoradiation therapy.5,6
Diffusion-weighted imaging, based on free diffusion of water molecules following Gaussian distribution, is the most widely used functional MR imaging technology.7,8 However, water molecular diffusion in biologic tissues is restricted by various barriers, resulting in not following a Gaussian distribution. By means of a non-Gaussian distribution model, diffusional kurtosis imaging (DKI) can yield kurtosis and diffusion coefficients corrected by the non-Gaussian model.9,10 The histogram analysis can reflect the whole-tumor heterogeneity11 and has the potential for treatment-response prediction.12 The predictive value of histogram analysis of DKI-derived parameters in assessing the treatment response is still unclear. Therefore, in this study, we aimed to use the histogram analysis of DKI parameters in comparison with a standard ADC value (ADCstandard) to explore the quantitative indices for prediction of treatment-response assessment in patients with NPC.
Materials and Methods
Patient Selection and Treatment Protocols
Our institutional review board approved the protocol of this retrospective study and waived the requirement for obtaining informed consent. Between December 2015 and March 2017, 56 newly diagnosed patients with locoregionally advanced NPC (clinical stages III and IV) with no pretreatment were retrospectively recruited. All patients' Tumor, Node, Metastasis status and clinical stage were re-evaluated by oncologists referring to the eighth edition of the American Joint Committee on Cancer/Union for International Cancer Control TNM Classification for Nasopharyngeal Cancers (https://emedicine.medscape.com/article/2048007-overview).13 Nine patients were excluded (3 for alteration of clinical stage from stage IVa to stage II after restaging, 6 for unsuccessful DKI acquisitions).
Forty-seven individuals were candidates for 2 cycles of NAC (21 days per cycle). In each cycle, patients were given a dose of 25 mg/m2 of cisplatin (DDP) on days 1, 2, and 3 and 75 mg/m2 of docetaxel (DOC) on day 1. Eleven patients were excluded (5 for stopping treatment due to severe complications, 4 for receiving radiation therapy directly without NAC, 2 for refusal of further radiation therapy). The remaining 36 patients then received IMRT with a total dose of 70 Gy in 31 fractions. Among them, 20 patients received concurrent chemotherapy with nedaplatin (50 mg/m2 per week). The flow diagram of patient selection is shown in Fig 1.

Flowchart of patient selection.
MR Imaging Acquisition
MR imaging examinations were performed using a 3T MR imaging scanner (Magnetom Prisma; Siemens, Erlangen, Germany) with 20-channel head and neck combined coil. The routine MR imaging protocol includes sagittal and axial T1-weighted imaging using a turbo spin-echo technique (TR/TE = 670/9 ms, section thickness/gap = 5/1 mm, FOV = 220 mm, matrix, = 240 × 320) before and after contrast injection, axial T2-weighted imaging using Dixon techniques (TR/TE= 4070/81 ms, section thickness/gap = 4/1 mm, FOV = 220 mm, matrix = 224 × 320), and oblique coronal T2WI with fat suppression using a turbo inversion recovery technique (TR/TE = 3300/37ms, section thickness/gap = 3/0.3 mm, FOV = 240 mm, matrix = 224 × 320).
For DKI acquisitions, a single-shot echo-planar imaging diffusion sequence was used (TR/TE = 4900/60 ms, section thickness/gap = 5/0 mm, FOV= 280 mm, matrix = 116 × 128, concatenation = 1) in 3 orthogonal directions, with 5 b-values (200, 500, 1000, 1500, 2000 /mm2). The total acquisition time of DKI was 3 minutes 26 seconds.
Standard ADC using b = 0 and b = 1000 mm/s2 was calculated on the basis of intravoxel incoherent movement data. Intravoxel incoherent movement was acquired by a ZOOMIT (Siemens) single-shot-EPI diffusion sequence (TR/TE = 3000/62.4 ms, section thickness/gap = 4/0 mm, FOV = 200 mm, matrix = 44 × 90, concatenation = 1) in 3 orthogonal directions, with 11 b-values (0, 50, 100,150, 200, 300, 400, 500, 700, 900, 1000 s/mm2). The total acquisition time of intravoxel incoherent movement was 5 minutes 26 seconds.
Dynamic contrast-enhanced imaging was also performed. The intravoxel incoherent movement and dynamic contrast-enhanced imaging analysis were not assessed in this study.
The routine and DKI protocols were performed before starting NAC treatment and within 3 days after 2 cycles of NAC. Routine MR imaging protocols were performed 3 months after radiation therapy.
DKI Data Analysis
The entire image-analysis algorithm was achieved using an in-house program written in Matlab (Version R2013b; MathWorks, Natick, Massachusetts). The DKI parameter was fitted according to the following equation14:
 S0 is signal intensity at b = 0, Sb is signal intensity for a given b-value. D is the apparent diffusion coefficient corrected by the non-Gaussian model, K is the apparent kurtosis coefficient without units.
The DKI-derived ADC value in this study was a mean value obtained using all b-values fitting a conventional monoexponential model according to the following equation14:
 We drew ROIs manually on all the sections involving tumors in DKI, avoiding the large vessels and parapharyngeal lymph nodes; they subsequently were copied automatically onto the DKI-derived parameter maps (ADC, ADC coefficient corrected by the non-Gaussain model [D], and apparent kurtosis coefficient without a unit [K] maps) by software. In tumors with muscle and skull base invasion, the involved skull base and muscle were excluded.
Histogram analysis of the DKI-derived parameters (ADC, D, and K) was performed using SPSS Statistics 24.0 (IBM, Armonk, New York). On the basis of the whole-tumor-volume ROIs, we derived the following parameters: 1) 10th percentile; 2) 25th percentile; 3) 50th percentile (median); 4) 75th percentile; 5) 90th percentile; 6) mean; 7) standard deviation; 8) skewness; and 9) kurtosis.15
All ROI placements were performed by 2 experienced radiologists (with 8 and 10 years of experience in head and neck MR imaging) who were blinded to the study design, with reference to T2-fat suppression, contrast-enhanced T1WI, and dynamic contrast-enhanced MR images. The measurement results of the 2 radiologists were used to assess the interreader reproducibility. The average of the 2 measurement results was used for further statistical analysis.
Standard ADC Analysis
Because the DKI protocol only contains b-values of >200 s/mm2, the standard ADC value (ADCstandard) using b = 0 and b = 1000 mm/s2 was calculated on the basis of intravoxel incoherent movement data with the Z420 workstation (syngo VH22B; Siemens). ROIs were manually drawn on the maximum cross-sectional area of primary lesions. Limited by the workstation, we collected only the mean value of standard ADC for analysis.
Evaluation of NAC Response
After 2 NAC cycles, shrinking ratios of the target lesions, including primary tumor and pathologic lymph nodes with diameters of >15 mm, were calculated on the basis of RECIST 1.1 criteria (http://recist.eortc.org/recist-1-1-2/).16 Compared with initial target lesions, a reduction of the sum of the longest diameter of ≥30% after treatment was considered as a partial response (PR), and the others who did not reach 30% were regarded as having stable disease (SD). The absence of visible and viable tumors with no lymph nodes having a diameter of >10 mm based on the MR imaging assessment was considered a complete response (CR).
After 2 NAC cycles, patients achieving CR or PR were categorized as the respond group (Fig 2), while SD was the nonrespond group (Fig 3).

A 66-year-old man (T4N1M0, clinical stage IVa, patient No. 26 in On-line Table 1) who was classified as belonging to the respond group after NAC and the nonresidual group after radiation therapy. A, Images before NAC. B, Images after NAC. C, Images after radiation therapy. T2-FS indicates a T2-weighted image with fat saturation. Columns ADC, D, and K represent the corresponding parameter diagrams.

A 46-year-old man (T4N2M0, clinical stage IVa, patient No. 34 in On-line Table 1) who was classified as belonging to the nonrespond group after NAC and the residual group after radiation therapy. A, Images before NAC. B, Images after NAC. C, Images after radiation therapy. T2-FS indicates a T2-weighted image with fat saturation. Columns ADC, D, and K represent the corresponding parameter diagrams.
Evaluation of Radiation Therapy Response
After the whole chemoradiotherapy protocol (2 NAC cycles and IMRT), the radiation therapy response was calculated on the basis RECIST 1.1 criteria16 compared with initial target lesions. Patients who achieved CR were recategorized as the nonresidual group (Fig 2), while those with PR or SD were in the residual group (Fig 3).
Statistical Analysis
Statistical analysis was performed using SPSS Statistics 24.0 and Medcalc 11.4. The parameters before and after NAC were marked as preparameterhistogram parameter and postparameterhistogram parameter. Experimental data were presented as arithmetic means unless otherwise stated. Interobserver consistency of the parameters between the 2 readers was assessed using the intraclass correlation coefficient with 95% confidence intervals. The Kolmogorov-Smirnov test was used to assess the normality of data distribution. Then the statistical comparisons between the respond and nonrespond groups and between the residual and nonresidual groups was performed using the independent-samples t test or Mann-Whitney U test accordingly. Receiver operating characteristic analyses and areas under the curve were used to assess the diagnostic efficiency of parameters in the prediction of treatment response. The cutoff value was established by maximizing the Youden index (Youden index = sensitivity + specificity − 1). P < .05 was considered as statistically significant.
Results
Clinical Results
Thirty-six patients (27 males, and 9 females, with a mean age of 48.5 years; range, 17–67 years) with successful DKI acquisitions before and after NAC and MR imaging follow-up acquisitions after radiation therapy were included. Patient characteristics are shown in On-line Table 1 in detail. No obvious differences of clinical characteristics, involving age, sex, Tumor, Node, Metastasis staging, and clinical staging were found between the NAC and radiation therapy response subgroups. The MR images and DKI parameter maps of representative patients with NPC are shown in Figs 2 and 3.
Interreader Agreement
The interreader intraclass correlation coefficient for the measurements of DKI-derived histogram parameters between 2 radiologists revealed that the pre-ADCskew, post-ADCskew, post-Dmean, post-Kstandard deviation, post-Kskew, and post-Kkurtosis had poor-to-moderate consistency (intraclass correlation = 0.001–0.576), post-Dstandard deviation had good consistency (intraclass correlation = 0.675), and other parameters had excellent consistency (intraclass correlation > 0 .81). After excluding the parameters with poor-to-moderate consistency, the average values of the other parameters measured by the 2 radiologists were calculated for further statistical analysis.
Parameters before NAC for Prediction of NAC Response
After 2 NAC cycles, 1 patient who achieved CR and 22 patients who achieved PR were classified as the respond group, while the other 13 patients who achieved SD were classified as the nonrespond group.
Compared with the nonrespond group, the respond group demonstrated higher ADC values, higher D values, and lower K values. The pre-ADCstandard was significantly higher in the respond group than in the nonrespond group (0.95 ± 0.12 versus 0.83 ± 0.14, P = .008). The pre-ADCmean and pre-ADC50th were significantly lower than the pre-ADCstandard (0.63 ± 0.09, 0.60 ± 0.10 versus 0.91 ± 0.14, P < .001). The correlation between pre-ADCmean and pre-ADCstandard was weak (r = 0.104, P = .545), while that between pre-ADC50th and pre-ADCstandard was good (r = 0.525, P = .001).
After Bonferroni-Holm correction, pre-ADC (10th, 25th, 50th percentiles) and pre-D (10th, 25th, 50th percentiles) were significantly higher in the respond group than in the nonrespond group (P value = .002–.047), while the pre-K50th was significantly lower (P = .018). Details are presented in On-line Table 2 and Fig 4.

Parameters that were significantly different between the respond (RP) and nonrespond (NRP) groups (A–H) and between residual (RD) and nonresidual (NRD) groups (I–N). The asterisk indicates P < .05; double asterisks, P < .01.
Receiver operating characteristic analysis (On-line Table 3 and Fig 5) indicated that the setting pre-D50th ×10−3 = 0.875 mm2/s as the cutoff value could obtain optimal diagnostic performance (area under the curve = 0.814, sensitivity = 0.70, specificity = 0.92) for the prediction of the NAC treatment response.

Receiver operating characteristic analysis curves for parameters in the prediction of NAC treatment response. The setting pre-D50th = 0.875 mm2/s as the cutoff value could yield optimal diagnostic performance (area under the curve = 0.814, sensitivity = 0.70, specificity = 0.92).
Parameters before and after NAC for Prediction of Radiation-Therapy Response
After radiation therapy with or without concurrent chemotherapy (n = 20 versus 16), 18 patients who achieved CR were classified as the nonresidual group, while 10 patients who achieved PR and 8 patients who achieved SD were classified as the residual group. With a Fisher exact test (double-tailed P = .315), our study showed no significant difference in the treatment response to radiation therapy between subgroups with or without concurrent chemotherapy.
Compared with the residual group, the nonresidual group had higher ADC values, higher D values, and lower K values both before and after NAC. The ADC and D values significantly increased, while the K value significantly decreased after NAC (all P < .05). After Bonferroni-Holm correction, the pre-ADC10th, pre-K90th, and post-ADC50th were significantly higher, while the post-K75th and post-K90th were significantly lower in the nonresidual group compared with the residual group (all, P < .005).
The pre-ADCstandard value was slightly higher in the residual group compared with the nonresidual group(P = .397), while the post-ADCstandard had no statistical significance (P = .959).
The analysis of percentage change of parameters before and after NAC showed that there were 8 percentage change parameters with P values < .05 (P value = .005–.04), including ADC (25th, 50th, 90th percentiles), D (25th percentile, standard deviation) and K (50th, 75th, 90th percentiles). After Bonferroni-Holm correction, only the percentage change of parameters before and after neoadjuvant chemotherapy (▵ADC50th%) was significantly different between groups (P = .005). Details are presented in On-line Table 4 and Fig 4.
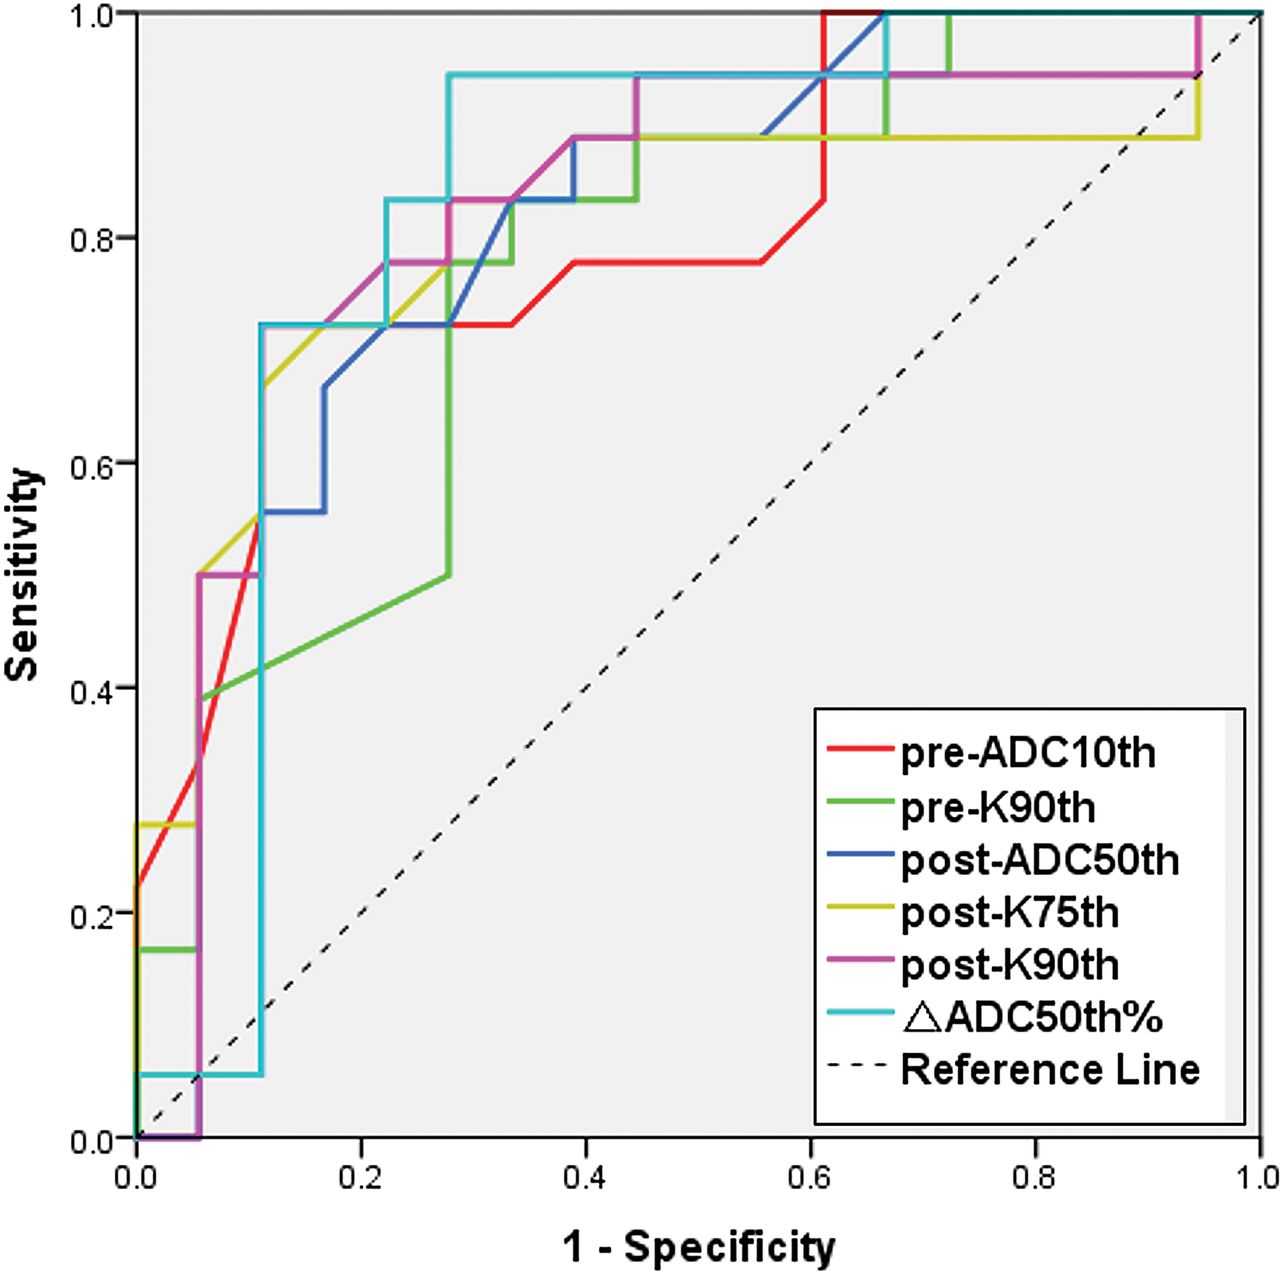
Receiver operating characteristic analysis (On-line Table 3 and Fig 6) indicated that among all time point parameters, setting post-K90th = 1.035 as the cutoff value could obtain optimal diagnostic performance (area under the curve = 0.829, sensitivity = 0.78, specificity = 0.72) for the prediction of the treatment response to radiation therapy, while the setting ▵ADC50th% = 0.253 could obtain even better diagnostic performance (area under the curve = .833, sensitivity = 0.94, specificity = 0.72), though with no significance (P > .05).

Receiver operating characteristic analysis curves for parameters in the prediction of treatment response to radiation therapy. The setting ▵ADC50th% = 0.253 as the cutoff value could obtain optimal diagnostic performance (area under the curve = 0.833, sensitivity = 0.94, specificity = 0.72).
Discussion
Our study demonstrated that the histogram parameters derived from the DKI technique were feasible for predicting the tumor response of NAC and short-term radiation therapy in patients with NPC, while standard ADC can only predict the NAC response.
Prediction of treatment response has crucial importance in treatment-strategy planning and modification. The advantage and protocol of NAC have not been completely established. Although the necessity of the combination of docetaxel, cisplatin, and fluorouracil remains controversial,17⇓–19 low-dose regimens of docetaxel, cisplatin, and fluorouracil were reported to have substantially good tolerance and compliance rates.20 Moreover, molecular-targeted therapy in patients with NPC has become a research hot point. The addition of bevacizumab21 or nimotuzumab4,22 to the conventional docetaxel and cisplatin23 protocol has been reported to have the potential to delay the progression of subclinical distant disease and modify the long-term survival. The early identification of patients who may have resistance to NAC or IMRT can provide evidence for treatment-regimen modification. Our study demonstrated no significant difference in the radiation therapy response between the IMRT group with or without concurrent chemotherapy. Similarly, Zhang et al24 reported that concurrent chemotherapy with IMRT after NAC for locoregionally advanced NPC is probably not necessary. However, this observation needs further evidence from multicenter clinical trials.
A previous study based on long-term clinical outcomes has reported that the skewness of the ADC distribution curve was a predictor of local failure in patients with NPC.25 Another retrospective study demonstrated more positive results, indicating that the mean and median values of pretreatment ADC might provide useful information for predicting outcome and selecting high-risk patients appropriate for more aggressive therapy.8 Our study demonstrated that ADCstandard and ADC derived from the DKI model before initiating NAC were both able to predict the NAC response. However, the prediction value of ADCstandard and ADC derived from the DKI model in short-term radiation therapy was limited. The method of response evaluation and the time interval of follow-up may contribute to this controversial result. The relationship between short-term and long-term outcomes after chemoradiotherapy has not been studied. The difference in the prediction efficiency of the radiation therapy response between our study and previous studies may suggest that the short-term radiation therapy (3 months after the whole chemoradiotherapy protocol) response may have a weak correlation with long-term outcome.
In our study, the correlation between mean ADC values derived from DKI models covering whole tumor and ADCstandard covering the largest level of tumor was weak, while the correlation between median ADC derived from DKI models and ADCstandard was good and these two parameters both have good diagnostic efficiency in NAC response assessment. As the selection of ROIs varies between these two parameters, it may suggest that when calculating ADC value, the median value is prior in whole-tumor ROI drawing, while mean value prior in one-slice ROI.
Our study has demonstrated that higher ADC values, higher D values, and lower K values are related to positive NAC and radiation therapy responses, consistent with previous studies in NPC6,27,28 and head and neck squamous cell carcinoma.29,30 Moreover, an increase in ADC was seen after NAC. Previous studies have reported that the ▵ADC was significantly lower in patients with later tumor recurrence than in those with complete remission, similar to our results.30,31 Similarly, in our study, ▵ADC50th demonstrated the highest diagnostic performance in the prediction of radiation therapy response. Although this trend appears to be the norm, there have been cases in which a decrease, rather than an increase, in ADC measurements has been reported to correlate with a positive response to NAC.32 Tumors consist of a complex microenvironment composed of immune, stromal, and cancer cells, any mediator of which can foster cancer growth and therapy resistance.33 Previous study has demonstrated that low ADC values correlate well with a high clinical stage and high tumor aggressiveness, which are characterized by more vascular hyperplasia and necrosis, which may result in therapy resistance.11,34⇓–36
As the complexity of tumor microenvironment increases, the water molecular diffusion restriction increases, resulting in a higher deviation of the Gaussian distribution. Current state-of-the art multiparametric MR imaging introduces the kurtosis model to reflect the non-Gaussian water molecular diffusion, which may reflect physiologic features and pathologic changes by investigating tissue cellularity and heterogeneity at the micron level,34 and can monitor its changes after therapy.37 A recent clinical study showed that DKI was the best technique, with a diagnostic accuracy of 0.93 in predicting local control in nasal or sinonasal squamous cell carcinoma.12 Previous studies have reported that the D parameter excludes the perfusion-related signal in pixels and reflects more detail about tumor microstructure complexity than ADC.34,38,39 Fujima et al12 suggested that the low treatment-response area represents a lower D value area, while higher treatment sensitivity areas had increased D values. In our study, the pre-D50th value was lower than the mean value, representing components with lower D values, which may lead to treatment resistance and have the highest diagnostic ability in NAC treatment-response assessment.
The apparent diffusional kurtosis (K parameter, unitless) reflects the peaked distribution of tissue diffusivity that occurs in the context of non-Gaussian diffusion behavior and increases with the microstructural complexity of tissue.40,41 Similarly, our study showed that the nonrespond and residual groups are associated with higher K values. Among time point parameters, the post-K90th, which represents higher K value components that may lead to treatment resistance, has the best predictive value for the assessment of radiation therapy response.
Although this study revealed the feasibility of DKI parameters in the prediction of NAC and radiation therapy outcome, the accurate biologic mechanism of treatment resistance remains unclear. This study may provide a novel perspective to explore the mechanism of treatment resistance of tumors in consideration of the histogram distribution of water diffusion characteristics.
Limitations
This study has some limitations. First, our study was retrospective with a small sample size and short-term follow-up, enrolling only patients with locoregionally advanced NPC. Second, the assessment of the treatment response to radiation therapy in our study included only patients who received radiation therapy after NAC, causing selection bias and limiting the reliability of this study in the assessment of the treatment response to radiation therapy. Third, the measurement of change in primary tumor size was based on dimensions. Choosing the same level and site before and after treatment was difficult; therefore, volume measurement for treatment response assessment should be emphasized in a future study.
Conclusions
Histogram analysis of diffusional kurtosis imaging may potentially predict the response of NAC and short-term radiation therapy, therefore providing evidence for modification of the treatment regimen.
Acknowledgments
We would like to acknowledge the assistance of Tong San Koh, Haijun Yu, Hongyan Zhang, Zheng Li, Yong Huang, and Liu Shi.
Footnotes
Ning Tu, Yahua Zhong, and Xiangyu Wang contributed equally to this work.
This study received funding from the National Key Basic Research Program of the National Natural Science Foundation of China (grant No. 2016YFC1304702 to Guangyao Wu).
Indicates open access to non-subscribers at www.ajnr.org
REFERENCES
- Received January 18, 2018.
- Accepted after revision November 16, 2018.
- © 2019 by American Journal of Neuroradiology


