
Abstract
BACKGROUND AND PURPOSE: Arterial spin-labeling with multiple postlabeling delays can correct transit times. We tried to evaluate CBF in neonates and infants using multidelay arterial spin-labeling.
MATERIALS AND METHODS: Multidelay arterial spin-labeling was applied to 13 preterm neonates (mean postmenstrual age, 34.9 weeks), 13 term-equivalent-age neonates (mean postmenstrual age, 39.2 weeks), and 6 infants (mean postmenstrual age, 57.8 weeks). Transit time–corrected CBF in the caudate, thalamus, frontal GM, occipital GM, frontal WM, and occipital WM was measured, and relative CBF compared with the whole-brain CBF was calculated. Inter- and intragroup comparisons were performed among the 3 age groups. A correlation and nonlinear regression analysis were performed between postmenstrual age and CBF.
RESULTS: Intergroup comparisons showed significantly higher whole-brain CBF in infants (38.3 mL/100 g/min) compared with preterm (15.5 mL/100 g/min) and term-equivalent-age (18.3 mL/100 g/min) neonates (P < .001). In the intragroup comparison, all 3 groups showed significantly higher relative CBF values in the occipital WM (63.6%–90.3%) compared with the frontal WM (46.3%–73.9%). In term-equivalent-age neonates, the occipital GM (120.8%) had significantly higher relative CBF values than the frontal GM (103.5%). There was a significant negative correlation between postmenstrual age and the relative CBF of the thalamus (r = − 0.449, P = .010). There were significant positive relationships between postmenstrual age and the relative CBF of the frontal WM (R2 = 0.298, P = .001) and occipital WM (R2 = 0.452, P < .001).
CONCLUSIONS: Multidelay arterial spin-labeling with transit time–corrected CBF showed developmental changes and regional differences of CBF in neonates and infants.
ABBREVIATIONS:
- ASL
- arterial spin-labeling
- F-GM
- frontal GM
- F-WM
- frontal WM
- O-GM
- occipital GM
- O-WM
- occipital WM
- PLD
- postlabeling delay
- PMA
- postmenstrual age
- rCBF
- relative CBF
- T1b
- longitudinal relaxation time of blood
- TEA
- term-equivalent-age
- wbCBF
- whole-brain CBF
Brain maturation is one of the most vital processes occurring during neonatal life, and imaging studies can potentially provide insight into normal brain development. MR imaging can provide high-resolution structural and functional images. As an increasing number of neonates undergo routine brain MR imaging, advanced tools have been applied to observe maturation processes in the neonatal brain. These include DWI,1,2 DTI,3 magnetization transfer imaging,4 and arterial spin-labeling (ASL).5
Among these methods, ASL is a noninvasive method that measures CBF. ASL uses endogenous blood water as a diffusible tracer5 and is increasingly applied in neurologic studies. By using a radiofrequency inversion pulse, arterial blood protons are magnetically labeled in the carotid artery level.5 ASL provides a quantitative measure of regional brain function and can show changes in baseline function associated with aging.6 In neonates, ASL has been applied to see changes in perfusion during brain maturation7 and to see the predictive value of these changes in patients who undergo hypothermia treatment after hypoxic-ischemic injury.8
However, there are some limitations to applying ASL in neonates. First, neonates have different blood and brain tissue T1 values than older children and adults.7,9 Adjusting these values to neonates is essential because inadequate application of ASL will lead to inaccurate calculation of CBF.10 Second, neonates have decreased cerebral blood perfusion and low flow velocity.11 In ASL, labeled blood signals are acquired at the cerebral level after enough time has passed to allow the labeled spins to reach the imaging section, and this time lapse is called the postlabeling delay (PLD). If the PLD is not long enough to reflect the brain perfusion of neonates with low flow velocity, the acquired perfusion values will be inaccurately low. Inaccurately low perfusion values will lead to inadequate interpretation of CBF in neonates combined with the inherent problem of a low signal-to-noise ratio in ASL.
ASL with multiple PLD acquisitions (multidelay ASL) has been applied in adults. CBF values calculated from multidelay ASL showed good correlation with the CBF results of PET,12 dynamic susceptibility contrast perfusion MR imaging,13 and CT perfusion.14 Compared with single-PLD ASL, multidelay ASL showed improved CBF quantification in patients with Moyamoya disease, who have a delay between labeling in the feeding arteries and the arrival of the labeled blood in tissue.
The major trade-off of multidelay ASL used to be longer scanning time. However, recent application of Hadamard encoding has made it possible to acquire multiple PLDs in a much shorter time,15 and a more upgraded version of the multidelay ASL technique (enhanced ASL technique; GE Healthcare, Milwaukee, Wisconsin) has been introduced. To the best of our knowledge, there has been no study that applies multidelay ASL to neonates. Therefore, the purpose of this study was to show cerebral perfusion in neonates and infants using multidelay ASL with optimized T1 values.
Materials and Methods
Patients
This retrospective study was approved by the institutional review board of Ajou University Hospital. Brain MRIs obtained between July 2016 and March 2017 were reviewed. In our institution, brain MR imaging is performed in preterm neonates born before the 32nd week of gestation or in neonates with a birth weight of <1500 g. These neonates stay in the neonatal intensive care unit during hospitalization and undergo brain MR imaging before discharge. In addition to the above indications, infants undergo brain MR imaging for clinical suspicion of brain injury. We excluded infants who had abnormalities on brain MR imaging, including hydrocephalus, hemorrhage, or hypoxic-ischemic injury.
Thirty-two patients were included, and we divided the subjects into 3 groups according to age at the time of MR imaging: preterm neonates, term-equivalent-age (TEA) neonates, and infants. All those in the infant group were full-term with a postnatal age of 1 month or older at the time of MR imaging. Therefore, there were 13 preterm neonates (34.9 ± 1.1 weeks' postmenstrual age [PMA]), 13 TEA neonates (39.2 ± 2.1 weeks' PMA), and 6 infants (57.8 ± 5.4 weeks' PMA; 111.0 ± 62.8 days' postnatal age).
Several patients underwent brain MR imaging for indications that were not routine. One preterm neonate underwent MR imaging to rule out cranial complications of asphyxia. Among TEA neonates, 3 underwent MR imaging for apnea; 2, for macrocephaly; 2, for postresuscitation evaluation; and 1, for seizure. Among infants, 2 underwent MR imaging for suspicion of delayed development; 2, for follow-up of meningitis; 1, for early closure of the anterior fontanelle; and 1, for transient apnea. None of the included subjects showed abnormalities on conventional MR imaging. All patients were sedated for the MR imaging examination with oral chloral hydrate (0.5 mL/kg). An additional single dose of IV midazolam (0.1 mg/kg) was administered to patients who awoke during scanning.
Image Acquisition
Multidelay ASL was included in our routine imaging protocol for infants who underwent brain MR imaging with a 3T scanner (750w; GE Healthcare). The routine brain MR imaging protocol for neonates and infants included 3D T1-weighted spoiled gradient-echo imaging, axial T2WI, DWI, gradient-echo imaging, and multidelay ASL.
We used a multidelay ASL sequence based on Hadamard encoding to obtain 7 perfusion-weighted images with different PLDs and effective labeling durations. For neonates and infants, PLDs were the following: 2.00, 2.22, 2.48, 2.8, 3.15, 3.63, 4.32 seconds and 1.50, 1.72, 1.98, 2.28, 2.65, 3.13, 3.82 seconds, respectively.16 Effective labeling durations were the following: 0.22, 0.26, 0.30, 0.37, 0.48, 0.68, 1.18 seconds, regardless of age. By means of Hadamard encoding, CBF images from 7 different PLDs could be generated from 8 acquisitions, and each CBF image was an average of 4 images.15
The arterial transit time was estimated using the weighted-delay method of Dai et al.17 On the arterial transit time map, the median arterial transit times of preterm neonates, TEA neonates, and infants were 2.27 seconds (interquartile range, 0.11 seconds), 2.26 seconds (interquartile range, 0.12 seconds), and 1.24 seconds (interquartile range, 0.53 seconds), respectively. Transit time-corrected CBF maps were computed from the cumulative perfusion-weighted image.17⇓⇓–20 Other parameters for multidelay ASL imaging were as follows: TR, 6791 ms; TE, 11 ms; FOV, 24 cm; 640 sampling points on 5 spirals (matrix size, 640 × 5); section thickness, 5 mm; number of sections, 20.
Image Analysis
Acquired raw images of multidelay ASL were processed using dedicated software to adjust for the longitudinal relaxation time of blood (T1b) and tissue. This procedure was used because the quantified perfusion of the acquired multidelay ASL was assumed to have the T1b and longitudinal relaxation time of tissue values of adults, which are different from those of neonates. The longitudinal relaxation time of tissue was assumed to be 1.5 seconds.21 Because neonates show a large individual variation for T1b, we individualized the T1b values for each neonate. The T1b was calculated using the following equation9:
 where a = 0.50 seconds−1, the specific relaxivity, and b = 0.37 seconds−1, the native relaxivity. Hematocrit values were acquired from blood tests performed within a week of MR imaging. The mean values of hematocrit in preterm neonates, TEA neonates, and infants were 31.1% ± 8.0%, 39.0% ± 8.3%, and 33.1% ± 5.1%, respectively. The mean values of T1b in preterm neonates, TEA neonates, and infants were 1.91 ± 0.14, 1.78 ± 0.13, and 1.87 ± 0.09, respectively.
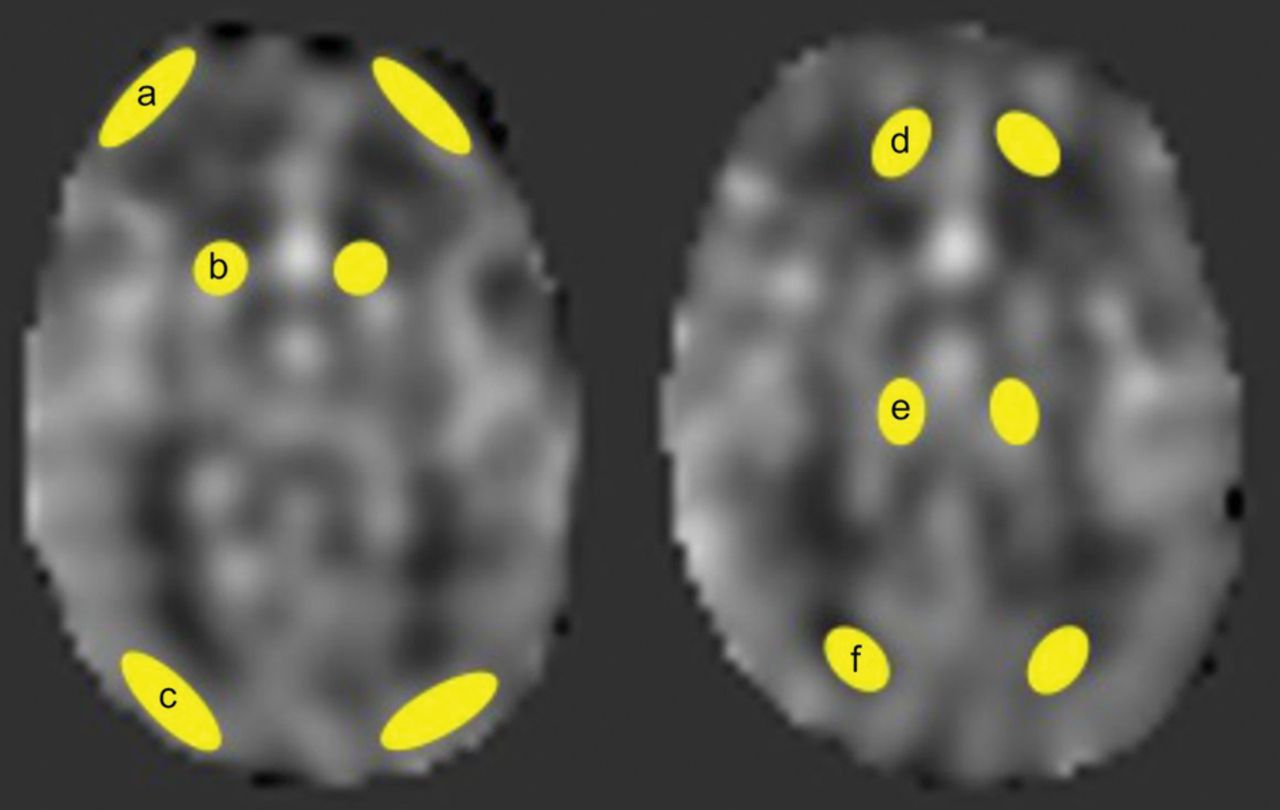
ROIs were manually drawn by 1 radiologist with 8 years of experience in brain imaging on the PACS at the following brain regions for CBF in mL/100 g/min: the caudate, thalamus, frontal GM (F-GM), occipital GM (O-GM), frontal WM (F-WM), and occipital WM (O-WM) (Fig 1). The size range of the ROIs was 16.6–24.9 mm2. The whole-brain CBF (wbCBF) was obtained, and we calculated relative CBF (rCBF) for each brain region by comparing the specific CBF of the region with the wbCBF.

Transit time-corrected CBF is measured within the ROIs: frontal GM (a); caudate (b); occipital GM (c); frontal WM (d); thalamus (e); and occipital WM (f).
Statistical Analysis
Continuous variables were first tested for normality using the Kolmogorov-Smirnov test. For the intergroup comparison of CBF for the 3 age groups, normally distributed independent variables were compared using one-way analysis of variance followed by the Tukey post hoc test. For the intragroup comparison of rCBF in the frontal and occipital lobes, the paired t test was used. PMA had a non-normal distribution. Correlations between PMA and CBF were analyzed using the Spearman correlation. For the CBF of WM, the best-fit nonlinear regression model (ie, the lowest Bayesian information criterion) was selected among quadratic, logarithmic, and linear regression models. A P < .05 indicated statistical significance. SPSS, Version 25.0 (IBM, Armonk, New York) and the R software package (Version 3.4.3; www.r-project.org) were used for analysis.
Results
Regional CBF and rCBF for each age group are summarized in Table 1. WM (7.3–35.6 mL/100 g/min) showed lower CBF than cortical GM (16.8–49.8 mL/100 g/min) in all age groups. In preterm and TEA neonates, deep GM structures of the caudate and thalamus showed the highest CBF (21.2–32.2 mL/100 g/min) with a rCBF of 136.4%–177.2% for all brain regions. In infants, the highest CBF was observed in the O-GM (49.8 mL/100 g/min) followed by the caudate (42.9 mL/100 g/min) and F-GM (41.8 mL/100 g/min).
Regional CBF in the age groups of preterm neonates, term-equivalent-age neonates, and infantsa
Intergroup Comparison
For absolute CBF values, there was a significant difference in CBF in the 3 groups for all brain regions except the thalamus. Differences were significant between preterm neonates and infants and between TEA neonates and infants, with a significantly higher CBF being observed in infants for both comparisons. There was no significant difference between preterm neonates and TEA neonates. The wbCBF was significantly higher in infants (38.3 mL/100 g/min) compared with preterm (15.5 mL/100 g/min) and TEA (18.3 mL/100 g/min) neonates (P < .001). There was no significant difference between preterm and TEA neonates (P = .388).
For rCBF values, the thalamus, F-WM, and O-WM showed significant differences among the 3 groups. The rCBF of the thalamus in preterm (174.1%) and TEA neonates (177.2%) was significantly higher than in infants (96.5%). The rCBF of the F-WM was significantly higher in infants (73.9%) than in preterm (46.7%) and TEA neonates (46.3%). The rCBF of the O-WM was significantly higher in infants (90.3%) than in preterm (63.6%) and TEA neonates (65.6%). Between preterm and TEA neonates, there was no significant difference in the rCBF of the thalamus, F-WM, and O-WM. The caudate, F-GM, and O-GM showed no significant difference among the 3 groups.
Intragroup Comparison
Results of the intragroup comparison are summarized in Table 2 and Fig 2. When the rCBF of the F-WM and O-WM was compared, all 3 age groups showed significantly higher rCBF values in the O-WM compared with the F-WM. In infants, the O-WM showed a rCBF value 1.2 times higher than the rCBF value of the F-WM. In preterm and TEA neonates, the O-WM showed a rCBF value 1.4 times higher than the F-WM. Regarding GM, the O-GM showed a significantly higher rCBF value compared with the F-GM in TEA neonates (120.8% versus 103.5%, P = .026). In preterm neonates and infants, the O-GM (122.8%–127.6%) showed a higher rCBF value than the F-GM (108.5%–111.0%), but there was no statistical significance.
Intragroup comparison between rCBF in the frontal and occipital lobesa

Intragroup comparison of rCBF in the frontal and occipital lobes. A single asterisk indicates P < .05; double asterisks, P < .001.
Relationship between Postmenstrual Age and CBF
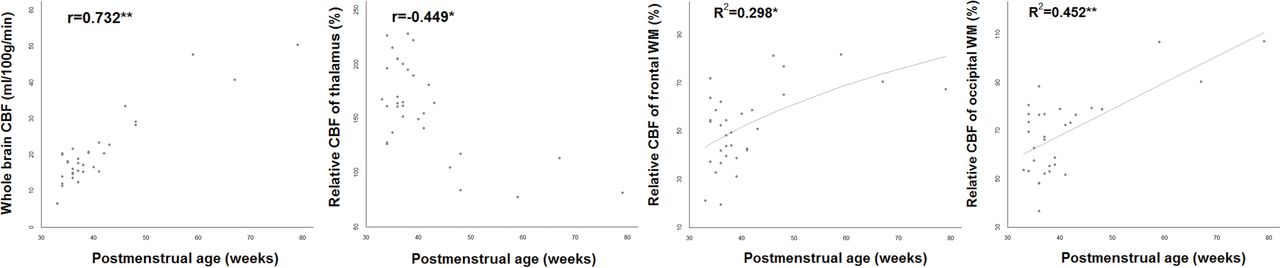
There was a significant positive correlation between PMA and wbCBF (r = 0.732, P < .001) (Fig 3). For PMA and the rCBF of the thalamus, there was a significant negative correlation between values (r = −0.449, P = .010). There was a significant positive correlation between PMA and the rCBF of the F-WM (r = 0.402, P = .023) and O-WM (r = 0.410, P = .020). Correlation between PMA and the rCBF of the caudate (r = −0.152, P = .406), F-GM (r = −0.045, P = .806), and O-GM (r = −0.157, P = .392) showed no statistical significance. Among nonlinear regression models, the logarithmic regression model was the best fit for the rCBF of the F-WM and PMA with an R2 value of 0.298 (P = .001). There was a positive relationship between the rCBF of the F-WM and PMA ([rCBF of F-WM] = −107.48 + 43.13 × log[PMA]). For the rCBF of the O-WM and PMA, the linear regression model was the best fit with an R2 value of 0.452 (P < .001), and there was a positive relationship between the 2 variables ([rCBF of O-WM] = 24.15 + 1.096 × [PMA]) (Fig 3).

Relationship between postmenstrual age and CBF. A single asterisk indicates P < .05; double asterisks, P < .001.
Discussion
This study showed that multidelay ASL could be applied to neonates and infants by optimizing PLD and T1 values. By multidelay ASL, absolute cerebral perfusion values in neonates and infants were estimated and a significantly higher wbCBF was observed in the older age groups. The rCBF of brain regions significantly differed according to age group. Intragroup analysis of rCBF showed higher perfusion in the occipital lobes compared with the frontal lobes. There was a negative correlation between PMA and the rCBF of the thalamus but a positive correlation between PMA and the rCBF of the WM.
The benefits of translating neonatal perfusion imaging into the clinical area are numerous because neonatal brain imaging can help predict neurodevelopmental outcomes.22⇓–24 Because brain MR imaging is now more commonly used in preterm neonates and in patients suspected of having brain injuries, identifying MR imaging parameters that correlate with neurodevelopmental outcomes is becoming more important.
Because functional activity and brain maturation can be indirectly measured by the cerebral metabolic rate, numerous attempts have been made to measure CBF in neonates. In the past, PET25⇓⇓–28and xenon-enhanced CT29 were used to estimate CBF in neonates. With these methods, a relatively low wbCBF was identified in neonates compared with adults. However, these past studies had inherent limitations due to radiation use and the invasive properties of their methods. The subsequent development and application of ASL in neonates showed results that were in agreement with former PET results.30 Still, an accurate estimation of CBF is challenging with ASL in neonates due to their low blood content and restricted water extraction in brain tissue along with physiologic low CBF, which all contribute to a low signal-to-noise ratio.11
The absolute wbCBF found in our study (15.5–18.3 mL/100 g/min) was higher than that in a previous ASL study of neonates (7–12 mL/100 g/min).7 We speculate that this difference is due to arterial transit-time correction with multidelay ASL. ASL incorporates a similar fundamental mechanism with PET, but it uses protons in the blood as tracers and is easily affected by arterial transit time. For example, the CBF of WM calculated from ASL was underestimated due to a longer arterial transit time compared with GM.31 In a similar manner, in occlusive diseases such as Moyamoya disease, arterial transit time is elongated in the affected hemispheres and results in underestimated CBF.13 With multiple PLDs, we could generate an arterial transit time map that was corrected for CBF values. It was possible to overcome delayed transit time in the adult population using this transit time–corrected CBF map made with multidelay ASL.32 While we did acquire arterial transit-time maps and showed median (interquartile range) values according to the age groups, analyzing regional and age-dependent arterial transit times was beyond the scope of this study. Still, investigating arterial transit times obtained by multidelay ASL and comparing single-delay and multidelay ASL in the neonatal population would be an interesting topic for future studies.
A prior neonatal ASL study measured a wbCBF of 16–21 mL/100 g/min,33 which is relatively higher than the wbCBF of our study. However, the study did not optimize the T1 value for neonates, which could result in overestimated CBF values. Hematocrit levels vary in neonates according to gestational age and continue to change,34 with the T1b being influenced by the hematocrit levels.9 Without augmentation of the T1 value for neonates, ASL could result in overestimated CBF.10,35
The higher wbCBF values observed in the older age groups and the positive correlation between PMA and wbCBF found in our study were consistent with those in previous studies.7,27,36 Unlike in the older age groups, which show a reversed pattern of decreasing CBF according to age,6 infants show a rapid increase in CBF according to age. By means of PET, infants with a PMA of 32–60 weeks were reported to have CBF from 5.5 to 18.7 μmol/100 g/min.27 This prior study showed a significant positive correlation between wbCBF and PMA as was seen in our results.27 In another study using phase-contrast MR imaging, a CBF of 18–30 mL/100 mL/min at birth rapidly increased with age and reached 60 mL/100 mL/min in 1 year.36 Compared with the number of studies in older populations, there have been very few studies on the physiologic evolution of CBF within 1 year of birth. Deeper insight into this field could be possible with future studies using noninvasive ASL.
Deep GM showed the highest rCBF values among the brain regions, and there was a negative trend of values with age, which is in line with findings in prior studies.7,27,29,33 Prior studies on brain metabolism in neonates showed that resting metabolism is not identical across the brain.7 Metabolism is generally low in the cortex at term but increases in the parietal, temporal, and occipital lobes by 3 months. The last region to increase its metabolism is the frontal cortex.37 A previous neonatal ASL study showed higher occipital cortical rCBF compared with frontal cortical rCBF in both preterm (68% versus 56%) and TEA neonates (92% versus 74%), though the study did not evaluate statistical significance.7 Still, 1 study using PET showed comparable occipital and frontal cortical CBF values in preterm (5.8 versus 6.5 μmol/100 g/min) and term neonates (8.7 versus 7.6 μmol/100 g/min).27 Except for in TEA neonates, the rCBF of the cortical GM in our study did not show significant difference between the frontal and occipital lobes. These discrepancies could be attributed to the small sample size of our study.
WM showed lower CBF values compared with GM, which is consistent with previous studies on neonates.33 In all age groups, the O-WM showed higher rCBF values compared with the F-WM. One possible explanation for this finding is the higher development of the O-WM compared with the F-WM. A number of studies have performed regional WM evaluation using MR imaging, and the most widely accepted tools are DWI1,2 and DTI.3 One DWI study evaluating the development of WM in different brain regions showed lower ADC values in the occipital peritrigonal WM compared with the F-WM.1 In addition, a DTI study showed lower isotropic diffusion values in the O-WM (1.46 × 10⁻³mm2/s) compared with the F-WM (1.56 × 10⁻³mm2/s).3 Because lower ADC and lower isotropic diffusion values suggest higher WM development, the higher rCBF in the O-WM in our study is in accordance with these studies. Still, we think that this result needs to be interpreted with caution. A meta-analysis of DWI studies performed on neonate brains showed similar ADC values in the O-WM (146.4–164.2 × 10⁻⁵mm2/s) and F-WM (147.9–161.9 × 10⁻⁵mm2/s), both of which were measured in the cortical WM.2 In that study, a relatively lower ADC value was observed in the subcortical WM (105.4–149.5 × 10⁻⁵mm2/s). Because we manually drew ROIs and the spatial resolution of ASL is generally low, including the subcortical WM of the occipital lobe might have resulted in significantly higher CBF compared with F-WM.
There are several limitations to this study. First, there were a limited number of subjects in each age group. The insignificant results found for some of the parameters might have been due to the small number of included subjects. In addition, the significant correlation between PMA and rCBF values could have been highly influenced by the infant group. Future studies with a larger number of subjects would offer additional information on the age-related changes of CBF in this young population. Second, the study population cannot fully represent healthy neonates and infants because there were subjects with clinical suspicion of brain injury. Still, we tried to minimize the effect of abnormal CBF by excluding subjects with visible abnormalities. In addition, TEA neonates cannot represent full-term neonates. We know that PMA rather than postnatal age is the chief factor in glucose use.14,27 However, preterm birth might disrupt the maturational program in a regionally specific manner, so TEA neonates cannot completely represent healthy full-term neonates.37 Third, the ASL signal could have been affected by head positioning in the coil. The infant brain has a larger variability of labeling efficiency due to variability in positioning within the standard head coil.38 We tried to position heads as centrally as possible in the coil during scanning. Still, the coil itself was not dedicated to neonates, and there was inevitable variability in head positioning. Fourth, sedation during scanning may have affected the CBF. Although chloral hydrate does not affect brain cortex activity,39 no thorough investigation has been performed on human CBF. On the other hand, midazolam causes dose-related changes in CBF.40 Natural sleep during scanning using the “feed and wrap” technique on neonates would be a better way of assessing normal development using CBF. Last, we used a single longitudinal relaxation value for brain tissue. The intrinsic longitudinal relaxation value, which is used for CBF estimation, differs by region, age, and subject. In neonates, the longitudinal relaxation value for WM is higher than for GM, and both WM and GM values decrease with PMA.10 Region-, age-, and subject-specific CBF estimations would be ideal; however, these are not yet applicable in this study as well as in most other clinical studies.
Conclusions
Multidelay ASL results in transit time-corrected CBF maps, which can show the developmental changes and differences occurring in neonates and infants. PMA was significantly correlated with regional changes in CBF. Because multidelay ASL could overcome transit delay in this young population, it could be a promising tool for imaging brain maturation processes.
Footnotes
Hyun Gi Kim and Jang Hoon Lee contributed equally to the study and share first authorship.
Disclosures: Hyun Gi Kim—RELATED: Grant: National Research Foundation of Korea grant was received. Detailed information is in the submitted work.
This work was funded by National Research Foundation of Korea (NRF-2017R1D1A1B03034768).
Paper previously presented at: Annual Meeting of the Radiological Society of North America, November 26 to December 1, 2017; Chicago, Illinois.
Indicates open access to non-subscribers at www.ajnr.org
References
- Received February 19, 2018.
- Accepted after revision July 8, 2018.
- © 2018 by American Journal of Neuroradiology


