Advertisement

Main menu

  • Home
  • Content
    • Current Issue
    • Accepted Manuscripts
    • Article Preview
    • Past Issue Archive
    • Video Articles
    • AJNR Case Collection
    • Case of the Week Archive
    • Case of the Month Archive
    • Classic Case Archive
  • Special Collections
    • AJNR Awards
    • Low-Field MRI
    • Alzheimer Disease
    • ASNR Foundation Special Collection
    • Photon-Counting CT
    • View All
  • Multimedia
    • AJNR Podcasts
    • AJNR SCANtastic
    • Trainee Corner
    • MRI Safety Corner
    • Imaging Protocols
  • For Authors
    • Submit a Manuscript
    • Submit a Video Article
    • Submit an eLetter to the Editor/Response
    • Manuscript Submission Guidelines
    • Statistical Tips
    • Fast Publishing of Accepted Manuscripts
    • Graphical Abstract Preparation
    • Imaging Protocol Submission
    • Author Policies
  • About Us
    • About AJNR
    • Editorial Board
    • Editorial Board Alumni
  • More
    • Become a Reviewer/Academy of Reviewers
    • Subscribers
    • Permissions
    • Alerts
    • Feedback
    • Advertisers
    • ASNR Home

User menu

  • Alerts
  • Log in

Search

  • Advanced search
American Journal of Neuroradiology

American Journal of Neuroradiology

ASHNR American Society of Functional Neuroradiology ASHNR American Society of Pediatric Neuroradiology ASSR
  • Alerts
  • Log in

Advanced Search

  • Home
  • Content
    • Current Issue
    • Accepted Manuscripts
    • Article Preview
    • Past Issue Archive
    • Video Articles
    • AJNR Case Collection
    • Case of the Week Archive
    • Case of the Month Archive
    • Classic Case Archive
  • Special Collections
    • AJNR Awards
    • Low-Field MRI
    • Alzheimer Disease
    • ASNR Foundation Special Collection
    • Photon-Counting CT
    • View All
  • Multimedia
    • AJNR Podcasts
    • AJNR SCANtastic
    • Trainee Corner
    • MRI Safety Corner
    • Imaging Protocols
  • For Authors
    • Submit a Manuscript
    • Submit a Video Article
    • Submit an eLetter to the Editor/Response
    • Manuscript Submission Guidelines
    • Statistical Tips
    • Fast Publishing of Accepted Manuscripts
    • Graphical Abstract Preparation
    • Imaging Protocol Submission
    • Author Policies
  • About Us
    • About AJNR
    • Editorial Board
    • Editorial Board Alumni
  • More
    • Become a Reviewer/Academy of Reviewers
    • Subscribers
    • Permissions
    • Alerts
    • Feedback
    • Advertisers
    • ASNR Home
  • Follow AJNR on Twitter
  • Visit AJNR on Facebook
  • Follow AJNR on Instagram
  • Join AJNR on LinkedIn
  • RSS Feeds

AJNR Awards, New Junior Editors, and more. Read the latest AJNR updates

Research ArticleAdult Brain

Comparison between the Prebolus T1 Measurement and the Fixed T1 Value in Dynamic Contrast-Enhanced MR Imaging for the Differentiation of True Progression from Pseudoprogression in Glioblastoma Treated with Concurrent Radiation Therapy and Temozolomide Chemotherapy

J.G. Nam, K.M. Kang, S.H. Choi, W.H. Lim, R.-E. Yoo, J.-H. Kim, T.J. Yun and C.-H. Sohn
American Journal of Neuroradiology October 2017, DOI: https://doi.org/10.3174/ajnr.A5417
J.G. Nam
aFrom the Department of Radiology (J.G.N., K.M.K., S.H.C., W.H.L., R.-E.Y., J.-H.K., T.J.Y., C.-H.S.), Seoul National University Hospital, Seoul, Korea
  • Find this author on Google Scholar
  • Find this author on PubMed
  • Search for this author on this site
  • ORCID record for J.G. Nam
K.M. Kang
aFrom the Department of Radiology (J.G.N., K.M.K., S.H.C., W.H.L., R.-E.Y., J.-H.K., T.J.Y., C.-H.S.), Seoul National University Hospital, Seoul, Korea
  • Find this author on Google Scholar
  • Find this author on PubMed
  • Search for this author on this site
  • ORCID record for K.M. Kang
S.H. Choi
aFrom the Department of Radiology (J.G.N., K.M.K., S.H.C., W.H.L., R.-E.Y., J.-H.K., T.J.Y., C.-H.S.), Seoul National University Hospital, Seoul, Korea
bCenter for Nanoparticle Research, Institute for Basic Science (S.H.C., C.-H.S.)
cSchool of Chemical and Biological Engineering (S.H.C.), Seoul National University, Seoul, Korea.
  • Find this author on Google Scholar
  • Find this author on PubMed
  • Search for this author on this site
  • ORCID record for S.H. Choi
W.H. Lim
aFrom the Department of Radiology (J.G.N., K.M.K., S.H.C., W.H.L., R.-E.Y., J.-H.K., T.J.Y., C.-H.S.), Seoul National University Hospital, Seoul, Korea
  • Find this author on Google Scholar
  • Find this author on PubMed
  • Search for this author on this site
  • ORCID record for W.H. Lim
R.-E. Yoo
aFrom the Department of Radiology (J.G.N., K.M.K., S.H.C., W.H.L., R.-E.Y., J.-H.K., T.J.Y., C.-H.S.), Seoul National University Hospital, Seoul, Korea
  • Find this author on Google Scholar
  • Find this author on PubMed
  • Search for this author on this site
  • ORCID record for R.-E. Yoo
J.-H. Kim
aFrom the Department of Radiology (J.G.N., K.M.K., S.H.C., W.H.L., R.-E.Y., J.-H.K., T.J.Y., C.-H.S.), Seoul National University Hospital, Seoul, Korea
  • Find this author on Google Scholar
  • Find this author on PubMed
  • Search for this author on this site
  • ORCID record for J.-H. Kim
T.J. Yun
aFrom the Department of Radiology (J.G.N., K.M.K., S.H.C., W.H.L., R.-E.Y., J.-H.K., T.J.Y., C.-H.S.), Seoul National University Hospital, Seoul, Korea
  • Find this author on Google Scholar
  • Find this author on PubMed
  • Search for this author on this site
  • ORCID record for T.J. Yun
C.-H. Sohn
aFrom the Department of Radiology (J.G.N., K.M.K., S.H.C., W.H.L., R.-E.Y., J.-H.K., T.J.Y., C.-H.S.), Seoul National University Hospital, Seoul, Korea
bCenter for Nanoparticle Research, Institute for Basic Science (S.H.C., C.-H.S.)
  • Find this author on Google Scholar
  • Find this author on PubMed
  • Search for this author on this site
  • ORCID record for C.-H. Sohn
  • Article
  • Figures & Data
  • Info & Metrics
  • Responses
  • References
  • PDF
Loading

Article Figures & Data

Figures

  • Tables
  • Fig 1.
    • Download figure
    • Open in new tab
    • Download powerpoint
    Fig 1.

    Flowchart of the inclusion and exclusion criteria of our study population.

  • Fig 2.
    • Download figure
    • Open in new tab
    • Download powerpoint
    Fig 2.

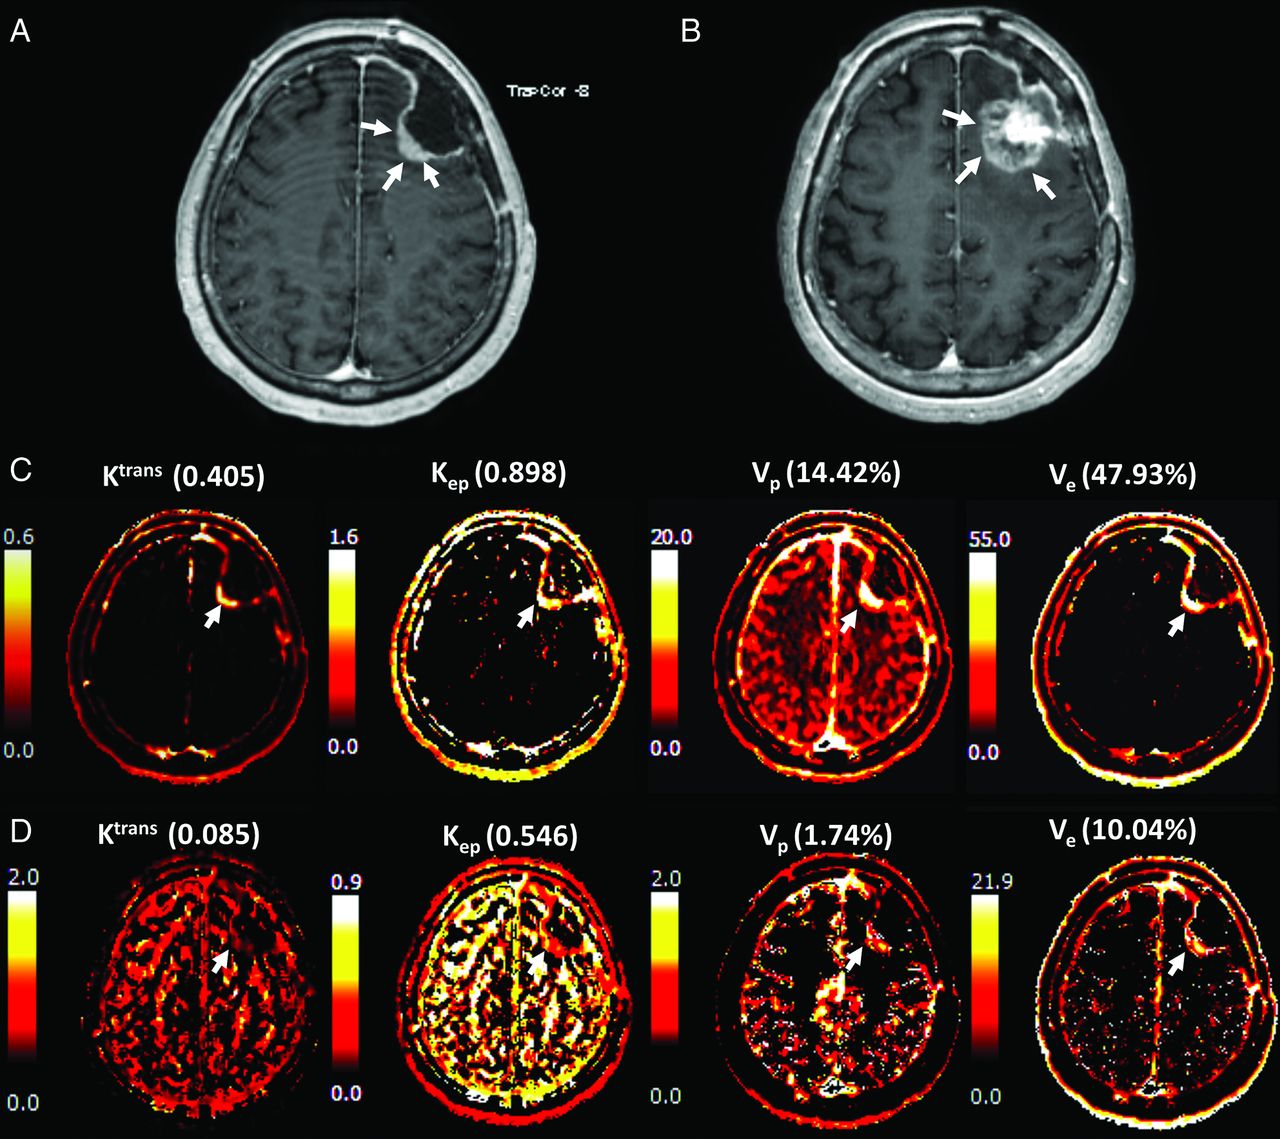
    A 68-year-old female patient with surgically proved glioblastoma presented A, a newly appeared enhancing nodule on DCE-MR imaging taken 1 month after temozolomide chemoradiation. The lesion was not identified on the postoperative MR imaging. B, The lesion was markedly increased after 6 cycles of temozolomide chemotherapy, implying that the lesion was true progression according to the Response Assessment in Neuro-Oncology criteria. The pharmacokinetic DCE maps, especially those for Ktrans and Kep, showed a bright signal from both the C, fixed T1 and D, measured T1 methods.

  • Fig 3.
    • Download figure
    • Open in new tab
    • Download powerpoint
    Fig 3.

    A 57-year-old female patient with surgically proved glioblastoma presented A, a newly appeared enhancing nodule on DCE-MR imaging taken 1 month after temozolomide chemoradiation. B, The lesion had disappeared after 6 cycles of temozolomide chemotherapy, defining the lesion as a pseudoprogression according to the Response Assessment in Neuro-Oncology criteria. The pharmacokinetic DCE maps, especially those for Ktrans and Kep, showed less intense signals from both C, the fixed T1 and D, measured T1 methods.

Tables

  • Figures
    • View popup
    Table 1:

    Clinical information of the enrolled patients

    VariableTrue Progression (n = 15)Pseudoprogression (n = 22)P Valuea
    Age, yr (mean ± SD)59.6 ± 11.956.7 ± 13.7.61
    Gender.12
        Male9 (60.0%)17 (77.3%)
        Female6 (40.0%)5 (22.7%)
    Surgery.24
        Biopsy4 (26.7%)2 (9.1%)
        Subtotal6 (40.0%)9 (40.9%)
        Total5 (33.3%)11 (50.0%)
    Time interval of end of TMZ-chemoradiation to DCE MRI, d (mean ± SD [range])27.0 ± 7.3 [15–44]28.7 ± 6.0 [17–44].39
    End of adjuvant TMZ chemotherapy to follow-up MRI, d (mean ± SD [range])31.2 ± 10.6 [20–53]b26.2 ± 8.7 [16–54].46
    Initial operation to the last follow-up, d (mean ± SD [range])391.4 ± 156.3 [224–716]657.3374.7 [274–1774].002
    • ↵a P values are from either Student t test or the χ2 test, as appropriate, for all variables.

    • ↵b Four patients who underwent pathologic confirmation (n = 2) or developed obvious clinical deterioration before the termination of adjuvant TMZ chemotherapy (n = 2) were excluded for this parameter.

    • View popup
    Table 2:

    Comparison of the DCE pharmacokinetic parameters of patients with true progression versus pseudoprogression

    Pharmacokinetic ParameterT1 MethodTrue Progression (n = 15)Pseudoprogression (n = 22)P ValueaIntraclass Correlation Coefficient [95% CI]
    Mean ± SDMedian [range]Mean ± SDMedian [range]IntraobserverInterobserver
    Ktrans, min−1Fixed0.138 ± 0.1480.096 [0.042–0.579]0.068 ± 0.0430.064 [0.0005–0.154].05b0.893 [0.792–0.945]0.897 [0.799–0.947]
    Measured0.126 ± 0.1390.069 [0.025–0.499]0.056 ± 0.0450.058 [0.0001–0.194].100.923 [0.850–0.960]0.943 [0.888–0.970]
    Kep, min−1Fixed0.321 ± 0.2440.244 [0.135–1.082]0.179 ± 0.1030.179 [0.024–0.483].01b0.910 [0.825–0.954]0.929 [0.862–0.963]
    Measured0.224 ± 0.1080.202 [0.035–0.396]0.192 ± 0.1480.157 [0.009–0.494].470.861 [0.729–0.928]0.882 [0.771–0.939]
    Vp, %Fixed3.309 ± 4.4291.468 [0.709–18.298]1.998 ± 1.4621.705 [0.140–6.723].600.872 [0.752–0.934]0.888 [0.784–0.943]
    Measured2.358 ± 2.7011.339 [0.478–10.407]1.521 ± 1.4561.134 [0.081–6.056].270.800 [0.605–0.895]0.688 [0.394–0.839]
    VeFixed0.536 ± 0.3300.446 [0.168–1.050]0.506 ± 0.2840.482 [0.114–1.156].770.761 [0.537–0.877]0.718 [0.516–0.844]
    Measured0.550 ± 0.5110.377 [0.121–1.192]0.316 ± 0.2650.270 [0.041–1.297].080.937 [0.877–0.968]0.936 [0.875–0.967]
    • ↵a P values are from Student t test when the variables satisfied normality (Kep from measured T1 and Ve from fixed T1) or from Mann-Whitney U tests otherwise, according to Kolmogorov-Smirnov test.

    • ↵b Significant P value for each test.

    • View popup
    Table 3:

    Diagnostic performance of the DCE pharmacokinetic parameters in detecting true progression

    Pharmacokinetic ParameterT1 MethodMedian AUCOptimal Threshold ValueSensitivity [%]Specificity [%]P Valuea
    Ktrans, min−1Fixed0.6940.09353.386.4.03b
    Measured0.6640.059.08
    Kep, min−1Fixed0.7520.18480.063.6.002b
    Measured0.6030.159.28
    Vp, %Fixed0.5523.423.62
    Measured0.6090.597.25
    VeFixed0.5180.349.86
    Measured0.6060.546.30
    • Note:—Ve indicates extravascular extracellular space per unit volume; Vp, blood plasma volume per unit volume.

    • ↵a P values are from the receiver operating characteristics analysis.

    • ↵b Significant P value for each test.

    • View popup
    Table 4:

    Diagnostic performance of Kep from the fixed T1 and results from the leave-one-out cross-validation

    Median AUCOptimal Threshold ValueSensitivitySpecificityAccuracyPositive Predictive ValueNegative Predictive Value
    0.7520.18480.0% (12/15)63.6% (14/22)70.3% (26/37)60.0% (12/20)82.4% (14/17)
    Leave-one-out cross-validation73.3% (11/15)59.1% (13/22)64.9% (24/37)55.0% (11/20)76.5% (13/17)
Next
Back to top
Advertisement
Print
Download PDF
Email Article

Thank you for your interest in spreading the word on American Journal of Neuroradiology.

NOTE: We only request your email address so that the person you are recommending the page to knows that you wanted them to see it, and that it is not junk mail. We do not capture any email address.

Enter multiple addresses on separate lines or separate them with commas.
Comparison between the Prebolus T1 Measurement and the Fixed T1 Value in Dynamic Contrast-Enhanced MR Imaging for the Differentiation of True Progression from Pseudoprogression in Glioblastoma Treated with Concurrent Radiation Therapy and Temozolomide Ch…
(Your Name) has sent you a message from American Journal of Neuroradiology
(Your Name) thought you would like to see the American Journal of Neuroradiology web site.
CAPTCHA
This question is for testing whether or not you are a human visitor and to prevent automated spam submissions.
Cite this article
J.G. Nam, K.M. Kang, S.H. Choi, W.H. Lim, R.-E. Yoo, J.-H. Kim, T.J. Yun, C.-H. Sohn
Comparison between the Prebolus T1 Measurement and the Fixed T1 Value in Dynamic Contrast-Enhanced MR Imaging for the Differentiation of True Progression from Pseudoprogression in Glioblastoma Treated with Concurrent Radiation Therapy and Temozolomide Chemotherapy
American Journal of Neuroradiology Oct 2017, DOI: 10.3174/ajnr.A5417

Citation Manager Formats

  • BibTeX
  • Bookends
  • EasyBib
  • EndNote (tagged)
  • EndNote 8 (xml)
  • Medlars
  • Mendeley
  • Papers
  • RefWorks Tagged
  • Ref Manager
  • RIS
  • Zotero
0 Responses
Respond to this article
Share
Bookmark this article
Comparison between the Prebolus T1 Measurement and the Fixed T1 Value in Dynamic Contrast-Enhanced MR Imaging for the Differentiation of True Progression from Pseudoprogression in Glioblastoma Treated with Concurrent Radiation Therapy and Temozolomide Chemotherapy
J.G. Nam, K.M. Kang, S.H. Choi, W.H. Lim, R.-E. Yoo, J.-H. Kim, T.J. Yun, C.-H. Sohn
American Journal of Neuroradiology Oct 2017, DOI: 10.3174/ajnr.A5417
del.icio.us logo Twitter logo Facebook logo Mendeley logo
  • Tweet Widget
  • Facebook Like
  • Google Plus One
Purchase

Jump to section

  • Article
    • Abstract
    • ABBREVIATIONS:
    • Materials and Methods
    • Results
    • Discussion
    • Conclusions
    • References
  • Figures & Data
  • Info & Metrics
  • Responses
  • References
  • PDF

Related Articles

  • No related articles found.
  • PubMed
  • Google Scholar

Cited By...

  • Differentiating Low-Grade from High-Grade Intracranial Ependymomas: Comparison of Dynamic Contrast-Enhanced MRI and Diffusion-Weighted Imaging
  • Dynamic Contrast-Enhanced MR Imaging of Nonenhancing T2 High-Signal-Intensity Lesions in Baseline and Posttreatment Glioblastoma: Temporal Change and Prognostic Value
  • Crossref
  • Google Scholar

This article has not yet been cited by articles in journals that are participating in Crossref Cited-by Linking.

More in this TOC Section

  • Diagnostic Neuroradiology of Monoclonal Antibodies
  • NCCT vs. MRI for Brain Atrophy in Acute Stroke
  • Clinical Outcomes After Chiari I Decompression
Show more Adult Brain

Similar Articles

Advertisement

Indexed Content

  • Current Issue
  • Accepted Manuscripts
  • Article Preview
  • Past Issues
  • Editorials
  • Editor's Choice
  • Fellows' Journal Club
  • Letters to the Editor
  • Video Articles

Cases

  • Case Collection
  • Archive - Case of the Week
  • Archive - Case of the Month
  • Archive - Classic Case

More from AJNR

  • Trainee Corner
  • Imaging Protocols
  • MRI Safety Corner
  • Book Reviews

Multimedia

  • AJNR Podcasts
  • AJNR Scantastics

Resources

  • Turnaround Time
  • Submit a Manuscript
  • Submit a Video Article
  • Submit an eLetter to the Editor/Response
  • Manuscript Submission Guidelines
  • Statistical Tips
  • Fast Publishing of Accepted Manuscripts
  • Graphical Abstract Preparation
  • Imaging Protocol Submission
  • Evidence-Based Medicine Level Guide
  • Publishing Checklists
  • Author Policies
  • Become a Reviewer/Academy of Reviewers
  • News and Updates

About Us

  • About AJNR
  • Editorial Board
  • Editorial Board Alumni
  • Alerts
  • Permissions
  • Not an AJNR Subscriber? Join Now
  • Advertise with Us
  • Librarian Resources
  • Feedback
  • Terms and Conditions
  • AJNR Editorial Board Alumni

American Society of Neuroradiology

  • Not an ASNR Member? Join Now

© 2025 by the American Society of Neuroradiology All rights, including for text and data mining, AI training, and similar technologies, are reserved.
Print ISSN: 0195-6108 Online ISSN: 1936-959X

Powered by HighWire