
Abstract
BACKGROUND AND PURPOSE: Cervical spinal cord compression, defined as spinal cord deformity and severe narrowing of the spinal canal in the cervical region, can lead to severe clinical consequences, including intractable pain, sensory disturbance, paralysis, and even death, and may require emergent intervention to prevent negative outcomes. Despite the critical nature of cord compression, no automated tool is available to alert clinical radiologists to the presence of such findings. This study aims to demonstrate the ability of a vision transformer (ViT) model for the accurate detection of cervical cord compression.
MATERIALS AND METHODS: A clinically diverse cohort of 142 cervical spine MRIs was identified, 34% of which were normal or had mild stenosis, 31% with moderate stenosis, and 35% with cord compression. Utilizing gradient-echo images, slices were labeled as no cord compression/mild stenosis, moderate stenosis, or severe stenosis/cord compression. Segmentation of the spinal canal was performed and confirmed by neuroradiology faculty. A pretrained ViT model was fine-tuned to predict section-level severity by using a train:validation:test split of 60:20:20. Each examination was assigned an overall severity based on the highest level of section severity, with an examination labeled as positive for cord compression if ≥1 section was predicted in the severe category. Additionally, 2 convolutional neural network (CNN) models (ResNet50, DenseNet121) were tested in the same manner.
RESULTS: The ViT model outperformed both CNN models at the section level, achieving section-level accuracy of 82%, compared with 72% and 78% for ResNet and DenseNet121, respectively. ViT patient-level classification achieved accuracy of 93%, sensitivity of 0.90, positive predictive value of 0.90, specificity of 0.95, and negative predictive value of 0.95. Receiver operating characteristic area under the curve was greater for ViT than either CNN.
CONCLUSIONS: This classification approach using a ViT model and rules-based classification accurately detects the presence of cervical spinal cord compression at the patient level. In this study, the ViT model outperformed both conventional CNN approaches at the section and patient levels. If implemented into the clinical setting, such a tool may streamline neuroradiology workflow, improving efficiency and consistency.
ABBREVIATIONS:
- AI
- artificial intelligence
- AUC
- area under the curve
- CNN
- convolutional neural network
- ER
- emergency room
- GRE
- gradient-echo
- NPV
- negative predictive value
- PPV
- positive predictive value
- ViT
- vision transformer
Cervical spinal cord compression, a clinical entity which results from severe narrowing of the spinal canal by an extrinsic source, is widely recognized as a clinical emergency, and can lead to severe clinical consequences, including muscular weakness, pain, sensory disturbances, paralysis, and even death. Early medical and surgical intervention in the setting of severe spinal canal stenosis and spinal cord compression has been shown to improve long-term neurologic outcomes.1 Although CT has its own advantages in evaluation of the spine in terms of bone integrity, MR imaging is the reference standard for evaluation of the soft tissues, intervertebral discs, and spinal cord. MR imaging examinations of the cervical spine are increasingly utilized in the acute or emergent setting and are frequently interpreted by general radiologists.2,3
A continuous growth in frequency of cross-sectional imaging performed has led to explosive growth in demands on interpreting radiologists, who are now often required to interpret an average of one image every 3–4 seconds to meet workload demands.4 There is extensive academic research and private investment aiming to utilize artificial intelligence (AI) as a tool to augment radiologist productivity, improve accuracy, and reduce cognitive strain. Additionally, radiology AI has shown promise as a triaging tool to preview examinations as soon as they are performed, reorganizing these examinations to the top of the clinical worklist and alerting radiologists to possible abnormal findings.5⇓-7
Previous work in this domain has demonstrated the ability of convolutional neural network (CNN) algorithms to detect cervical cord compression at the section level in patients with known diagnosis of cervical myelopathy.8 Additional studies have shown ability of CNNs to detect patient-level spinal pathology; however, most of these have focused exclusively on degenerative disc disease, the lumbar spine, or have utilized nonclinically representative cohorts.9⇓⇓⇓⇓-14 To our knowledge, no study has leveraged individual section-level predictions to generate an overall patient-level severity prediction, a method of classification that mimics the manner in which a practicing radiologist would view cervical spine MR imaging.
Additionally, while previously published work has demonstrated impressive results utilizing CNNs, none to our knowledge has leveraged vision transformers (ViTs), a cutting-edge deep learning architecture, for the detection of cervical spinal pathology. ViTs have gained prominence in the medical/radiologic image analysis field since 2020 for their facility in segmentation and classification, frequently demonstrating comparable or superior results to CNNs.15⇓⇓⇓-19 In addition to their measurable performance, ViTs hold great promise as a tool in medical imaging analysis because of their ability to capture long-range, global dependencies within an image compared with the local receptive fields of CNNs.20,21
ViT brought forth a novel approach by considering images as sequences comprising patches, subsequently processing these patches by using transformer blocks. The self-attention mechanism present in ViT enables the capture of comprehensive global contextual information by facilitating long-range interactions between different regions or patches within the images.22 As such, ViT offers a promising solution for encoding meaningful and intricate representations of complex structures, wherein both shape and spatial arrangement are pivotal elements in cord compression classification.
Developing a reliable and validated tool to detect cord compression could meaningfully streamline the work of practicing emergency room (ER), general, and neuroradiologists by helping to triage their worklist. Without such a tool, the practicing radiologist may have a cervical spine MR imaging on their worklist with critical cord compression but no warning until they physically open the examination. This study demonstrates the ability of a ViT combined with simple rules-based classification to accurately evaluate cervical spine MRIs for cord compression with high accuracy. This study also compares the performance of the proposed ViT model to 2 conventional CNN architectures.
MATERIALS AND METHODS
Patient Selection and Image Preprocessing
Following institutional review board approval for this retrospective study, an initial cohort was identified utilizing an internal proprietary search engine that indexes radiology reports performed at our institution. Search terms included “MR imaging cervical spine,” “severe stenosis,” “cord compression,” “moderate stenosis,” and “mild stenosis.” Examination reports were then reviewed chronologically preceding from 2022 backward until a sufficient number of examinations was identified, culminating in a study period extending from 2017–2022.
To ensure a balanced representation of the disease severity categories at the patient level, the cohort was constructed such that 63 of the patients had radiologic reports describing normal examinations or mild stenosis, 64 with up to moderate stenosis at least 1 or more spinal level, and 55 had severe stenosis or cord compression at 1 or more levels, comprising a total of 182 studies.
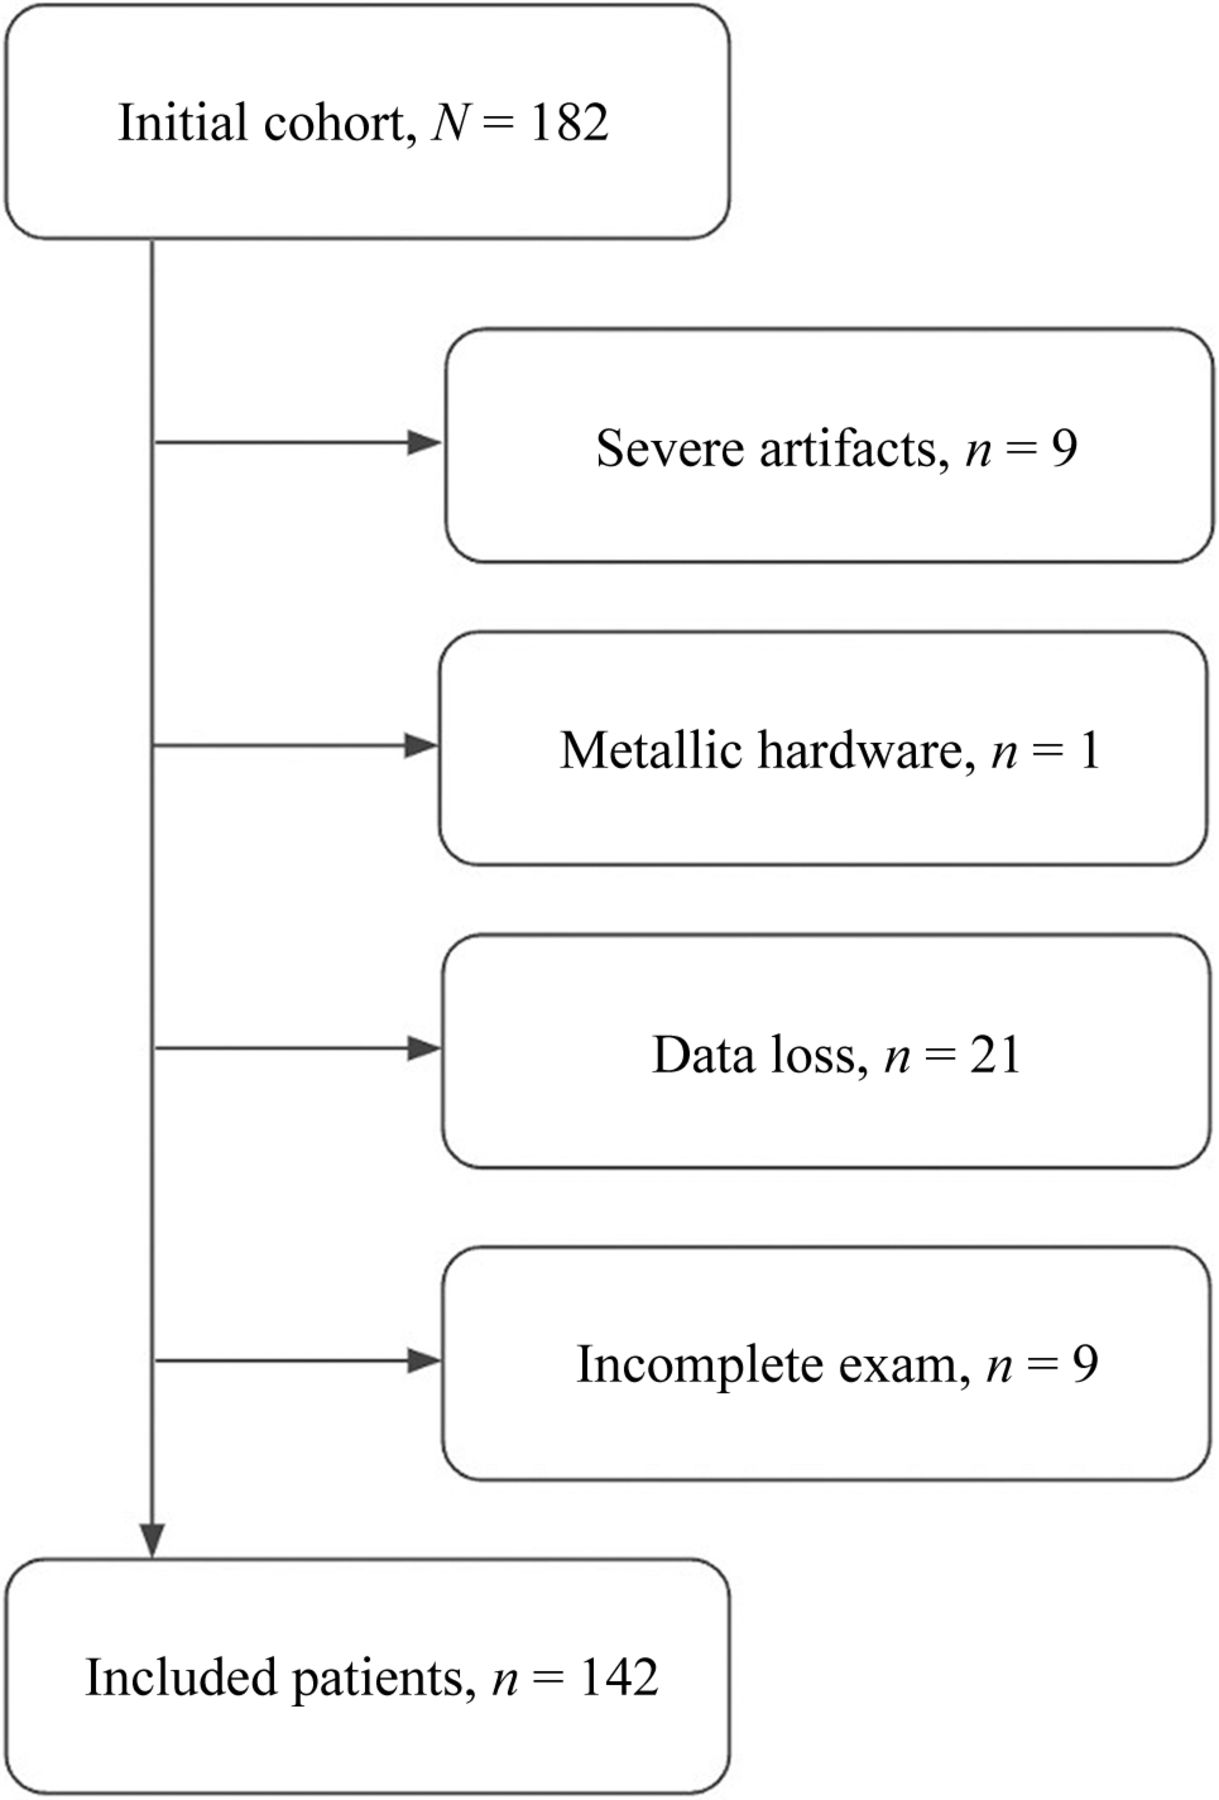
A total of 40 of these examinations were excluded secondary to severe artifacts (9 patients), presence of metallic hardware (1 patient), data quality (21 patients), or a lack of an axial gradient-echo (GRE) sequence (9 patients) (Fig 1). Of the resulting cohort of 142 patients, 34% were described in their final radiology reports as normal or with up to mild stenosis, 31% with up to moderate stenosis, and 35% with cord compression.

Flow chart of patient inclusion.
A total of 27% of studies were obtained on a 3T Siemens magnet, and the remainder were obtained on 1.5T GE Healthcare and Siemens magnets. Typical scanner parameters for the axial GRE sequence included TR of 538–761 ms, TE of 13 ms, flip angle of 30°, field of view of 165–180 mm, number of excitations of 1–3, section thickness of 3 mm, section gap of 0 mm, matrix size of 320–384 × 128–192, 34–64 slices, and sequence acquisition time of 2.5–4.0 minutes. Gradient-echo imaging was selected as our sequence of interest because of prominent CSF flow artifact on a large number of spin-echo T2 images that were initially reviewed, as well as internal clinical protocols specific to our institution.
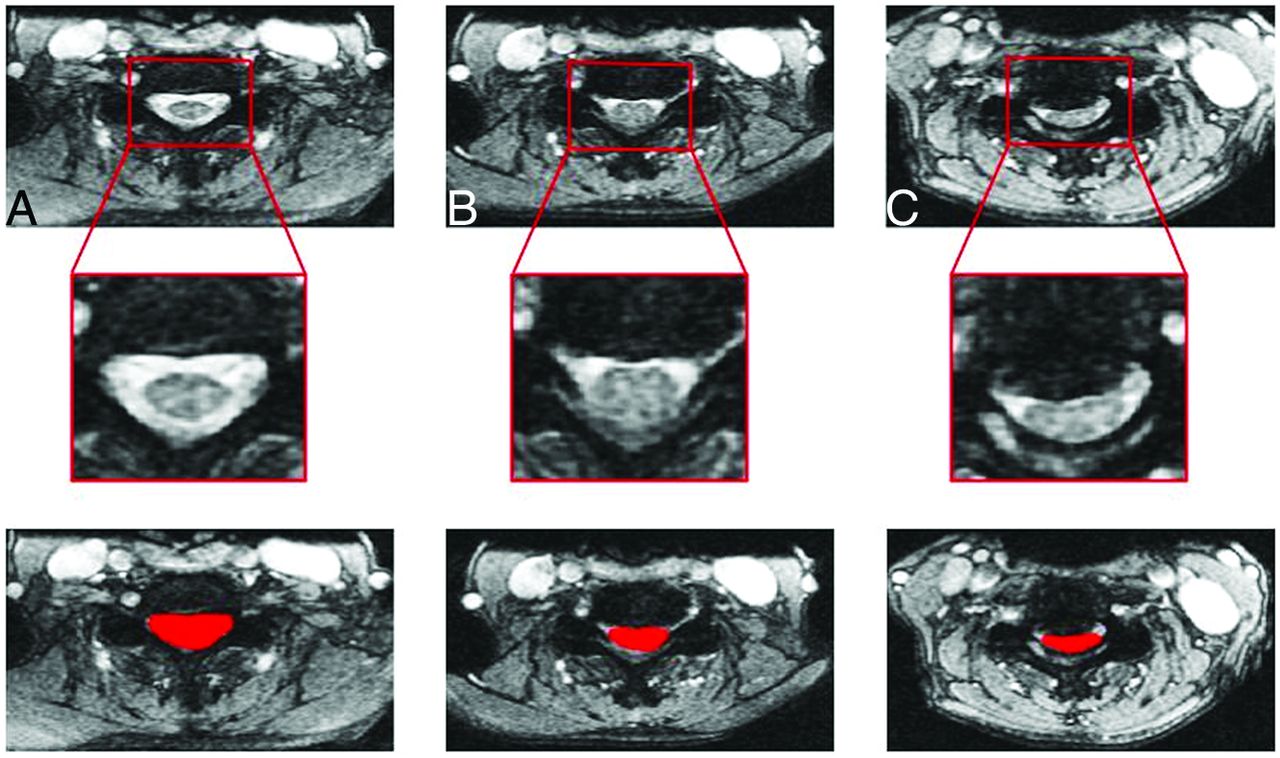
These studies were then anonymized and converted to NIfTI format. Axial gradient-echo slices were labeled as 0 = normal/mild stenosis, 1= moderate stenosis, and 2 = cord compression utilizing a classification scheme simplified from Kang et al, and adapted to the axial plane.22 Specifically, mild stenosis was defined as loss of subarachnoid space up to 50%, moderate stenosis with loss of subarachnoid space greater than 50%, and cord compression with complete loss of subarachnoid space and frank cord deformity, with or without T2 hyperintensity within the cord. Additionally, the spinal canal was manually segmented by using ITK-SNAP segmentation software (Fig 2). These tasks were performed by 3 senior radiology resident physicians (PGY-4 and PGY-5 levels) and further confirmed by senior neuroradiology faculty with > 15 years of experience. Section-level ground truth severity was initially judged by the resident team, with all cases reviewed and grading modified as needed by the above criteria by fellowship-trained neuroradiology faculty before any analysis was performed.

Representative GRE images of the cervical spine (top) with insets (middle) and examples of spinal canal segmentations (bottom) performed by trained radiology physicians demonstrating examples of no/mild stenosis (A), moderate stenosis (B), and severe stenosis/cord compression (C).
ViT Model and Patient-Level Prediction
For our study, a ViT model pretrained on ImageNet was fine-tuned by using PyTorch (https://pytorch.org/) to predict section-level severity by using a train:validation:test split of 60:20:20, a batch size of 16, and 200 epochs.
Experiments were performed to assess model accuracy at 3-level prediction (normal/mild stenosis versus moderate stenosis versus cord compression) by using a forced square centered on the manual segmentation of the spinal canal as the area of interest (Fig 3). Patient-level severity was judged based on the highest degree of section severity within each examination, with a patient/examination was judged as having been categorized as “severe” if ≥1 section was predicted as having severe disease. Accuracy, sensitivity, specificity, positive predictive value (PPV), and negative predictive value (NPV) were calculated based on a comparison of the patient-level predictions with the ground-truth patient-level severity.

Vision transformer analysis pipeline. Images are divided into flattened patches, which are then fed into the transformer encoder along with positional encoding. For each section, a prediction of severity is generated.
In addition to the ViT model, our study also encompassed the evaluation of 2 popular CNN architectures, ResNet50 and DenseNet121. These models were chosen because of their recognized efficacy and widespread popularity within radiology AI, including within studies of cervical spine pathology.12,23 Performance of the 3 models (ViT, ResNet, DenseNet) was compared, both at the section level and patient level.
RESULTS
Patient Characteristics
Patient characteristics are summarized in Table 1. No significant differences were present when comparing differences in patient age, sex, acute history of trauma, or clinical setting (emergency room versus inpatient versus outpatient) between the training/validation cohort and the testing cohort utilizing t-test for continuous and χ2 for categoric variables (all P > .05, Table 1). The most common etiologies of trauma were fall and motor vehicle crashes. The most common presenting histories in patients without history of acute trauma were degenerative disc disease, malignancy, concern for infection, upper extremity sensory/motor disturbances, and multiple sclerosis.
Patient demographics and clinical setting in the training/validation and testing cohorts
Section-Level Characteristics
To avoid overfitting, the model was trained and validated on a balanced subset of the data, with a roughly equivalent number of severe/moderate and normal/mild slices. The training/validation data set consisted of 716 normal/mild images, 496 moderate images, and 234 images with cord compression and a total of 113 examinations.
To better reflect real-world conditions, the testing set, which was balanced at the examination/patient level (10 cases with compression, 9 with moderate disease, 10 with mild/no disease), was left unbalanced at the section level. This left a data set with 1241 normal/mild slices, 99 moderate slices, and 25 severe slices.
Image and Patient-Level Experiment Results
ViT outperformed ResNet50 and DenseNet121 at the section level, achieving 82% accuracy in the classification of spinal stenosis and cord compression. By comparison, ResNet50 achieved section-level accuracy of 72% and DenseNet121 yielded 78% accuracy. Significance of these differences in accuracy was confirmed by using pair-wise comparison (ViT versus ResNet50, ViT versus DenseNet121, ResNet50 versus DenseNet121) using the McNemar test (P < .001 comparing ViT versus ResNet50, P = .008 comparing ViT versus DenseNet 121, P < .001 comparing ResNet50 versus DenseNet121).
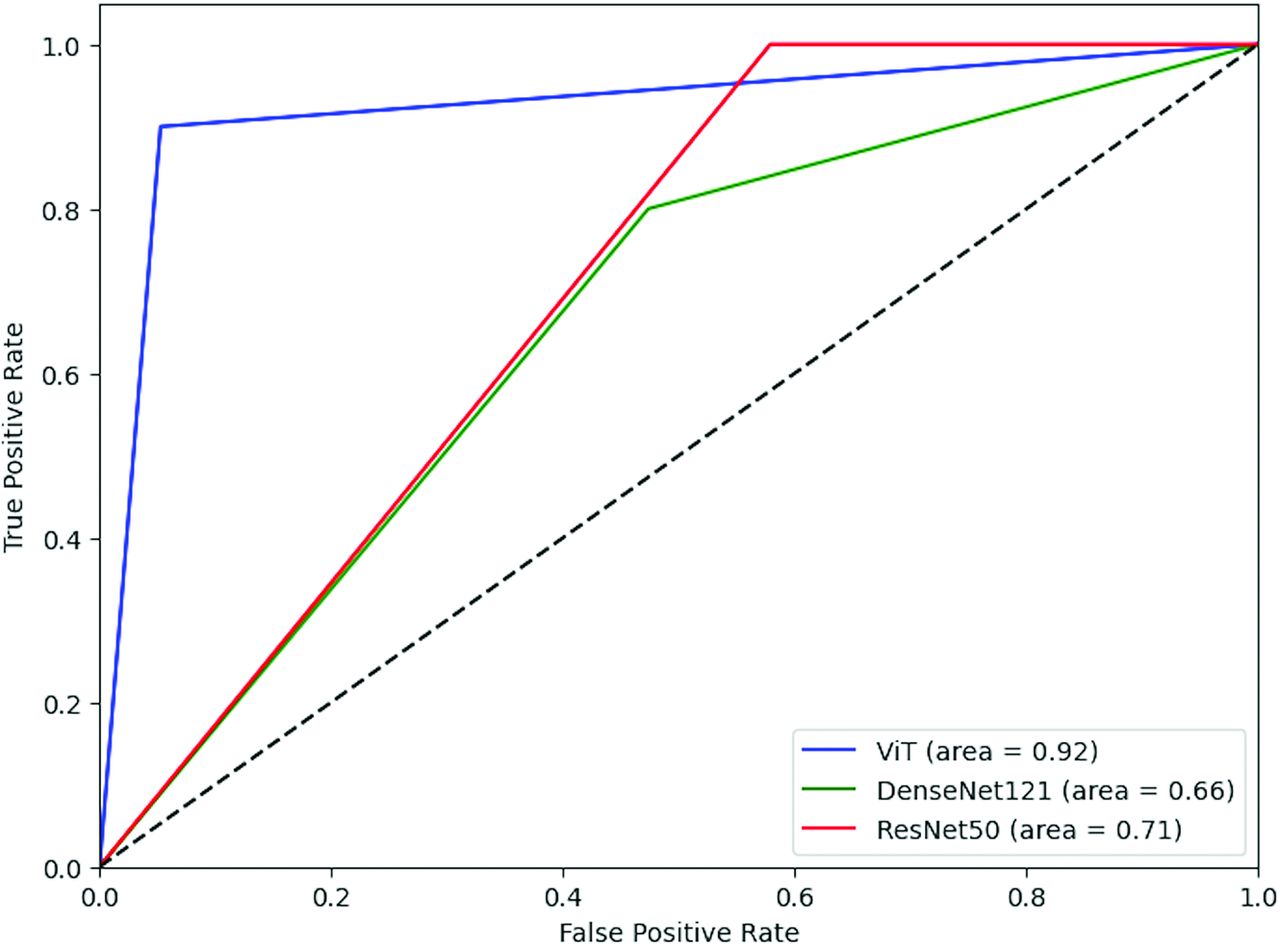
ViT also outperformed the CNNs at patient-level prediction, with sensitivity of 0.90, PPV of 0.90, specificity of 0.95, and NPV value of 0.95. Receiver operating characteristic curves were generated for each model’s patient-level classification accuracy, with area under the curve (AUC) of 0.92 for ViT, 0.71 for ResNet50, and 0.66 for DenseNet121 (Fig 4). Pair-wise comparison was performed for each model by using the DeLong test, which demonstrated significantly greater AUC of ViT compared with both DenseNet 121 and ResNet50 (P = .014 comparing ViT versus ResNet50, P = .015 comparing ViT versus DenseNet121), but no significant difference between ResNet50 and DenseNet121 (P = .66).

Receiver operating characteristic curves comparing patient-level performance of ViT, DenseNet121, and ResNet50 in detecting cord compression.
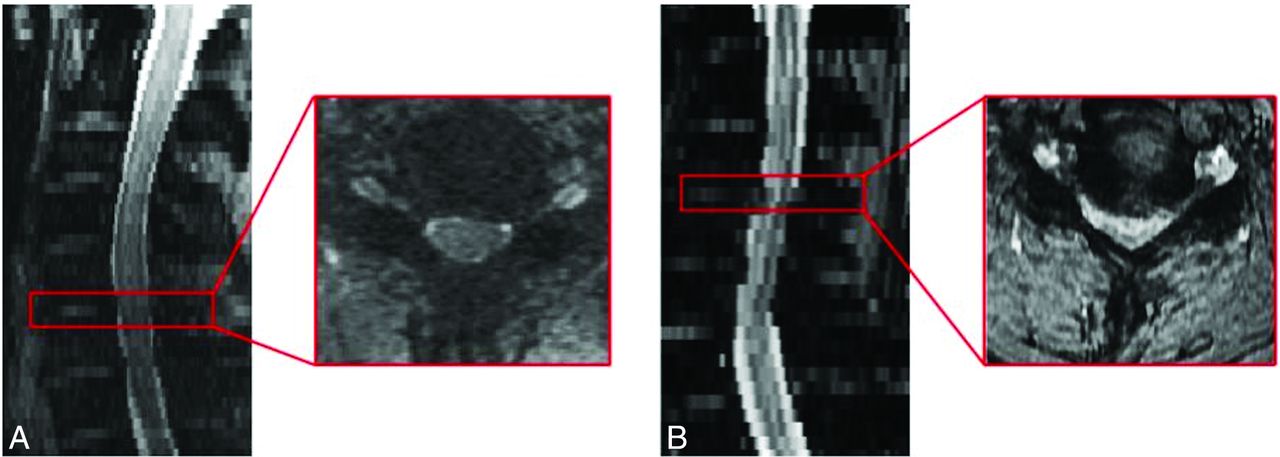
Two cases within the testing set were misclassified: 1 falsely negative and the other falsely positive for cord compression (Fig 5). No differences in accuracy were observed when considering differences in sex, age, or clinical setting.

False-positive and -negative cases. A, False-positive: Diffuse congenital moderate stenosis with small superimposed annular bulge, incorrectly categorized as positive for cord compression. B, False-negative: Large annular bulge with severe spinal stenosis and cord compression and abnormal T2 hyperintense signal within the cord, incorrectly categorized as negative for cord compression.
While the ResNet50 model demonstrated 100% sensitivity and NPV in patient-level classification, specificity and PPV were poor, at 0.42 and 0.47, respectively. DenseNet121-based patient-level classification underperformed both models at patient-level prediction, with sensitivity of 0.8, specificity of 0.52, PPV of 0.47, and NPV of 0.83. These results are summarized in Table 2.
Section-level and patient-level test results for ViT, ResNet50, and DenseNet121 models
Post hoc power analyses were performed for both section-level and patient-level classification by using commercially available sample size calculation software nQuery as well as the Cleveland Clinic Department of Quantitative Health Sciences Sample Size Calculator.24 With both methods of power calculation, power met or exceeded 0.95 (both for section and patient classification), utilizing a null hypothesis of AUC equal to 0.5, analogous to random guessing. Additionally, 95% CIs were calculated for the ViT patient-level AUC of 0.92, yielding 0.80–1.00.
DISCUSSION
In our study, we presented a ViT model to classify MR imaging images of the cervical spine as normal/mild stenosis, moderate stenosis, or cord compression by using a diverse clinical cohort taken from emergency, inpatient, and routine outpatient settings. Based on the predictions of this model, we utilized a simple rules-based approach to label entire examinations as positive for cord compression or negative for cord compression. Based on this methodology, we achieved a high accuracy, sensitivity, specificity, PPV, and NPV. In our study, ViT outperformed 2 popular CNN architectures. To our knowledge, our work presented the first attempt at approximating the pattern of human interpretation of MR imaging cervical spine examinations by utilizing section-level predictions to generate an overall patient-level severity classification for cervical spinal pathology. Additionally, no other study has utilized ViT models for such a task within the cervical spine. We believe the results of our experiments are meaningful for several reasons.
First, while there is tremendous interest in utilizing AI-based classification tools in neuroimaging, applications in cervical spine pathology as depicted by MR imaging are relatively limited. Most AI-based research in spinal neuroimaging and pathology relates to lumbar spinal disease.11,13 There are also several published studies demonstrating the ability of deep learning algorithms to detect cervical spinal fractures via CT.25,26
The few studies that exist relating to cervical spinal cord pathology differ from our study in meaningful ways. For example, Merali et al8 demonstrate impressive performance of a deep learning model at section-level prediction within a cohort of patients with known cervical myelopathy. While such approaches have yielded excellent performance, they may not retain their accuracy when applied to our cohort, which represents a broader array of etiologies for spinal stenosis and cord compression. Tamai et al,9 Hopkins et al,10 and Ma et al12 also differ from our methodology substantially by focusing solely on degenerative disc disease, section-level prediction, classifying images/patients into categories different from our study, utilizing a different deep learning methodology, and/or utilizing a cohort of patients with known cervical myelopathy.
By contrast, our study leverages a vision transformer model combined with simple rules-based logic dictating that an examination with predicted cord compression at any level equals an examination positive for suspected cord compression. This methodology is inspired by working clinically with commercially available intracranial hemorrhage detection software that labels an examination with “suspected hemorrhage” if a section on a given CT demonstrates evidence of hemorrhage.
This methodology holds a distinct advantage given the clinical significance of the finding of cervical cord compression, as a false-positive is far less likely to cause patient harm than a false-negative. Therefore, any images flagged for possible compression should trigger immediate review by the radiology physician and/or the clinician who ordered the examination. Critically, however, the ViT model was also highly specific with a high PPV. Although the ResNet50 model achieved a sensitivity of 100% (ViT achieved 90%), given its poor performance in regard to specificity, PPV, and lower AUC compared with ViT, its clinical usefulness would likely be limited, given that greater than one-half of the examinations it predicted as positive for cord compression were false-positives.
Given the ever-increasing workload of radiology physicians, augmentation via AI is needed more than ever to improve workflow and speed, decrease cognitive load, and reduce misdiagnosis. If implemented in a clinical setting, a triaging tool for detecting cervical cord compression could be a meaningful aid to the practicing radiologist.
Limitations of our study include a relatively small sample size, single-center data set, and categoric/nonquantitative classification of disease. Given that our study has a relatively low n and is sourced from a single tertiary care academic medical center, our results should be considered preliminary until replicated across multiple additional sites. Additionally, there is increasing recognition of a significant proportion among healthy populations, particularly the elderly, of asymptomatic cervical cord compression.27 Therefore, a tool similar to the one described in this manuscript, which flags examinations with potential cord compression, would likely be more useful in the setting of concern for acute pathology, such as trauma; less likely for outpatient examinations evaluating for chronic processes, such as degenerative disc disease. Notably, however, 58.2% of patients with severe spinal stenosis in our cohort had clinical signs and symptoms retrospectively referable to myelopathy.
Future directions will include expanding our data set to include a larger multi-institutional cohort, quantitative analysis (eg, spinal canal measurements), auto-segmentation, and possibly an evaluation of clinical implementation.
CONCLUSIONS
This study demonstrates accurate detection of cervical spinal cord compression at the patient level by combining vision transformer section-level predictions with rules-based classification. If implemented into the clinical setting, this tool could serve as a meaningful aide to radiologists by flagging potentially abnormal examinations for expedited review.
Footnotes
This work was partially supported by NIH 1R21CA258493-01A. The content is solely the responsibility of the authors and does not necessarily represent the official views of the National Institutes of Health.
Disclosure forms provided by the authors are available with the full text and PDF of this article at www.ajnr.org.
REFERENCES
- Received October 3, 2023.
- Accepted after revision December 15, 2023.
- © 2024 by American Journal of Neuroradiology


