
Article Figures & Data
Figures
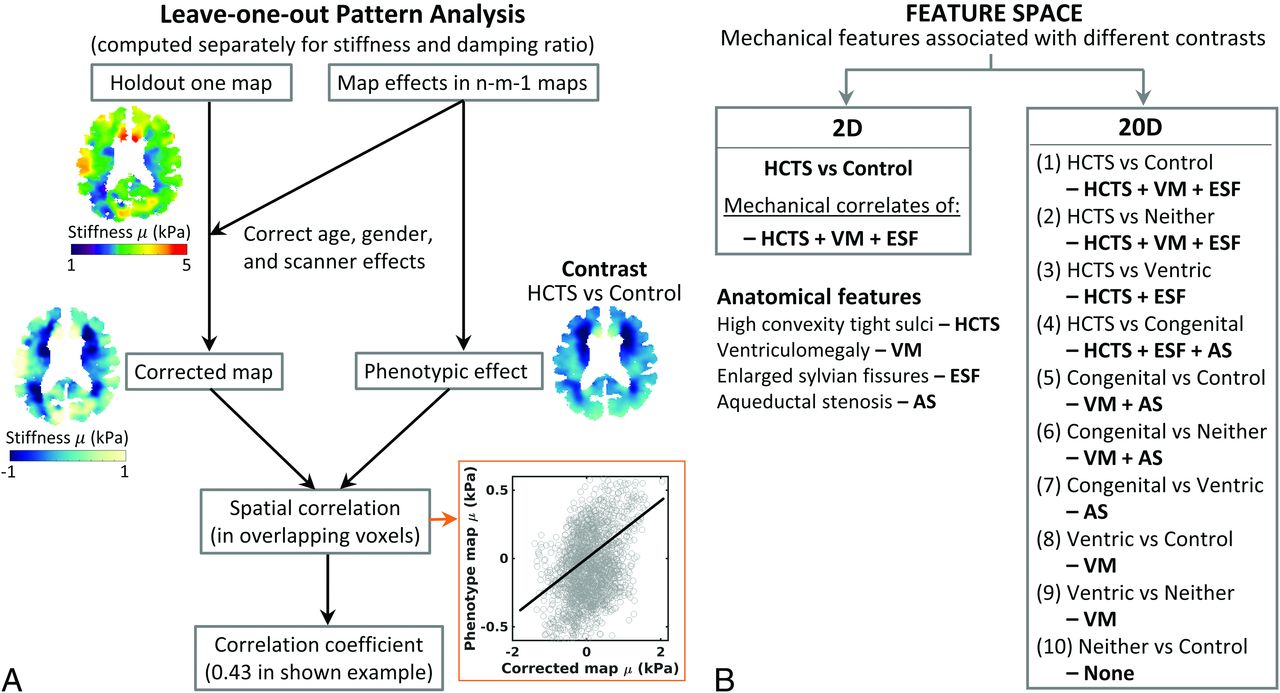
- FIG 1.
Pattern analysis. The pattern analysis procedure is depicted in a flow chart (A) with an example of one of the axial slices of a Ventric case. The procedure is performed for the whole 3D map of an individual. In n-m-1 maps, n represents the total number of cases, and m represents the number of cases from a group that is not included in the correction of the heldout individual map to create the required contrast. For example, in the HCTS-versus-control contrast, m is the number of cases in the control group. In the example shown, a voxelwise spatial correlation of the age, sex, scanner, and the mean corrected heldout individual map was computed in reference to the phenotypic map (HCTS + VM + ESF) of the HCTS versus control contrast. Feature spaces. The flow chart (B) displays the 2 feature spaces with their corresponding mechanical correlates of the anatomic features that would comprise the phenotypic map. In the HCTS-versus-Ventric contrast, mechanical correlates of the HCTS group excluding those common with the Ventric group comprise the phenotypic reference map (HCTS + ESF) for calculating the correlation scores, allowing more distinction in the scores between the HCTS and Ventric cases compared with the scores from the HCTS-versus-control contrast. The expanded feature space of 20D includes all the possible contrasts among the 5 groups, allowing systematic extraction of all possible combinations of the mechanical features that correlate to different anatomic features. ESF indicates enlarged Sylvian fissures; VM, ventriculomegaly.
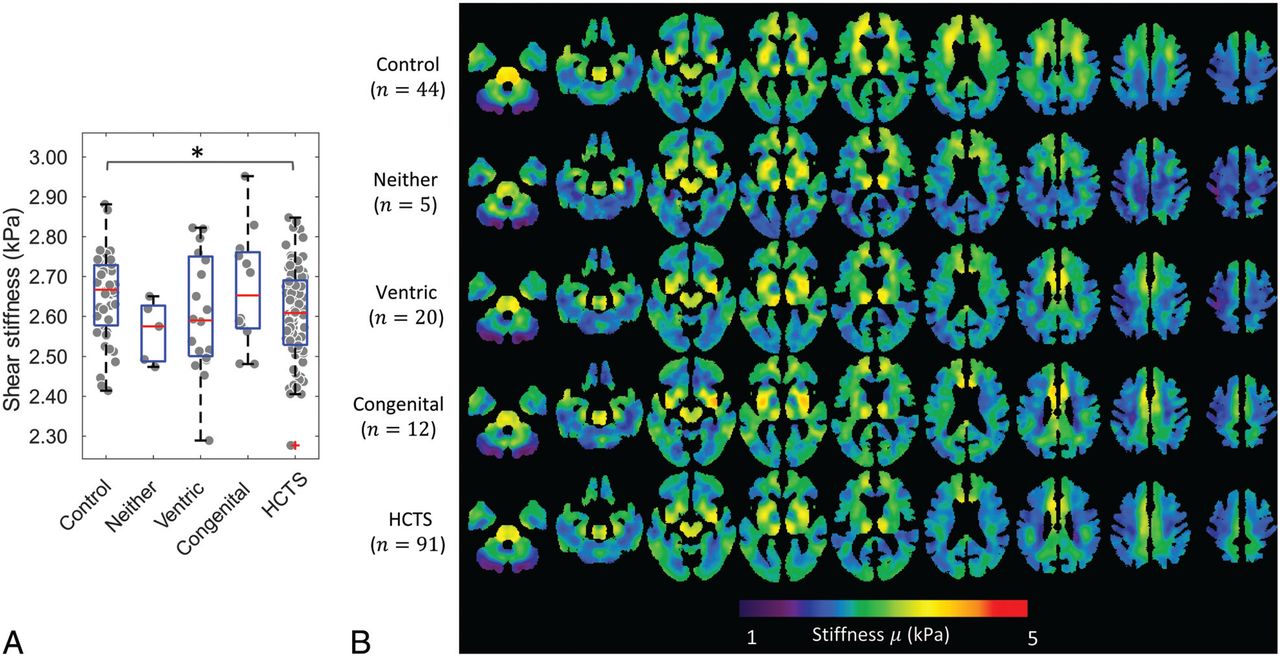
- FIG 2.
Group-wise boxplot overlayed on a jitter plot of mean shear stiffness of the whole brain of each participant (A) and averaged shear stiffness maps (B) of each group. The pair-wise Wilcoxon rank sum test and Welch t test results between the groups with P < .05 are indicated with an asterisk in the boxplot.
- FIG 3.
Group-wise boxplot overlayed on a jitter plot of the mean damping ratio of the whole brain of each participant (A) and averaged damping ratio maps (B) of each group. The pair-wise Wilcoxon rank sum and Welch t test results with P < .05 (asterisk) and P < .005 (double asterisk) are displayed in the boxplot.
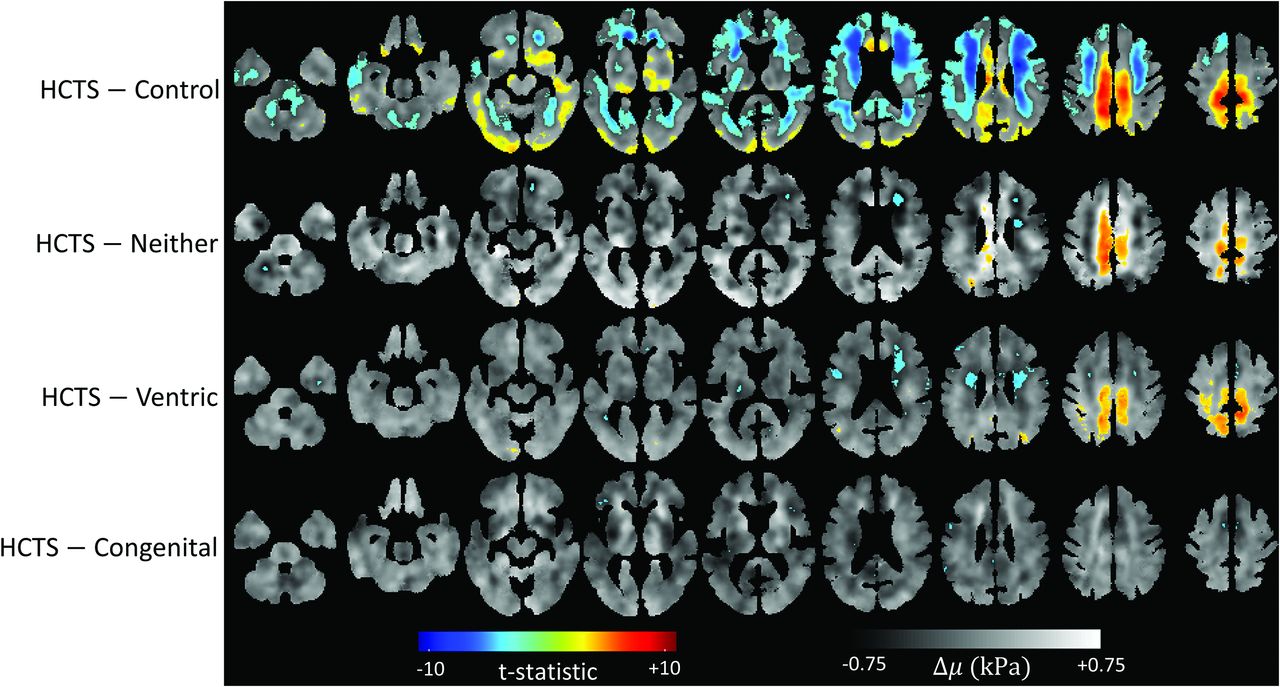
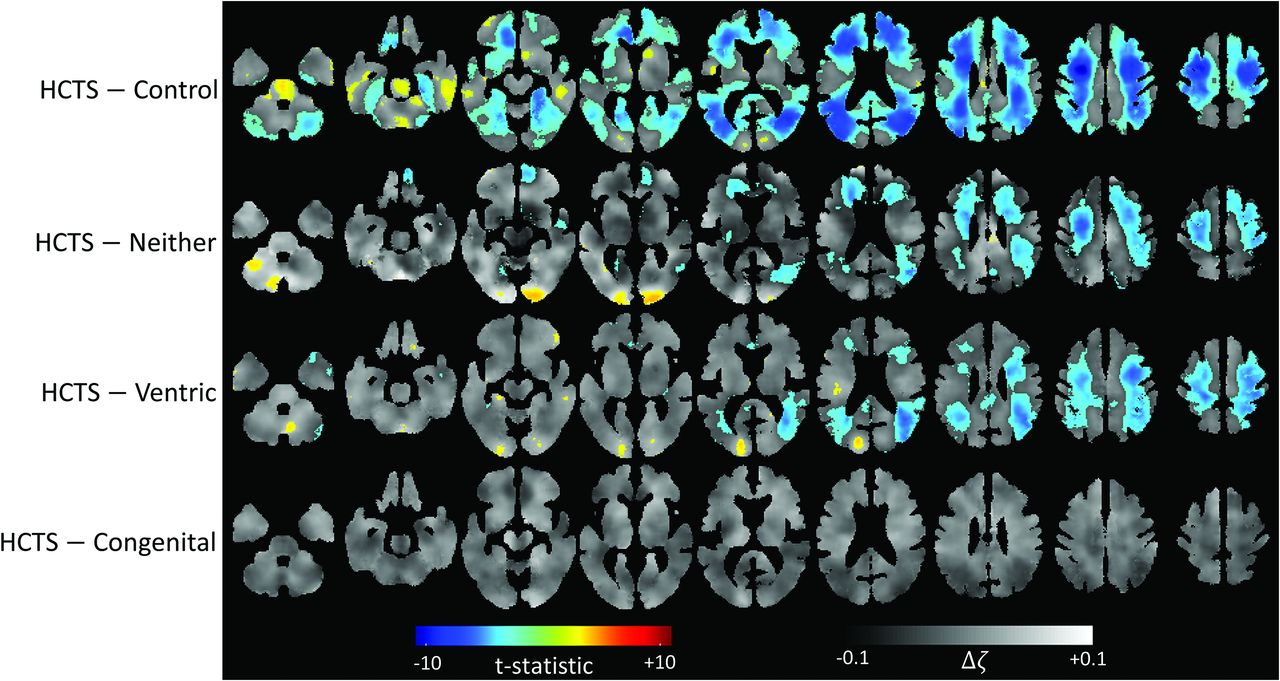
- FIG 4.
Stiffness difference maps. FDR thresholded (Q < 0.05) t-statistic maps overlayed on voxelwise calculated stiffness difference maps between each group and the HCTS group. The number of voxels crossing the FDR threshold was 735 in Congenital, 11,364 in Ventric, 6931 in Neither, and 93,254 in control.
- FIG 5.
Damping ratio difference maps. FDR thresholded (Q < 0.05) t-statistic maps overlayed on voxelwise calculated damping ratio difference maps between each group and the HCTS group. Congenital had no voxels crossing the FDR threshold, whereas Ventric had 43,984, Neither had 40,019, and control had 144,233.
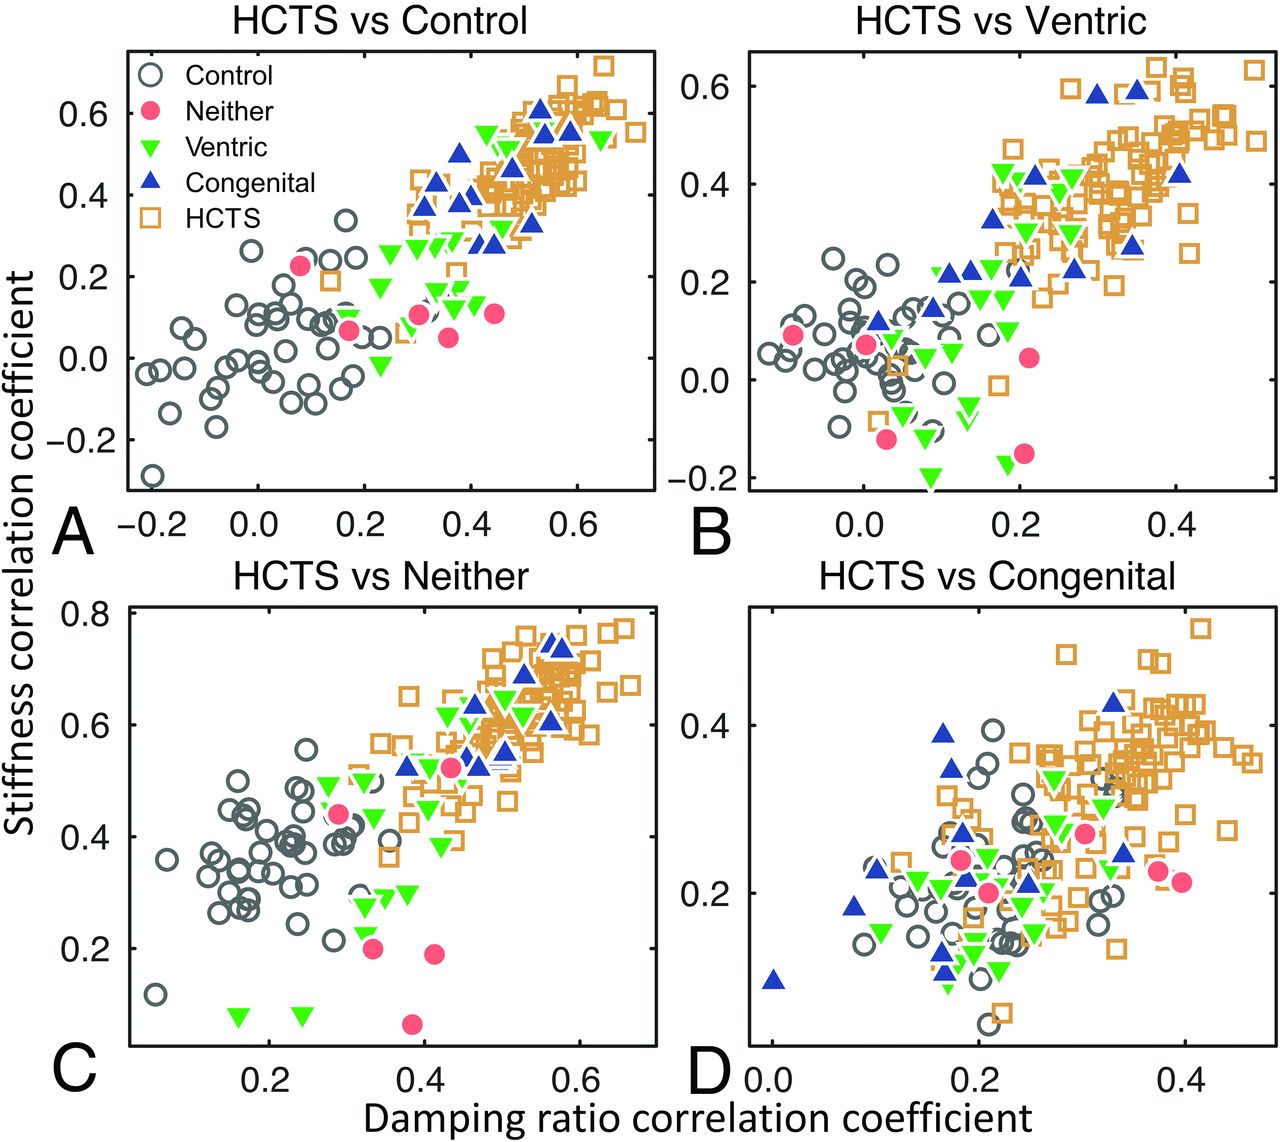
- FIG 6.
Scatterplots of the age, sex, and scanner effect corrected pattern scores of each case for the 4 contrasts of HCTS versus control (A), Ventric (B), Neither (C), and Congenital (D) groups. A, HCTS and control cases are separated into 2 distinct clusters corresponding to the extraction features associated with ventriculomegaly, enlarged ventricles, and tightening of sulci at the vertex of the brain. B, HCTS-versus-Ventric contrast extracted the features associated with the tightening of sulci at the vertex and enlarged Sylvian fissures, excluding the common feature of ventriculomegaly. C, HCTS-versus-Neither contrast further separated cases from the 2 groups. D, Pattern analysis could not distinguish between HCTS and Congenital cases due to similar mechanical patterns demonstrated in Figs 2–5.
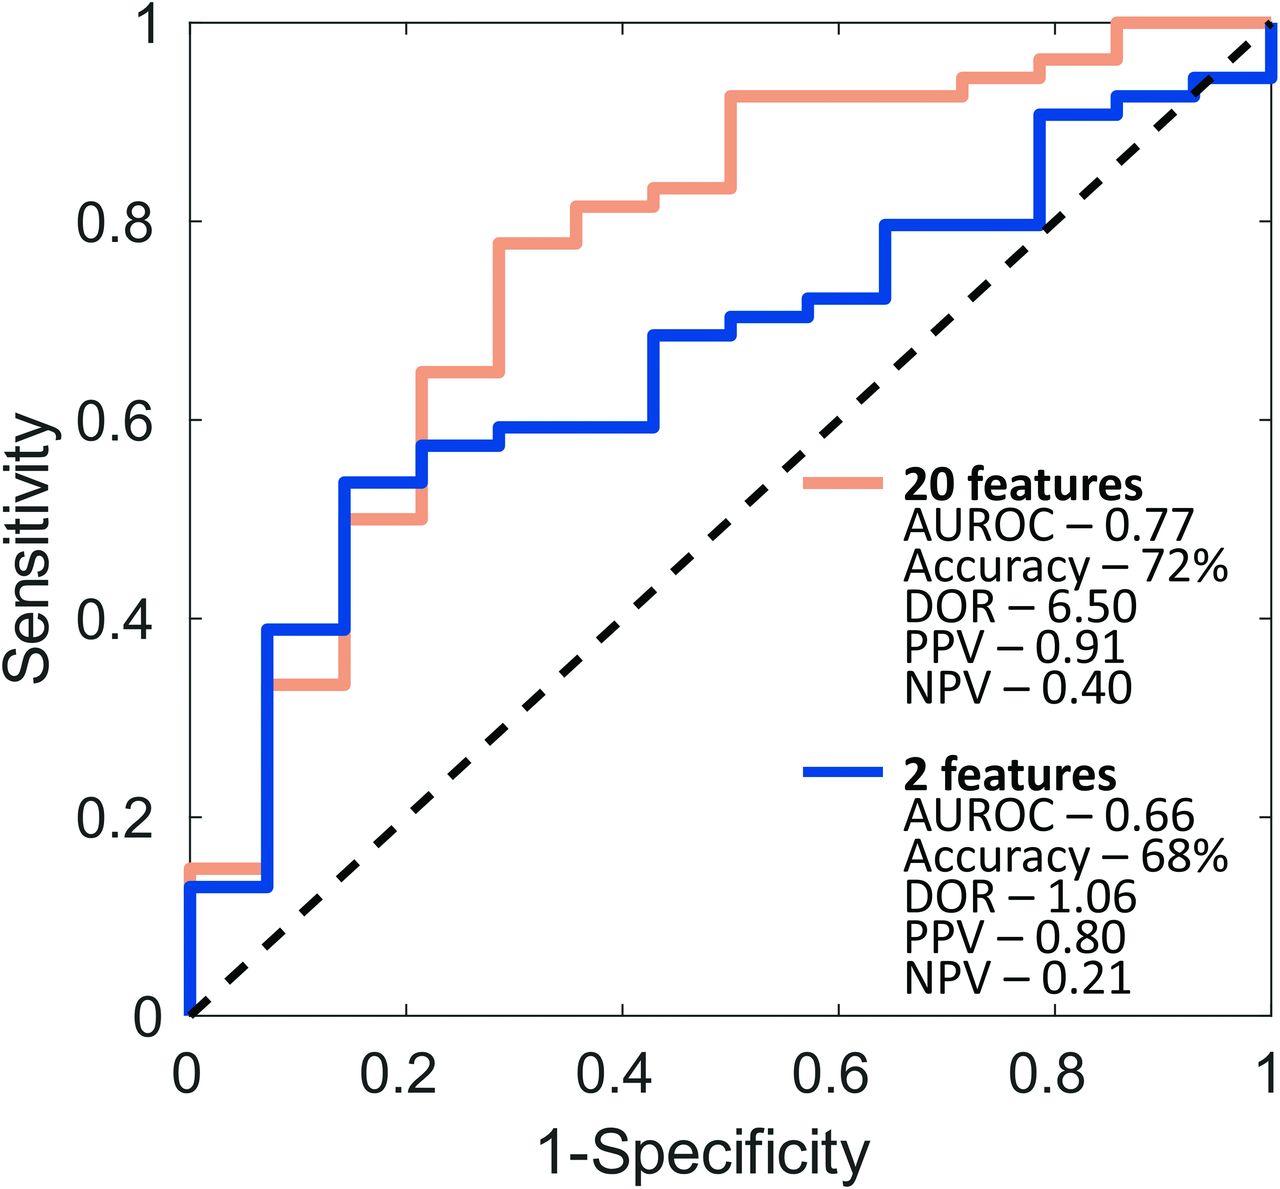
- FIG 7.
SVM receiver operating characteristic curves for the 20D and the 2D feature spaces using a leave-one-out cross-validation procedure. The inset shows the results of 5 performance metrics: AUROC, accuracy, DOR, PPV, and NPV. Random classifier is indicated by the black dashed line.


Jump to section
Related Articles
Cited By...
- No citing articles found.