
Abstract
BACKGROUND AND PURPOSE: Current imaging techniques have difficulty differentiating treatment success and failure in spinal metastases undergoing radiation therapy. This study investigated the correlation between changes in dynamic contrast-enhanced MR imaging perfusion parameters and clinical outcomes following radiation therapy for spinal metastases. We hypothesized that perfusion parameters will outperform traditional size measurements in discriminating treatment success and failure.
MATERIALS AND METHODS: This retrospective study included 49 patients (mean age, 63 [SD, 13] years; 29 men) with metastatic lesions treated with radiation therapy who underwent dynamic contrast-enhanced MR imaging. The median time between radiation therapy and follow-up dynamic contrast-enhanced MR imaging was 62 days. We divided patients into 2 groups: clinical success (n = 38) and failure (n = 11). Failure was defined as PET recurrence (n = 5), biopsy-proved (n = 1) recurrence, or an increase in tumor size (n = 7), while their absence defined clinical success. A Mann-Whitney U test was performed to assess differences between groups.
RESULTS: The reduction in plasma volume was greater in the success group than in the failure group (−57.3% versus +88.2%, respectively; P < .001). When we assessed the success of treatment, the sensitivity of plasma volume was 91% (10 of 11; 95% CI, 82%–97%) and the specificity was 87% (33 of 38; 95% CI, 73%–94%). The sensitivity of size measurements was 82% (9 of 11; 95% CI, 67%–90%) and the specificity was 47% (18 of 38; 95% CI, 37%–67%).
CONCLUSIONS: The specificity of plasma volume was higher than that of conventional size measurements, suggesting that dynamic contrast-enhanced MR imaging is a powerful tool to discriminate between treatment success and failure.
ABBREVIATIONS:
- DCE
- dynamic contrast-enhanced
- ΔVp
- change in plasma volume
- Ktrans
- vessel permeability
- ROC
- receiver operating characteristic
- RT
- radiation therapy
- Vp
- plasma volume
The skeletal system is the third most common location for metastatic lesions, following the lungs and liver. Within the skeleton, the spine is the most prevalent site of metastasis. Up to 10% of all patients with cancer will develop spinal osseous metastases, leading to increased morbidity and mortality.1 Vertebral body metastases can effectively be detected using conventional MR imaging, including T1-weighted and STIR sequences. However, routine MR imaging techniques are rather limited in assessing treatment response versus disease progression following radiation therapy (RT).2,3 Currently, progression is suggested by an increase in lesion size on conventional MR imaging, while lesion stability suggests treatment success.4 However, lesion size often fluctuates after both successful and unsuccessful treatment, limiting the utility of conventional MR imaging in evaluating the response to therapy. This limitation can lead to delayed detection of tumor recurrence, which, in turn, may adversely impact patient outcomes.
Dynamic contrast-enhanced (DCE) MR imaging is an advanced imaging technique that can noninvasively analyze vascular microenvironment and hemodynamics, which is not possible with conventional MR imaging.5 DCE-MR imaging involves rapid IV injection of a contrast agent, which is subsequently measured by a dynamic T1-weighted imaging sequence. The extended Tofts dual-compartment pharmacokinetic model is then applied to calculate the reduction of intravascular volume, reduction in plasma volume (Vp), and the rate of contrast leakage from the intravascular to interstitial space (Ktrans).6 Vp is an indicator of tumor vascularity, while Ktrans reflects vessel permeability. In essence, a voxelwise tracer kinetic analysis of the ROI offers insight into the pathophysiologic status of the tumor microenvironment.7
Previous work has demonstrated the superiority of DCE-MR imaging in assessing tumor vascularity compared with conventional techniques.8 The results of DCE-MR imaging can then be applied to evaluate treatment response in patients with spinal metastases treated with high-dose RT.9 Other work has shown that changes in perfusion parameters, most notably Vp, reflect tumor response to RT in spinal osseous metastases and serve as a predictor of tumor recurrence in lumbar metastases.2,10 DCE-MR imaging parameters additionally have been demonstrated to change quickly after other treatment modalities, including stereotactic radiosurgery.11 DCE-MR imaging is emerging as a powerful tool for estimating tissue permeability and enables the assessment of tumor angiogenesis, which is not possible with conventional MR imaging and traditional dynamic susceptibility contrast perfusion methods. However, DCE-MR imaging output parameters can be influenced by numerous factors including age, sex, and lesion location.12 Relative CBV measured by traditional dynamic susceptibility contrast can be influenced by the presence of susceptibility artifacts and contrast leakage from tumor vessels.
We hypothesized that a reduction in Vp would correlate with treatment success and, therefore, improve clinical outcomes and that DCE-MR imaging could predict tumor recurrence more successfully than traditional size measurements on conventional MR imaging. Therefore, the objective of this retrospective study was to evaluate the validity of using perfusion parameters to predict treatment success or failure regarding spinal osseous metastases. Additionally, the study aimed to show that analysis using perfusion parameters was concordant and, in some cases, surpassed lesion-size measurements in the determination of treatment success or failure.
MATERIALS AND METHODS
This retrospective study was conducted under a waiver of authorization from the Insitutional Review Board at Memorial Sloan Kettering Cancer Center.
Study Patients
We collected patients who underwent DCE-MR imaging before and after receiving RT between March of 2013 and December of 2020. Exclusion criteria included technically limited and therefore nondiagnostic DCE perfusion studies and DCE perfusion MR imaging obtained >1 year post-RT, resulting in the inclusion of 49 patients. Of the remaining patients, the median time between RT and the first available DCE-MR imaging was 62 days (Online Supplemental Data). We then separated the patients into 2 distinct groups reflecting their clinical outcomes: clinical response (n = 38) and persistent disease (n = 11). Patients were assessed within 18 months after the second DCE-MR imaging, with persistent disease defined as PET recurrence at the same spine level (n = 5), size increase recorded by a radiologist (n = 7), or biopsy-proved recurrence (n = 1). Some patients met multiple conditions. The patients in this study had limited spinal disease, and some had oligometastases to the spine with well-controlled primaries or without evidence of local disease at the primary site. The goal of radiation therapy in this patient population was a cessation of disease progression. The patients were treated with a single dose or a hypofractionated regimen as follows: 24 Gy in 1 fraction, 27 Gy in 3 fractions, or 30 Gy in 3 fractions, depending on location, histology, age, and the patient's ability and availability to return and complete his or her treatment.
MR Imaging Acquisition
We performed MR imaging of the spine with a 1.5T scanner (Discovery 450W; GE Healthcare), using an 8-channel cervical-thoracic-lumbar surface coil. All patients underwent routine MR imaging sequences, including sagittal T1 (FOV, 32–36 cm; section thickness, 3 mm; TR, 400–650 ms; and flip angle, 90°), sagittal T2 (FOV, 32–36 cm; section thickness, 3 mm; TR, 3500–4000 ms; and flip angle, 90°), and sagittal STIR images (FOV, 32–36 cm; section thickness, 3 mm; TR, 3500–6000 ms; and flip angle, 90°).
DCE-MR imaging of the spine was then performed. Gadobutrol (Gadavist; Bayer) was administered at 0.1 mmol/kg of body weight and a rate of 2–3 mL/s. Kinetic enhancement of the tissue during and after injection of gadopentetate dimeglumine was obtained via a 3D T1-weighted fast spoiled gradient-echo sequence (TR, 4–5 ms; TE, 1–2 ms; section thickness, 5 mm; flip angle, 25°; FOV, 32 cm; and temporal resolution, 5−6 seconds) and consisted of 10–12 images in the sagittal plane. The 3D fast-spoiled gradient echo sequences generated phase images in addition to standard magnitude images. The duration of the DCE sequence was 300 seconds. Sagittal and axial T1-weighted MR images with gadopentetate dimeglumine were acquired after DCE perfusion.
Data Analysis
Data were processed and analyzed by a single trained researcher (M.B.) using US FDA-approved commercial software (NordicICE, Version 2.3; NordicNeuroLab). Preprocessing steps included background noise removal, spatial and temporal smoothing, and automatic detection of the arterial input function from the aorta. The aorta was selected on the basis of prior literature. The arterial input function was individually computed and visually verified in every section, and arterial input function curves with a rapid increase in signal enhancement and a sharp peak followed by minimal temporal noise were selected for further DCE analysis. Arterial input function curves were shifted manually to account for delayed blood flow to the spine.
We applied the extended Tofts dual-compartment pharmacokinetic model, which assumes that the contrast agent is either in the interstitial space or in the intravascular compartment, to calculate the DCE perfusion MR imaging parameter, Vp.6 ROIs were manually defined around the spinal lesions with careful consideration, to exclude venous structures, hemangiomas, disk spaces, cortical bone, and spondylotic changes on each T1-weighted DCE perfusion MR imaging section. Structures of interest included vertebral bodies, lamina, spinous processes, and paraspinal soft tissues. ROIs were then superimposed onto corresponding perfusion maps to guide calculations. When the lesions appeared to extend beyond the osseous structure into paraspinal soft tissues, we included both the bony and soft structures in our ROI analysis. A fellowship-trained neuroradiologist (O.Y.) used conventional MR imaging, including T1- and T2-weighted images, to measure the size of the lesion. Correlation was determined between these sequences to ensure the accuracy of the lesion margin. The largest bidimensional size of the lesions was measured on the axial plane. The measurement was performed in the pre- and posttreatment scans closest to the time of RT, with careful consideration to avoid adjacent treatment-related changes and normal bone marrow. The axial and sagittal images were chosen for the assessment and measurement of the extraosseous tumor extension. The tridimensional measurement of the extraosseous component of the tumor is calculated by measuring the extraosseous spread from the adjacent normal bony cortex, which is defined as the line connecting the tumor and normal bony cortex at the unilateral margins. Measurement from an estimated normal bony cortex surface line may also be useful in high-volume tumoral lesions. The contralateral margins of the bony cortex are used to draw this line.
Measurements of all lesions were performed by a neuroradiologist (O.Y.). Two senior neuroradiologists (A.I.H., with 25 years of experience, and S.K., with 20 years of experience) were consulted for size measurements in specific cases. To account for background variations among different DCE perfusion MR imaging studies, we normalized fractional plasma volume by obtaining the ratio between the lesion ROI and an adjacent healthy vertebra (ie, Vp normalization). The normalized Vp values were then used for statistical analyses.
Statistical Analysis
We performed Mann-Whitney U tests, in which P values ≤ .05 indicated statistical significance, on Vp, Ktrans, and signal intensity to evaluate differences between clinical response and clinical failure. We performed receiver operating characteristic (ROC) analysis using software (Johns Hopkins online ROC curve calculator; http://www.rad.jhmi.edu/jeng/javarad/roc/JROCFITi.html) to determine the optimal cutoff with the highest Youden index.
RESULTS
Study Patients
After exclusion criteria were applied, 49 patients remained, 29 men and 20 women with similar age distributions (Table). The mean age for all patients was 63 (SD, 13) years. All patients had metastatic disease, with the most prevalent primary cancers being lung, kidney, breast, prostate, and thyroid. Metastatic lesions were present at all spinal levels, with thoracic (32.7%; 27 of 49) and lumbar (55.1%; 16 of 49) lesions comprising most. Of all included patients, 11 demonstrated persistent disease, while the remaining 38 demonstrated clinical response.
Patient demographics and cancer type
Tumor Perfusion Analysis
Qualitatively, metastatic spinal lesions appeared hypointense on T1-weighted images. Perfusion maps of malignant spinal lesions demonstrate marked signal intensity changes that are easily distinguishable from healthy spinal tissue. This signal intensity change is most pronounced in lesions with increased vasculature and metabolic activity. Overlaying Vp maps on T1-weighted images reveals active lesion locations (Fig 1).

Example of a 64-year-old male patient with metastatic pancreatic neuroendocrine cancer demonstrating a successful treatment response at L3. The left column shows sagittal T1-weighted MR imaging of the lower spine. The hypointense area corresponds to vertebral lesions. The middle column shows plasma volume (Vp) maps of the lesions. The normalized Vp of the lesion was 9.26 before RT, and 1.13 after RT, a reduction of 87.8%. The right column is a T1-weighted MR imaging merged with the perfusion Vp map. The arrows indicate the lesions of interest.
As seen in Fig 1, normalized Vp was 9.26 before RT and 1.13 after RT. This 87.8% reduction represents a decrease in tumor vascularity. Overwhelmingly, this decrease in Vp correlated with treatment success and clinical response. However, not all patients demonstrated this extent of reduction in Vp following RT (Fig 2).

Example of a 63-year-old female patient with metastatic thymoma demonstrating an unsuccessful treatment response at T9 and the associated epidural area. The left column shows sagittal T1-weighted MR imaging of the cervical and thoracic spine. The hypointense area corresponds to vertebral lesions. The middle column shows plasma volume (Vp) maps of the lesions. Although tumor size decreased 19.4%, the normalized Vp of the lesion was 5.48 before RT and 9.03 after RT, an increase of 64.8%. The patient experienced progression of disease, particularly in the epidural-associated portion of the tumor. Additional RT therapy was required from T8–T10 14 months after the secondary imaging study. The right column is a T1-weighted MR imaging merged with the perfusion Vp map. The arrows indicate the lesions of interest.
As seen in Fig 2, the normalized Vp was 5.48 before RT and 9.03 after RT, an increase of 64.8%. This increase in Vp correlated with disease progression, particularly in the epidural component of the tumor. The patient in Fig 2 required additional radiation at the same spinal levels 14 months after the secondary imaging study. Additional observation shows a decrease in lesion size of −19.4%. Despite this decrease in size, disease progression occurred. Figure 2 exemplifies the ways in which DCE perfusion MR imaging can detect progression, while conventional MR imaging cannot.
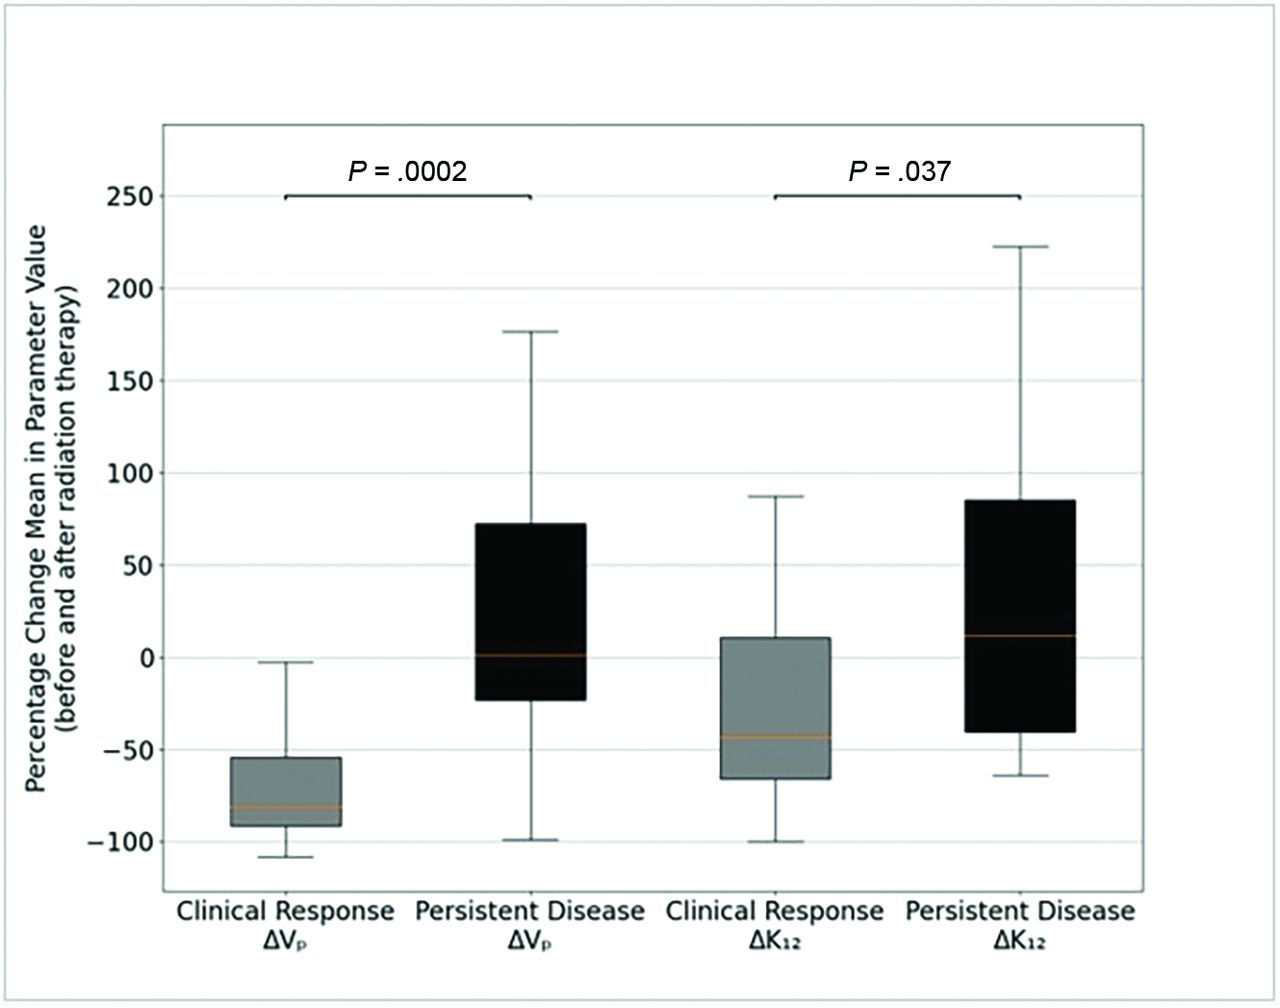
Overall, there was a statistically significant difference in the change of Vp (ΔVp) before and after RT (Fig 3) between the clinical response and persistent disease groups (P = .0002). The median percentage ΔVp following RT for clinical response was −81.1%. Correspondingly, the median ΔVp was +1.43% for the persistent disease group. A statistically significant difference existed for the change in Ktrans (P = .037), as well.

Box-and-whisker plot of the ΔVp and the change in mean vessel permeability (ΔKtrans) by group. The mean ΔVp is −57.3% in the clinical response group and +88.2% in the persistent disease group. The mean ΔKtrans is −11.7% in the clinical response group and +51.4% in the persistent disease group. There is a statistically significant difference in ΔVp between the persistent disease and clinical response groups as evidenced by a Mann-Whitney U test (P < .001). ΔK12 indicates ΔKtrans.
Lesion contrast uptake curves also revealed a difference between clinical groups (Fig 4). Within the clinical response group, there was a reduction in signal intensity following RT (P = .0021). In contrast, there was an increase in signal intensity following RT in the persistent disease group (P = .0317).

Graphs of the averaged MR signal intensity separated by the clinical outcome group. There is a reduction in averaged signal intensity following RT within the clinical response group. However, averaged signal intensity remains elevated within the persistent disease group.
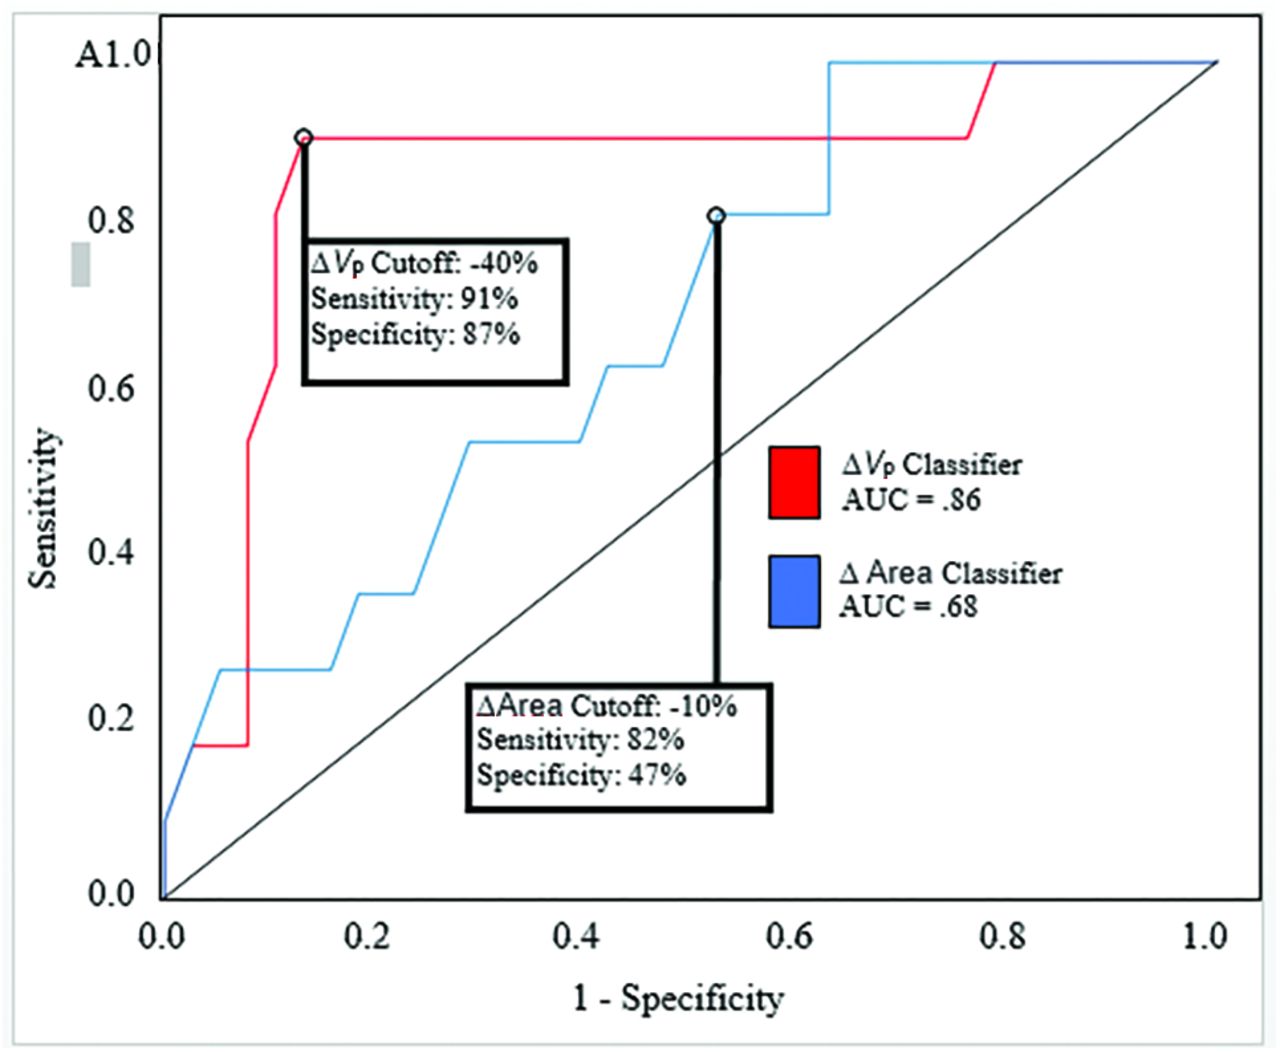
Finally, we conducted an ROC analysis to determine the validity of using perfusion parameters to predict clinical outcomes (Fig 5) and compared predictions with traditional size measurements obtained by a neuroradiologist. The optimal ΔVp cutoff was −40%, which yielded a sensitivity of 91% (10 of 11; 95% CI, 82%–97%) and a specificity of 87% (33 of 38; 95% CI, 73%–94%) (ΔVp; area under the ROC curve, 0.86; 95% CI, 0.717–1). The optimal Δarea cutoff was −10%, which yielded a sensitivity of 82% (9 of 11; 95% CI, 67%–90%) and a specificity of 47% (18 of 38; 95% CI, 37%–67%) (Δarea; area under the ROC curve, 0.68; 95% CI, 0.505–0.846). By means of the cutoff values above, 20 false-positives of persistent disease were identified in the 49 patients in this study via conventional size measurements. Conversely, only 5 false-positives were identified via perfusion.

ROC curve of the ΔVp (area under the ROC curve, 0.86; 95% CI, 0.717–1) and change in lesion area (Δarea; area under the ROC curve, 0.68; 95% CI, 0.505–0.846). The optimal ΔVp cutoff is −40%, which yields a sensitivity of 91% and a specificity of 87%. The optimal Δarea cutoff is −10%, which yields a sensitivity of 82% and a specificity of 47%. AUC indicates area under the curve.
DISCUSSION
Prior studies in the literature have characterized the use of DCE perfusion MR imaging in metastatic spinal disease. However, much of this work had limitations, such as small sample sizes and niche patient populations, therefore limiting the utility of results and their application across broad patient populations. Despite these limitations, it has been demonstrated that DCE perfusion MR imaging parameters; namely, plasma volume (Vp), can aid in the detection of viable spinal neoplasms. The earliest work applying DCE-MR imaging to the spine demonstrated the ability to assess metastatic bone marrow from prostate and hematologic malignancies.13,14 Recent work by Guan et al15 demonstrated that DCE-MR imaging perfusion can differentiate benign and malignant spinal lesions, specifically using the Vp parameter. Other groups showed that infectious etiologies of spinal disease can also be distinguished from malignancy using perfusion parameters.16,17 Lang et al18 provided further insight into malignant disease. Their work demonstrated that DCE-MR imaging could potentially distinguish metastatic disease and local malignancy, including myelomas. Additionally, Kumar et al9 determined that perfusion parameters following radiosurgery could predict tumor recurrence for metastatic lesions in the lower spine.9 The goals of this study were to expand on the work of Kumar et al, to demonstrate that perfusion parameters can indeed detect viable tumor throughout all spinal levels, and to show that perfusion data are a better predictor of clinical outcomes than traditional radiologist-conducted anatomic size measurements performed on conventional MR imaging.
Our results showed significant differences in ΔVp following RT between the clinical response and persistent disease groups, with medians of −81% and +1.43%, respectively. With an optimal ΔVp of −40%, perfusion parameters can predict persistent disease with a sensitivity of 91% and a specificity of 87% (area under the curve = 0.86).
This study expands on previous works that have established the ability of DCE perfusion MR imaging to characterize spinal lesions accurately. For example, Chu et al2 and Lis et al10 demonstrated that Vp could be used to determine a successful response of spinal lesions to RT., Other groups demonstrated the ability to accurately assess the treatment of native spinal tumors, improve surveillance of metastatic spinal lesions,19 as well as to differentiate benign and malignant spinal fractures, hypovascular and hypervascular metastases, and hemangiomas and metastases.20⇓-22 Our study is rooted in the idea that malignant lesions lead to new vasculature formation.23,24 New vessel networks allow the contrast agent to accumulate, leading to a measurable increase in Vp. As a corollary, this vasculature will regress if RT is successful, leading to a decrease in Vp. Conversely, if RT is unsuccessful, Vp would remain elevated.
Despite these promising data, our study had several limitations. One such limitation is the potential existence of methodologic circularity. We used size measurements to assign patients to clinical groups, which were then compared using the results of DCE-MR imaging. Subsequently, we compared DCE-MR imaging with conventional radiologist-completed size measurements in assessing clinical failure. This approach is not ideal. However, the size assessments were conducted differently. Radiologists' impressions were assessed in the 18-month interval following the post-RT DCE-MR imaging to assign groups, while quantitative measurements before and after RT were used for the comparison with traditional radiologist-completed size measurements. As discussed in the materials and methods, these measurements were taken using the closest imaging to the date of RT. Although we foresaw this limitation, the decision to use the conventional size measurement as a criterion was based on its established relevance and widespread use in similar studies within our field. We believe future studies that explore alternative criteria or methodologies would complement our findings.
Additional limitations exist. First, perfusion parameters can be influenced by factors other than malignancy. Local injuries and benign fractures can lead to angiogenesis and corresponding increases in Vp.25 Additionally, defining clinical response and persistent disease is somewhat problematic. Our categoric assignment would ideally be replaced with solely biopsy-proved recurrence, though even biopsies can be falsely negative. Currently, an increase in standardized uptake values in FDG-PET is part of persistent disease criteria. Increased FDG uptake on PET can be suggestive of tumor recurrence, but false-positives are also seen using this technique.26 Nevertheless, DCE perfusion may be more sensitive and specific than the imperfect criteria of the present study. Further studies are therefore needed to elucidate this point. Finally, our study included some technical limitations. The DCE processing and arterial input function selection and shift were performed manually. Although this process was standardized, automation would be ideal for consistency.
Significant work remains in the field of spine imaging, and this study should be further expanded to validate the dynamic contrast-enhanced perfusion MR imaging model of assessing the response of metastatic spinal lesions to RT.
CONCLUSIONS
Our study results provide strong evidence in favor of incorporating DCE-MR perfusion imaging into routine clinical practice when assessing metastatic spinal lesions. Perfusion imaging allows more accurate differentiation between treatment success and persistent disease. Conventional imaging techniques rely on lesion size and signal characteristics, which can commonly be indeterminate or inaccurate in evaluating tumor recurrence. The use of perfusion parameters offers greater specificity and should be considered when determining whether to pursue a new course of treatment. Further studies applying DCE-MR imaging to spinal metastases are warranted to validate and explore this line of reasoning.
ACKNOWLEDGMENTS
We would like to thank Cecile Berberat (Department of Radiology) for the editing assistance.
Footnotes
This study was funded, in part, through an industrial grant (Bayer HealthCare: study No: DI-2013-003) and the National Institutes of Health/National Cancer Institute Cancer Center Support Grant P30 CA008748.
Disclosure forms provided by the authors are available with the full text and PDF of this article at www.ajnr.org.
References
- Received March 11, 2023.
- Accepted after revision October 5, 2023.
- © 2023 by American Journal of Neuroradiology


Jump to section
Related Articles
Cited By...
- No citing articles found.