
Abstract
BACKGROUND AND PURPOSE: Brain iron dyshomeostasis is increasingly recognized as an important contributor to neurodegeneration. Hereditary hemochromatosis is the most commonly inherited disorder of systemic iron overload. Although there is an increasing interest in excessive brain iron deposition, there is a paucity of evidence showing changes in brain iron exceeding that in healthy controls. Quantitative susceptibility mapping and R2* mapping are established MR imaging techniques that we used to noninvasively quantify brain iron in subjects with hereditary hemochromatosis.
MATERIALS AND METHODS: Fifty-two patients with hereditary hemochromatosis and 47 age- and sex-matched healthy controls were imaged using a multiecho gradient-echo sequence at 3T. Quantitative susceptibility mapping and R2* data were generated, and regions within the deep gray matter were manually segmented. Mean susceptibility and R2* relaxation rates were calculated for each region, and iron content was compared between the groups.
RESULTS: We noted elevated iron levels in patients with hereditary hemochromatosis compared with healthy controls using both R2* and QSM methods in the caudate nucleus, putamen, pulvinar thalamus, red nucleus, and dentate nucleus. Additionally, the substantia nigra showed increased susceptibility while the thalamus showed an increased R2* relaxation rate compared with healthy controls, respectively.
CONCLUSIONS: Both quantitative susceptibility mapping and R2* showed abnormal levels of brain iron in subjects with hereditary hemochromatosis compared with controls. Quantitative susceptibility mapping and R2* can be acquired in a single MR imaging sequence and are complementary in quantifying deep gray matter iron.
ABBREVIATIONS:
- CN
- caudate nucleus
- GP
- globus pallidus
- DGM
- deep gray matter
- DN
- dentate nucleus
- FDRI
- field-dependent relaxation rate increase
- HC
- healthy controls
- HH
- hereditary hemochromatosis
- PUT
- putamen
- PT
- pulvinar of the thalamus
- QSM
- quantitative susceptibility mapping
- RN
- red nucleus
- SN
- substantia nigra
- SWIM
- susceptibility weighted imaging and mapping
- THA
- thalamus
Brain iron deposition in subjects with hereditary hemochromatosis (HH) has received very little attention to date, and very few descriptions of brain imaging showing iron deposition for these patients have been reported in the literature.1⇓-3 Hemochromatosis is an inherited disorder of parenchymal iron overload characterized by several genetic mutations as its causative factor.4,5 The most common mutation in White patients that leads to HH involves the HFE gene.5,6 Clinically, it manifests as iron deposition in several organs including the liver, skin, pancreas, joints, bones, and heart.4,7 Hepatic iron deposition in subjects with HH is thought to reflect total body iron stores.8 Noninvasive imaging methods using MR imaging have been used to quantify hepatic iron deposition in subjects with HH.8,9 These methods can also be applied to imaging brain iron.
Both R2* mapping and quantitative susceptibility mapping (QSM) are highly sensitive and stable methods for assessing brain iron in the form of ferritin, particularly in the deep GM where it is concentrated.10,11 Furthermore, R2* and QSM have been validated in histologic studies.12,13 R2* maps can be used to calculate putative iron via the magnetization transverse relaxation rates in the gradient-echo images, and QSM reconstructs local susceptibility differences from the filtered phase data.14 Furthermore, both methods can be calculated from the same gradient recalled- echo scan within a clinically acceptable imaging time. Iron quantification using R2* mapping and QSM has been extensively investigated in patients with neurodegenerative disorders including Parkinson’s disease, multiple sclerosis, neurodegeneration with brain iron accumulation, and several other disorders.15⇓-17 Therefore, we chose to apply these methods in a unique cohort of subjects with hemochromatosis as well as age-matched healthy controls (HC) to characterize cerebral iron deposition in deep gray matter (DGM) nuclei. Having baseline levels of iron may be useful for diagnosis and longitudinally tracking the course of the disease or the efficacy of therapeutic interventions.
MATERIALS AND METHODS
Subjects
We enrolled 52 subjects (30 men; mean age, 58.23 [SD, 12.29] years and 22 women; mean age, 58.00 [SD, 14.91] years) with HH and 47 age- and sex-matched healthy controls (19 men; mean age, 53.32 [SD, 12.82] years and 28 women; mean age, 54.46 [SD,13.38] years; Table 1). No age differences were seen between these groups (t = −1.56, P = .12). The demographic details of the 52 subjects who underwent MR imaging are given in Table 2.
Mean age of subjects with HH and healthy controls
Demographics of patients with HH who underwent MR imaging
MR Imaging and QSM Processing
All subjects were imaged using a 3T Discovery MR750 system with a 32-channel head coil (GE Healthcare). Images were collected with the following parameters using a spoiled multiecho gradient recalled-echo sequence: 6 echoes with a TE from 5 to 30 ms and an echo spacing of 5 ms, flip angle = 7°, TR = 36 ms, FOV = 220 mm × 220 mm, matrix size = 366 × 366, section thickness = 2 mm. Images were interpolated to an in-plane display resolution 0.43 mm ×0.43 mm. The scan time was 7 minutes 20 seconds.
QSM data were reconstructed for each echo individually using an in-house algorithm with the following steps: The FSL Brain Extraction Tool (http://fsl.fmrib.ox.ac.uk/fsl/fslwiki/BET)18 was used to isolate the brain tissue (threshold = 0.2, erode = 4, and island = 2000); a 3D phase unwrapping algorithm (3DSRNCP)19 was used to unwrap the original phase data; and the sophisticated harmonic artifact reduction (SHARP)20 filter was used to remove unwanted background fields (threshold = 0.05 and deconvolution kernel size = 6). A truncated k-space division-based inverse filtering technique (threshold = 0.1) with an iterative approach (iteration threshold = 0.1 and number of iterations = 4) was used to reconstruct the susceptibility map.21 The resulting susceptibility map was constructed from the QSM data from TE2–TE6 using a method that uses a weighted averaging of each TE based on its SNR.22 R2* maps were generated using a previously established conventional method.23 We did not use the first echo data because it caused reconstruction errors when combining it with the others.
ROIs in the DGM were traced by 2 experienced raters on the QSM images (due to high contrast) using Signal Processing In NMR (SPIN) Software (SpinTech MR imaging) and reviewed by a neurologist/radiologist (S.S.). Full width at half maximum thresholding was used to delineate the boundary. Manual adjustments were performed if the algorithm failed. Interrater agreement was established using an intraclass correlation coefficient for absolute agreement.24
We analyzed the following structures: caudate nucleus (CN), globus pallidus (GP), putamen (PUT), pulvinar of the thalamus (PT), red nucleus (RN), substantia nigra (SN), thalamus (THA), and dentate nucleus (DN). The ROIs were then overlaid on the R2* data. Subsequently, mean susceptibility and R2* values for each region were calculated and compared between patients with HH and healthy controls. All reported structural measurements were averaged bilaterally. Statistical analysis was performed using SPSS, Version 22 (IBM). Demographic details of the study subjects are described as mean (SD) for continuous variables and as frequency for categoric variables. Comparative analysis of the mean R2* and the susceptibility of DGM nuclei between study groups was performed using unpaired t tests. The significance level was set at .05.
RESULTS
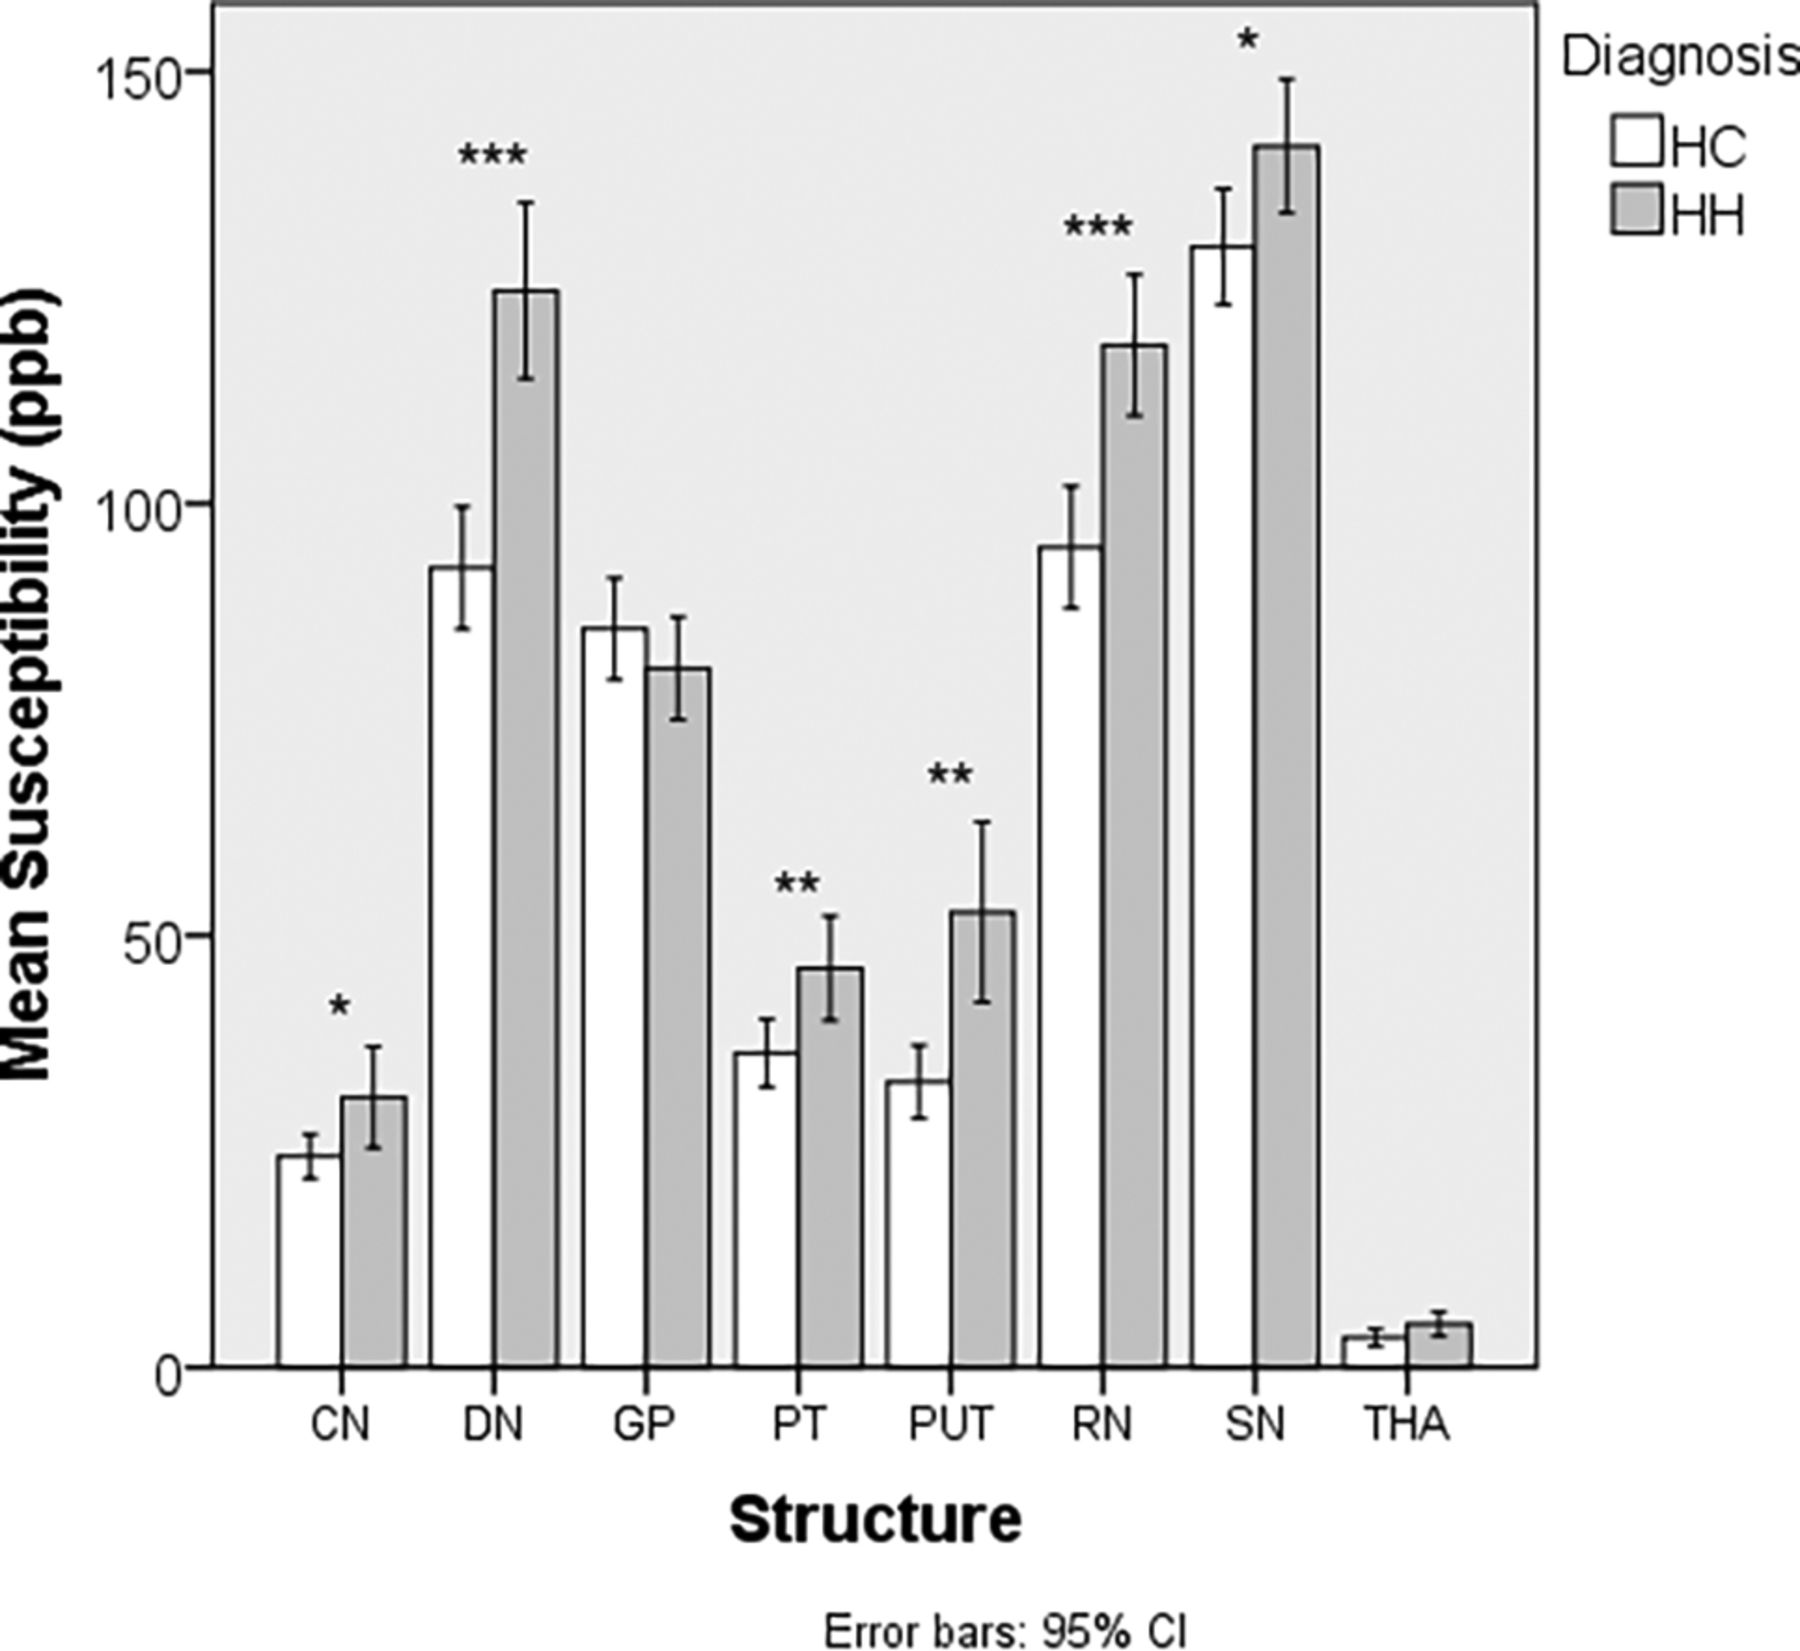
A total of 52 patients with HH and 47 HCs were included in the MR imaging analyses. R2* and susceptibility results are shown in Tables 3 and 4. In both analyses, we noted multiple structures with elevated iron in the HH group compared with the HC group. These structures included the CN, PUT, PT, RN, and the DN. QSM showed elevated iron in the SN, while R2* showed elevated iron in the THA.
Comparative analysis of mean susceptibility (parts per billion) in the DGM nuclei between patients with HH and HCa
Comparative analysis of R2* (s−1) in the deep gray matter nuclei between subjects with HH and HC
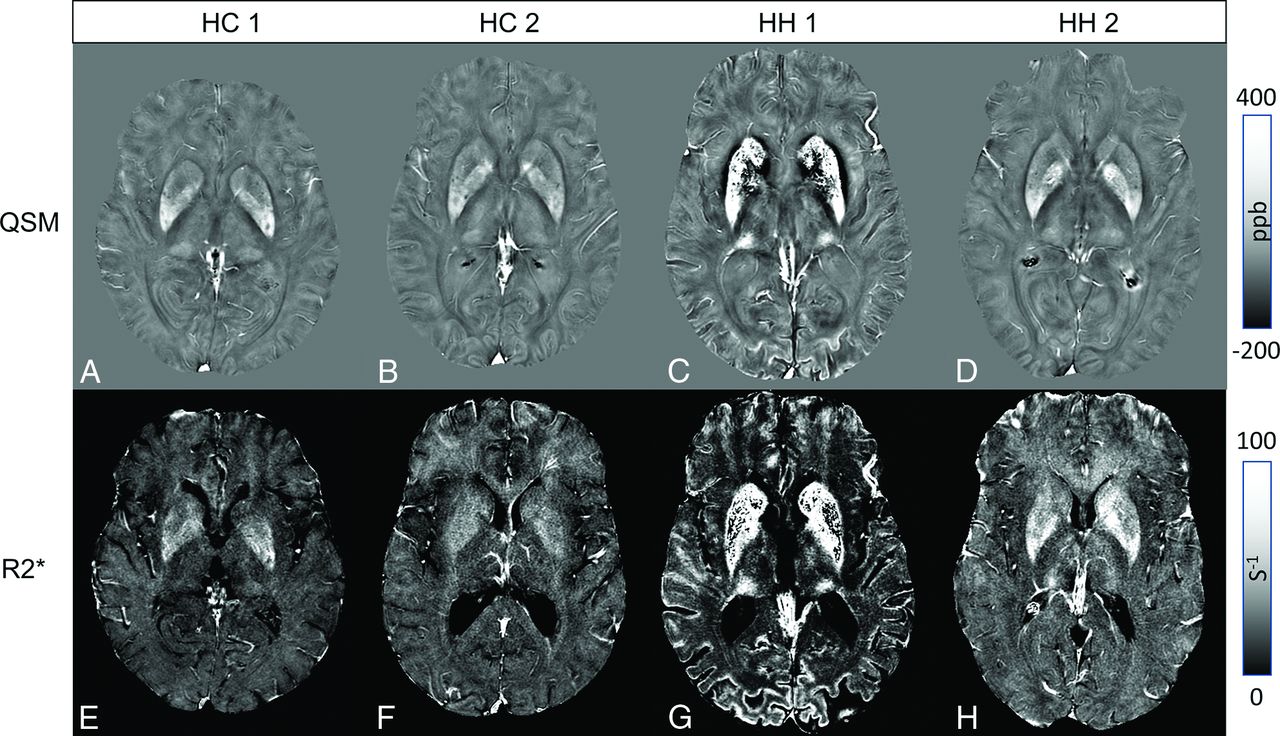
Examples of how increases in iron manifest (appearing as hyperintense regions) in both methods for patients with HH and HC are shown in Fig 1. One of the subjects with extreme iron deposition also had iron increases in the cuneus and cingulate sulcus (Fig 1C, -G). In this same patient, the iron was so high (approaching 1 part per million in some cases) that we could not reconstruct the R2* values for the whole regions of the CN and PUT due to lack of signal in the magnitude images. This case also showed elevated iron within the SN and the GP. We plotted iron content in Figs 2 and 3 to highlight the group differences between the 2 cohorts.

Upper row: QSM showing 2 HC (A and B) and 2 subjects with HH (C and D). Lower row: Corresponding R2* maps. Elevated striatal and PT iron is depicted in both subjects with HH (C and D, F and G). For 1 subject (C and F), high iron can be seen in the cuneus and striatal cortex.

Comparison of susceptibility (parts per billion) between patients with HH and HC. Asterisk indicates P < .05; double asterisks, P < .01; triple asterisks, P < .001.

Comparison of R2* (s−1) between patients with HH and HC. Double asterisks indicate P < .01; triple asterisks, P < .001.
DISCUSSION
R2* mapping and QSM are complementary MR imaging postprocessing techniques for detecting abnormal iron in the DGM in subjects with hemochromatosis. Furthermore, they are also sensitive for discriminating HH from HC as noted by the low P values for numerous structures (Table 3). These methods have the potential to detect abnormal brain iron in patients with HH.
HH is the most common inherited disorder of systemic iron excess in populations of Northern European descent.25 HFE C282Y mutations are the most frequent cause of HH.26⇓-28 As a result of HFE mutations, iron accumulates in excess in several organs, in particular the liver, skin, pancreas, endocrine organs, and heart.29 Brain iron deposition has been controversial in HH because the presence of an intact blood-brain barrier is proposed to protect against brain iron overload.30,31 However, recent findings suggest that HFE is expressed strategically at the blood-brain barrier in the endothelium, and several authors have argued that this expression of HFE would lead to excessive brain iron deposition because HFE mutations are associated with high iron accumulation in several other organs.32⇓⇓⇓-36 The present study validated this finding of excess brain iron deposition in a fraction of the HH cases using both QSM and R2*, whose postprocessing is derived from 1 spoiled gradient recalled-echo MR imaging sequence.
Kalpouzos et al37 studied the influence of brain iron overload and the link to the genetic polymorphisms associated with iron dysregulation (C282Y and H63D) in healthy subjects. They hypothesized that elevated iron content in these structures would negatively influence cognitive outcome. Using QSM, we found that carriers of the C282Y allele had higher levels of iron only in the PUT compared with noncarriers. Both brain iron and transferrin saturation, a serum marker of elevated iron, are associated with status, but the authors suggested a beneficial effect of HFE-positive carrier status relating to brain iron and executive function. Conversely, subjects with HFE-negative status showed a correlation between brain iron and working memory, a finding similar to that in Bartzokis et al.2 They observed a correlation between iron measured via susceptibility and transferrin saturation, though age did not magnify the effect of HFE-positive status on brain and blood iron. Subjects with iron overload were not part of the cohort. Our work showed elevated iron content in the rest of the DGM (SN, DN, CN, RN, THA, and PT) in either QSM, R2*, or both in the cohort with the C282Y allele with a hemochromatosis diagnosis. Another recent article using the same data set addressed the influence of regional brain iron deposition as measured with QSM and development of specific movement disorders in subjects with HH. Therefore, we did not include any correlative analysis with clinical data in the current article.38
The field-dependent relaxation rate increase (FDRI) method has been used to demonstrate higher iron accumulation in the brain of male cohorts who are carriers of gene variants of iron metabolism, namely HFE H63D and transferrin C2, compared with noncarriers.1 Berg et al39 reported increased iron in the basal ganglia using CT, MR imaging, and sonography; however, the sample size was only 14 subjects. Additionally, multiple case reports with movement disorders have been associated with HH and MR imaging signal changes related to iron.40 Large-scale studies using quantitative MR imaging are scarce; however, Bartzokis et al1 have mapped basal ganglia iron FDRI and found increased iron in the DGM in subjects lacking at least 1 gene for HH. One of the key differences between FDRI and R2* is that FDRI measures R2 relaxation (relaxation from spin-spin interactions) but R2* includes both spin-spin interactions and the effects from field inhomogeneities induced by local increases in iron. FDRI is cumbersome to acquire data because it requires scans from multiple systems and field strengths to calculate R2 (1/R2). Additionally, it is subject to scanner variability.41
Measurements from the 3 methods (FDRI, R2*, and QSM)17,42,45 correlate with postmortem iron measurements from the seminal work by Hallgren and Sourander.43 FDRI is believed to be impervious to the presence of myelin as R2* and phase are; however, gray matter is not well-myelinated so the confounding effects from myelin may be negligible.41 Furthermore, smaller changes in iron as well as heterogeneity within structures can be more easily detected using R2* and QSM, with the latter being the most sensitive.17 We noted a discrepancy in the results for the GP, THA, and the SN when comparing QSM and R2* results in discriminating groups. The GP is a known source of physiologic mineralization and calcification, which may explain the discrepant (though nonsignificant) results between the 2 measures. QSM can discriminate between paramagnetic signal like nonheme iron and diamagnetic signal from mineralization and calcification, whereas R2* mapping cannot. When comparing the QSM and R2* plots in Figs 2 and 3 for the GP, we did not see a clear separation between the groups on the QSM plot, demonstrating the additive effect of both diamagnetic and paramagnetic substances on R2* values.44 The differences in the results between the methods when evaluating the THA and SN may be due to the heterogeneity of iron both within the group, because there were some cases with excessive iron, as well as within the structures themselves. Therefore, future analyses may consider using thresholding approaches to reduce within-structure variance.45
The susceptibility and R2* results for the HC are in accordance with multiple articles.46⇓-48 Work from Ghassaban et al48 compared iron content between subjects with Parkinson disease and aged HC using similar methods and found that QSM is more sensitive at detecting iron generally using the same processing algorithm with thinner sliced data. Although we did not compare the sensitivity or specificity of QSM and R2* in discriminating patients with HH and HC on the basis of on iron content, Feng et al49 have also reported less variation in QSM results compared with R2*. Yi and Sethi47 have shown repeatability with multisite, multiscanner data using iterative SWIM reconstruction methods in a large, multi-site cohort of subjects. Although iterative SWIM can mitigate streaking artifacts inherent in truncated k-space division susceptibility mapping, the weighted combination of SWIMs by TE may lessen these effects while providing good SNR. Using a structurally constrained iterative SWIM approach may reduce noise and streaking artifacts even further.22
Although QSM and R2* are generally highly stable measurements, they are still subject to multiple sources of error from collection and errors propagated from the different processing steps.10 Susceptibility is a relative measurement in that the values reported are changes compared with the surrounding tissue. We did not use a reference area such as WM or CSF, and whether the effect size of iron deposition in hemochromatosis is large enough compared to the magnitude of iron in a reference area remains to be seen. It is possible that the THA, being close in susceptibility to WM (∼0 parts per billion), may have been affected by these shifts in QSM that led to similar susceptibility values between patients with HH and HC. R2* has an advantage because it does not need a reference region to normalize measurements. On the other hand, for abnormally high iron, the lack of signal in the images will cause the algorithm to fail. In this particular study, we capitalized on the multiecho nature of the sequence and created not only R2* maps but also QSM with higher SNR as opposed to a single-echo approach. If scanning time is an issue, then single-echo approaches for QSM may be run to save time.44 Additionally, short TEs (10–15 ms) may be beneficial to collect data to avoid phase aliasing for subjects with abnormally high iron content.
This study has several limitations: 1) Manual demarcation of ROIs may generate unwanted sources of error from interrater variation; therefore, using an automated deep gray matter segmentation technique may help mitigate these errors.48 2) This study is cross-sectional in nature and only provides a snapshot of iron content in time for an individual. Future study designs should be longitudinal; this approach may yield estimates of change and provide information about the cause-and-effect relationship of iron deposition with respect to disease progression or treatment models. 3) Not all subjects with HH had abnormal iron, and there was overlap with some of the HC.
CONCLUSIONS
Subjects with HH have abnormal brain iron in the DGM compared with controls. QSM and R2* are complementary ways to noninvasively quantify putative iron content from 1 MR imaging sequence. Future study designs should involve multiple time points to track iron deposition longitudinally.
ACKNOWLEDGMENTS
The authors would like to thank the MR Innovations India team for their assistance with image processing.
Footnotes
Disclosure forms provided by the authors are available with the full text and PDF of this article at www.ajnr.org.
References
- Received February 7, 2022.
- Accepted after revision May 10, 2022.
- © 2022 by American Journal of Neuroradiology


