Advertisement

Main menu

  • Home
  • Content
    • Current Issue
    • Accepted Manuscripts
    • Article Preview
    • Past Issue Archive
    • Video Articles
    • AJNR Case Collection
    • Case of the Week Archive
    • Case of the Month Archive
    • Classic Case Archive
  • Special Collections
    • AJNR Awards
    • Low-Field MRI
    • Alzheimer Disease
    • ASNR Foundation Special Collection
    • Photon-Counting CT
    • View All
  • Multimedia
    • AJNR Podcasts
    • AJNR SCANtastic
    • Trainee Corner
    • MRI Safety Corner
    • Imaging Protocols
  • For Authors
    • Submit a Manuscript
    • Submit a Video Article
    • Submit an eLetter to the Editor/Response
    • Manuscript Submission Guidelines
    • Statistical Tips
    • Fast Publishing of Accepted Manuscripts
    • Graphical Abstract Preparation
    • Imaging Protocol Submission
    • Author Policies
  • About Us
    • About AJNR
    • Editorial Board
    • Editorial Board Alumni
  • More
    • Become a Reviewer/Academy of Reviewers
    • Subscribers
    • Permissions
    • Alerts
    • Feedback
    • Advertisers
    • ASNR Home

User menu

  • Alerts
  • Log in

Search

  • Advanced search
American Journal of Neuroradiology

American Journal of Neuroradiology

ASHNR American Society of Functional Neuroradiology ASHNR American Society of Pediatric Neuroradiology ASSR
  • Alerts
  • Log in

Advanced Search

  • Home
  • Content
    • Current Issue
    • Accepted Manuscripts
    • Article Preview
    • Past Issue Archive
    • Video Articles
    • AJNR Case Collection
    • Case of the Week Archive
    • Case of the Month Archive
    • Classic Case Archive
  • Special Collections
    • AJNR Awards
    • Low-Field MRI
    • Alzheimer Disease
    • ASNR Foundation Special Collection
    • Photon-Counting CT
    • View All
  • Multimedia
    • AJNR Podcasts
    • AJNR SCANtastic
    • Trainee Corner
    • MRI Safety Corner
    • Imaging Protocols
  • For Authors
    • Submit a Manuscript
    • Submit a Video Article
    • Submit an eLetter to the Editor/Response
    • Manuscript Submission Guidelines
    • Statistical Tips
    • Fast Publishing of Accepted Manuscripts
    • Graphical Abstract Preparation
    • Imaging Protocol Submission
    • Author Policies
  • About Us
    • About AJNR
    • Editorial Board
    • Editorial Board Alumni
  • More
    • Become a Reviewer/Academy of Reviewers
    • Subscribers
    • Permissions
    • Alerts
    • Feedback
    • Advertisers
    • ASNR Home
  • Follow AJNR on Twitter
  • Visit AJNR on Facebook
  • Follow AJNR on Instagram
  • Join AJNR on LinkedIn
  • RSS Feeds

AJNR Awards, New Junior Editors, and more. Read the latest AJNR updates

Research ArticleAdult Brain
Open Access

Short-Range Structural Connections Are More Severely Damaged in Early-Stage MS

H. Wu, C. Sun, X. Huang, R. Wei, Z. Li, D. Ke, R. Bai and H. Liang
American Journal of Neuroradiology March 2022, 43 (3) 361-367; DOI: https://doi.org/10.3174/ajnr.A7425
H. Wu
aFrpm the Department of Neurology (H.W., X.H., R.W., D.K., H.L.), First Affiliated Hospital
  • Find this author on Google Scholar
  • Find this author on PubMed
  • Search for this author on this site
  • ORCID record for H. Wu
C. Sun
bKey Laboratory of Biomedical Engineering of Ministry of Education (C.S., Z.L.), College of Biomedical Engineering and Instrument Science
  • Find this author on Google Scholar
  • Find this author on PubMed
  • Search for this author on this site
  • ORCID record for C. Sun
X. Huang
aFrpm the Department of Neurology (H.W., X.H., R.W., D.K., H.L.), First Affiliated Hospital
  • Find this author on Google Scholar
  • Find this author on PubMed
  • Search for this author on this site
  • ORCID record for X. Huang
R. Wei
aFrpm the Department of Neurology (H.W., X.H., R.W., D.K., H.L.), First Affiliated Hospital
  • Find this author on Google Scholar
  • Find this author on PubMed
  • Search for this author on this site
  • ORCID record for R. Wei
Z. Li
bKey Laboratory of Biomedical Engineering of Ministry of Education (C.S., Z.L.), College of Biomedical Engineering and Instrument Science
  • Find this author on Google Scholar
  • Find this author on PubMed
  • Search for this author on this site
  • ORCID record for Z. Li
D. Ke
aFrpm the Department of Neurology (H.W., X.H., R.W., D.K., H.L.), First Affiliated Hospital
  • Find this author on Google Scholar
  • Find this author on PubMed
  • Search for this author on this site
  • ORCID record for D. Ke
R. Bai
cDepartment of Physical Medicine and Rehabilitation of the Affiliated Sir Run Run Shaw Hospital and Interdisciplinary Institute of Neuroscience and Technology (R.B.), School of Medicine, Zhejiang University, Hangzhou, China
  • Find this author on Google Scholar
  • Find this author on PubMed
  • Search for this author on this site
  • ORCID record for R. Bai
H. Liang
aFrpm the Department of Neurology (H.W., X.H., R.W., D.K., H.L.), First Affiliated Hospital
  • Find this author on Google Scholar
  • Find this author on PubMed
  • Search for this author on this site
  • ORCID record for H. Liang
  • Article
  • Figures & Data
  • Supplemental
  • Info & Metrics
  • Responses
  • References
  • PDF
Loading

Abstract

BACKGROUND AND PURPOSE: Long-range connections are more severely damaged and relevant for cognition in long-standing MS. However, the evolution of such coordinated network damage in patients with MS is unclear. We investigated whether short- and long-range structural connections sustained equal damage in early-stage MS.

MATERIALS AND METHODS: Sixteen patients with early-stage MS and 17 healthy controls were scanned by high-resolution, multishell diffusion imaging on 7T MR imaging and assessed cognitively. We investigated macrostructural properties in short- and long-range fibers and of microstructural metrics derived from 2 quantitative diffusion MR imaging models: DTI and neurite orientation dispersion and density imaging.

RESULTS: Patients had significant WM integrity damage—that is, higher radial diffusivity and a lower intracellular volume fraction in the focal WM lesions. Compared with the healthy controls, the patients had noticeable microstructure changes in both short- and long-range fibers, including increased radial diffusivity, mean diffusivity, and axial diffusivity. Z scores further indicated greater damage in the short-range fibers than in the long-range fibers.

CONCLUSIONS: Our findings demonstrate that more severe demyelination preceding axonal degeneration occurs in short-range connections but not in long-range connections in early-stage MS, suggesting the possibility that there are cortical lesions that are undetectable by current MR imaging.

ABBREVIATIONS:

AD
axial diffusivity
EDSS
Expanded Disability Status Scale
FA
fractional anisotropy
ficvf
intracellular volume fraction
HC
healthy control
MD
mean diffusivity
NODDI
neurite orientation dispersion and density imaging
ODI
Orientation Dispersion Index
RD
radial diffusivity

MS has been histologically characterized by the aggregation of inflammation, demyelination, gliosis, and axonal transection that ultimately leads to neurologic disability in young adults. MS can present with highly variable symptoms such as loss of vision, limb weakness, sensory loss, ataxia, and cognitive impairment.1,2 Neuroimaging studies have helped to define the pathologic substrates and microstructure (eg, demyelination) alternations of this disorder in focal lesions and diffusely abnormal tissue.3,4 While the specific WM fiber changes remain elusive, these local abnormalities in tissue microstructure are not enough to explain the clinically observed functional impairment.5,6 Nevertheless, there is growing evidence that neurologic impairment in MS is determined more by specific large-scale functional network alterations than by local tissue microstructural alterations.7,8

The subtle balance between short- and long-range connections contributes to the integration and segregation of the brain connectome. Connections of different lengths are found in different locations across the brain; short-range fibers are more abundant than their long-range counterparts, and the short-range fibers connect adjacent anatomic gyri that integrate multimodal information. Concurrently, long-range connections allow rapid and efficient interareal communication (eg, among cortical regions where tracts may cross the centrum semiovale) or diversification of information.9⇓⇓-12 Cognitive impairment is one of the primary symptoms of MS, occurring in up to 70% of patients.2 The specific damage to long-range connections in patients with long-standing MS would affect cognition by reducing the global efficiency of brain networks.13 However, it is still unclear when such distinct connectivity adjustments happen and whether this is a unique feature of patients with long-standing MS. In-depth knowledge of the evolution of the balance between short- and long-range connections during disease progression would significantly increase the understanding of the clinical symptoms of MS.

Previous studies have found that cortical demyelination occurs early, is common in patients with MS, and would affect the U-fibers more.4,14 Thus, we propose the following hypothesis: Short-range connections might be more severely damaged than long-range connections in early-stage MS, which is different from long-lasting MS. To make a definite determination, we explored the potential damage of long- and short-range structural connections in patients with early-stage MS who exhibited significant cognitive decline in this study. High-resolution DWI with multishell acquisition and structural MR imaging was performed on 16 patients with early-stage MS and 17 healthy controls (HCs), to quantify the damage to short- and long-range connections.

MATERIALS AND METHODS

Participants

For this prospective study, we recruited 16 patients with early-stage relapsing-remitting MS with a disease duration of <10 years.15,16 Patients had been diagnosed with MS according to the 2017 revisions of the McDonald criteria,17 had been free of clinical relapse, and had not required steroid treatment for at least 1 month before participation. Exclusion criteria were evidence of other structural brain diseases; a history of neuropsychiatric disorders, cognitive impairment, or other significant medical conditions; or contraindications to MR imaging. In addition, 17 age- and education level–matched HCs were recruited. Informed consent was obtained from each participant in this study, and the protocol was approved by the First Affiliated Hospital, School of Medicine, Zhejiang University. The cohorts have not been described in any previous publication.

Clinical Assessment

Neuropsychological tests were used to assess the most frequently impaired cognitive domains in MS. The tests included the Symbol Digit Modalities Test18 for information-processing speed, the Verbal Fluency Test19 for executive function, the Digit Span Test8 for attention, and the Auditory Verbal Learning Test20 for episodic memory. Also, the Mini-Mental State Examination and the Montreal Cognitive Assessment21 were performed to assess global cognitive function, and the Expanded Disability Status Score (EDSS)22 was performed for overall disability. The mean of the neuropsychological assessment of the patients was further analyzed by evaluating the deviation from the mean values based on the HC group. The results of each patient’s neuropsychological tests were regarded as normal if they declined <1.5 SDs from the mean values of the HC group;23 patients were diagnosed as cognitively impaired when the results of at least 2 tests had declined.24

Image Acquisition

All MR imaging data were acquired using a 7T MR imaging scanner (Magnetom; Siemens) with a 32-channel Nova Medical Head Coil (Siemens). For the structural MR imaging scans, T1-weighted images were acquired using a 3D MP2RAGE sequence with 0.8-mm isotropic resolution. The 3D sampling perfection with application-optimized contrasts by using different flip angle evolution (SPACE sequence; Siemens) T2 sequence was performed with a voxel size of 0.8 × 0.8 × 0.8 mm3. A multiband 2D EPI sequence was used for the multishell DWI protocol: 1.5-mm isotropic resolution, 3 shells (1000/2000/3000 s/mm2, 40 directions for each shell, single repetitions), and 8 repetitions without diffusion weighting; b=0 s/mm2. The gradient directions were optimized to maximize the minimal angle between directions and cross shells using the DMRITool25 (https://diffusionmritool.github.io).

DWI Data Preprocessing and Modeling

The image-processing pipeline is detailed below and summarized in Fig 1. All the preprocessing steps for raw DWIs, including eddy currents, motion, and EPI geometric distortion correction, were processed in the TORTOISE (Version 3.2; https://tortoise.nibib.nih.gov/) software package,26 and a T2-weighted image was used as the reference image. The output images with opposite phase-encoding were then used for EPI geometric distortion correction using the DR-BUDDI toolbox.27 The preprocessed diffusion data sets were then used for further diffusion metrics calculations.

FIG 1.
  • Download figure
  • Open in new tab
  • Download powerpoint
FIG 1.

Overview of the image acquisition and processing pipeline.

The DTI reconstruction was performed in TORTOISE using b = 0 and 1000 s/mm2, along with the calculation of fractional anisotropy (FA), axial diffusivity (AD), radial diffusivity (RD), and mean diffusivity (MD). The neurite orientation dispersion and density imaging (NODDI) reconstruction using the 3-shell data was performed in the NODDI toolbox in Matlab (Version 1.01; University College London, London, United Kingdom, http://mig.cs.ucl.ac.uk/index.php?n=Tutorial.NODDImatlab).28 Maps of NODDI metrics, including intracellular volume fraction (ficvf) and the Orientation Dispersion Index (ODI) were then generated.

WM Lesion ROI Identification and Analysis

The individual T1-weighted image was linearly registered to each patient’s B0 image. A whole-brain WM mask was segmented with coregistered T1-weighted images. The ROIs of patients with WM lesions were manually drawn on T1-weighted images with the complementing guidance of the T2-weighted images. The lesion load of each type of fiber was further defined as the fraction of fiber volume overlapped with the WM lesions (ie, volume of the fiber overlapped with WM lesions divided by the whole volume of this type of fiber).

B0 images of each HC were first linearly (FMRIB Linear Image Registration Tool [FLIRT]; http://www.fmrib.ox.ac.uk//fsl/fslwiki/FLIRT) and then nonlinearly registered to the same diffusion-weighted images in each patient with MS to obtain the location-matched ROIs in the HC group. Finally, the mean value of the diffusion MR imaging metrics for each ROI or whole WM was calculated.

Tractography

The probabilistic tractography procedure was performed on the MRtrix3 software package (http://www.mrtrix.org).29 Five tissue-type segmented images obtained from the T1-weighted images were used for the Anatomically-Constrained Tractography framework.30 We estimated the response functions and computed the fiber orientation distributions from the preprocessed DWI. Next, streamline tractography was performed by randomly seeding 20 million streamlines with default settings filtered to 2 million streamlines using spherical-deconvolution informed filtering of tractograms.31

We segmented structural fiber tracts into short- and long-range fibers as previously described.13 Then, we calculated the number and average length of the fibers in the whole WM. In addition, the mean of the microstructure metrics (eg, FA, ficvf) along the selected fiber tracts was calculated. We used the z score to compare the MR imaging metrics between short- and long-range fibers on a common scale. The formula for calculating the z score is z = (x − μ)/σ, where x is the mean value of the MR imaging metrics of short or long fibers in the MS group, μ is the mean value of corresponding MR imaging metrics in the MS group, and σ is the SD of the corresponding MR imaging metrics in the HC group.13

Statistical Analysis

Statistical analysis was performed using SPSS software (Version 24; IBM). Group differences in unpaired parametric data were assessed using the independent-samples t test for continuous variables and the χ2 test for categoric variables. The results of the z scores of short- and long-range fibers were analyzed using the 1-sample t test on a convergence of the average value to zero to compare with the HCs. The paired analysis of short- and long-range homologous fibers for each patient with MS was compared with the paired t tests. For patients with MS, intersubject bivariate correlation was performed between the MR imaging metrics and the clinical characteristics, while age and education level were treated as covariates of no interest. The level of statistical significance after false discovery rate correction was set at P < .05 for all statistical analyses.

RESULTS

Disability, Cognition, and Brain Volume

Demographic, clinical, and MR imaging characteristics for the patients with MS and the HCs are presented in Tables 1 and 2. In the MS cohort, patients had severe damage in several cognitive domains (Table 2). A total of 10 of 16 patients (62.5%) were classified as cognitively impaired. Among the remaining 6 patients, 3 (18.8%) showed isolated cognitive impairment in the form of reduced information-processing speed. Further brain volume comparison did not detect a significant difference in WM volume.

View this table:
  • View inline
  • View popup
Table 1:

Demographic, clinical, and MR imaging volumetric characteristics of all participantsa

View this table:
  • View inline
  • View popup
Table 2:

Summary of cognitive measuresa

Microstructure Metrics in Focal and Diffuse Lesions

The statistical analysis of the microstructure metrics assessed with the DWI of the WM lesion ROIs and whole WM is shown in Table 3. All quantitative metrics, except for ODI, of the focal lesion ROIs had a significant difference between the MS and HC groups. As for the whole WM, no significant differences were found between these 2 groups.

View this table:
  • View inline
  • View popup
Table 3:

Microstructure metrics and fiber statistics of focal WM lesions and whole-brain WMa

Difference of the Whole-Brain Fibers between MS and HC Cohorts

There were no significant differences between the MS and HC cohorts in the overall number or average length of whole-brain fibers (Table 3). However, when short- and long-range fibers were observed independently, further analysis of the microstructure metrics of the short- and long-range fibers between the HC and MS cohorts revealed that the short-range fibers in patients with MS had a significant change in FA (P < .05), MD, AD, and RD (Fig 2). Long-range fibers in patients with MS showed a significant increase in MD, AD, and RD.

FIG 2.
  • Download figure
  • Open in new tab
  • Download powerpoint
FIG 2.

The fiber microstructure metrics of whole-brain short- (black) and long-range (gray) connections in patients with MS and HCs. log2 indicates the length of fibers was denoted in a logarithmic manner with base 2.

Direct Comparison of Damage (Z Scores) to Short- and Long-Range Connections

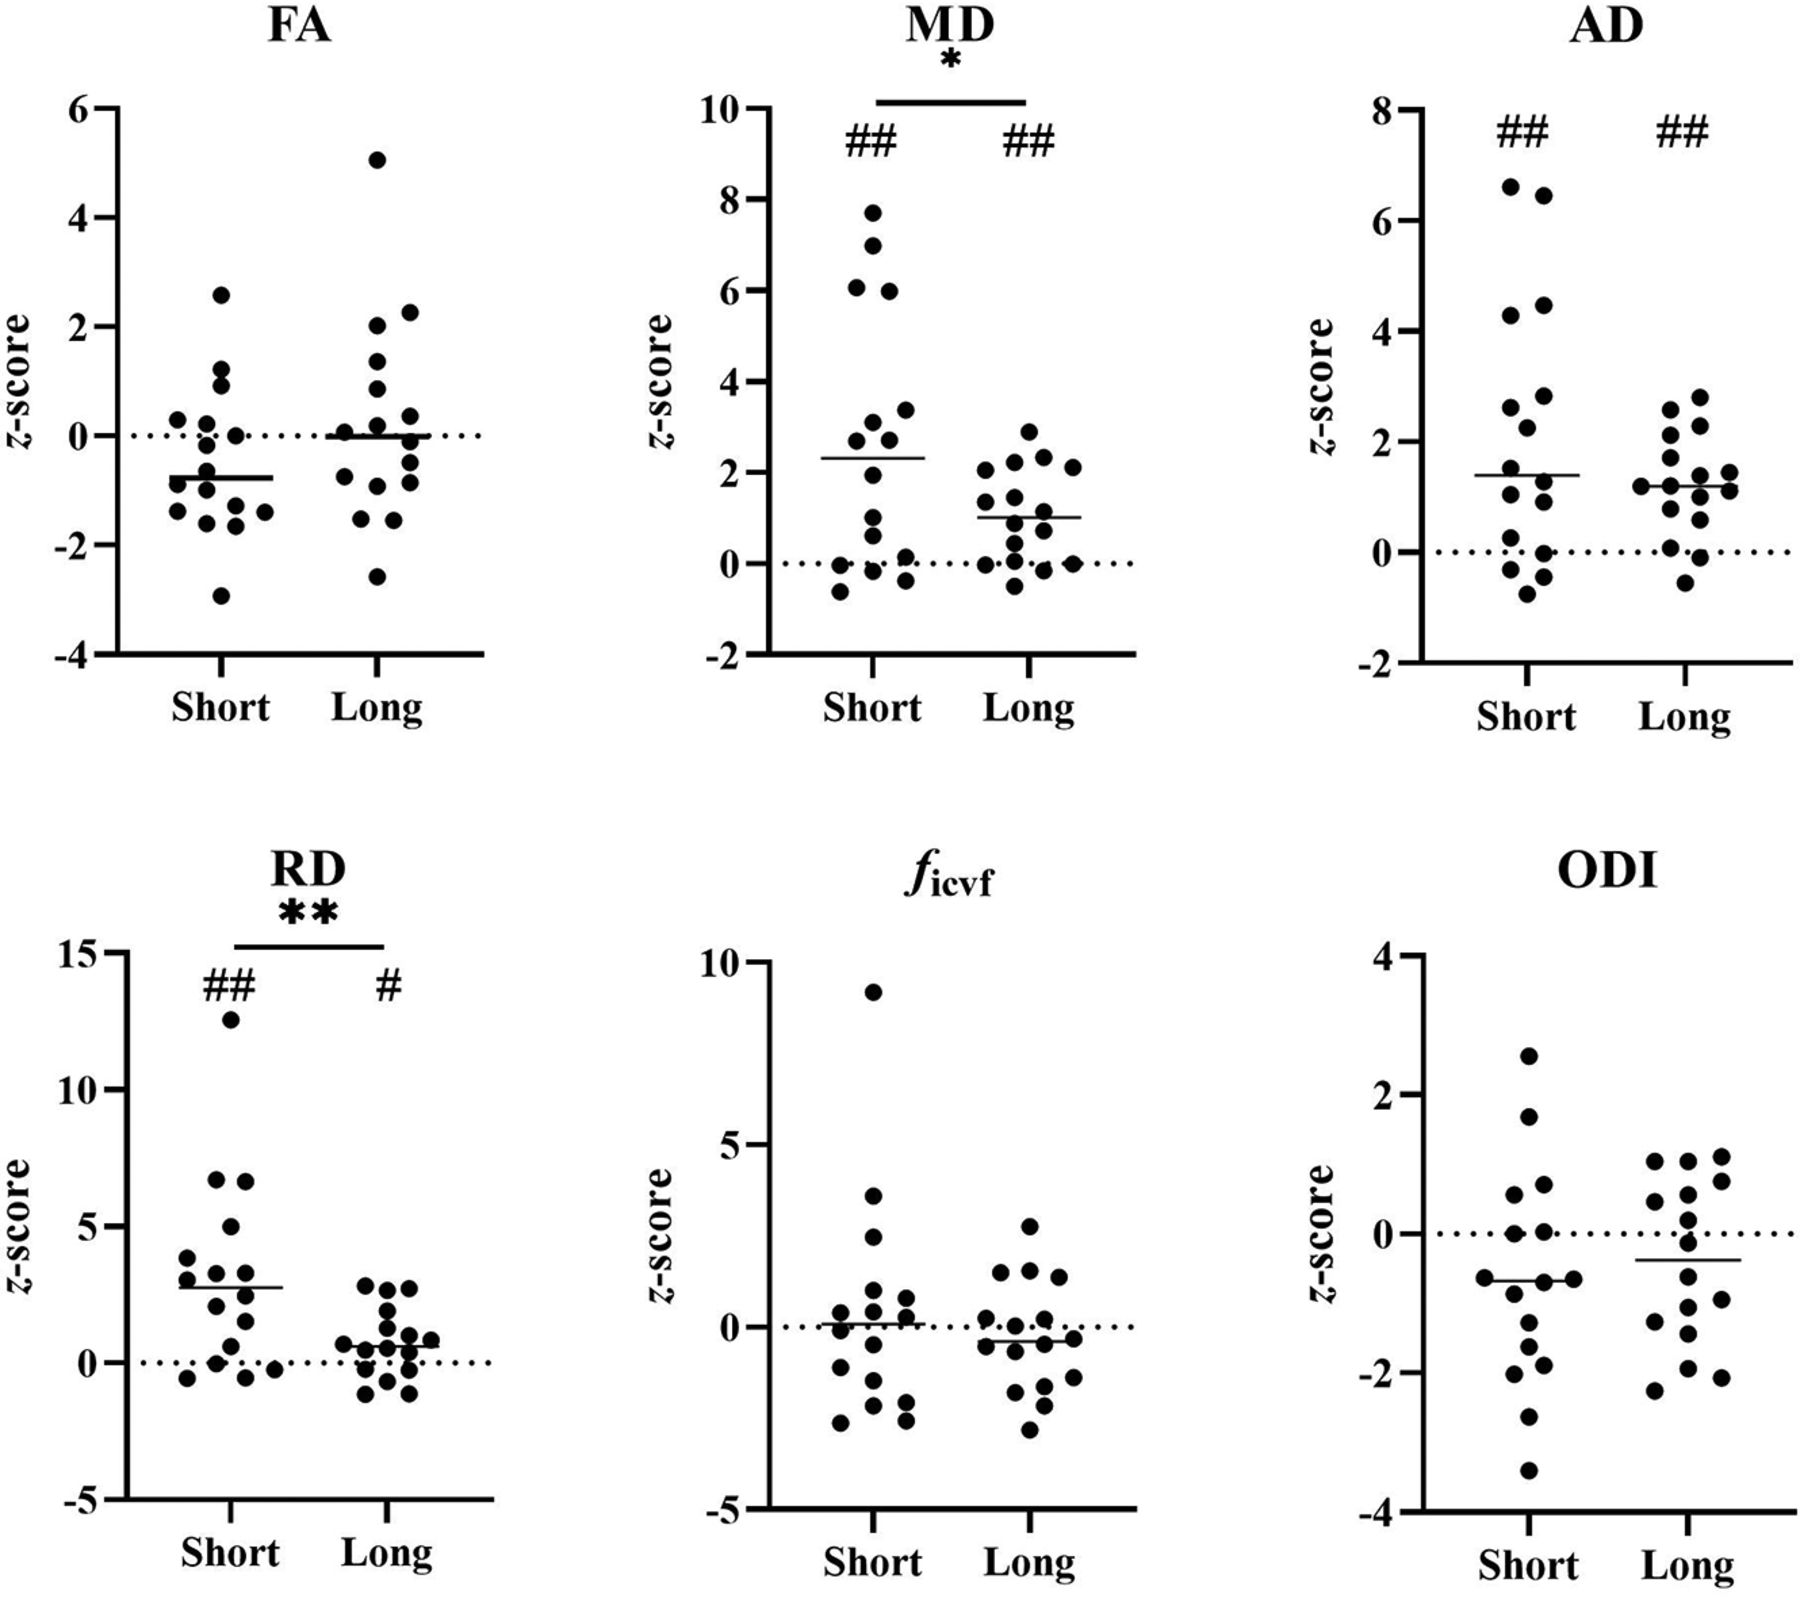
The WM lesion ROIs overlapped with 6.66% (range, 1.87%–9.55%) of the whole-brain fibers in patients with MS. The z score analysis of fiber properties is presented in Fig 3, in which both short- and long-range fibers show a significant increase in MD, AD, and RD in patients with MS compared with HCs. The increased MD, AD, and RD indicate the potential damage of WM integrity along short- and long-range fibers (Fig 3).

FIG 3.
  • Download figure
  • Open in new tab
  • Download powerpoint
FIG 3.

Severity of lesion damage (z score) compared between short- and long-range connections. The * represents a significant difference between short-and long-range fibers (P < 0.05); ** represents P < 0.01. # represents P < 0.05 using the one sample t test on a convergence of the average value to zero to compare with HCs. ## represents P < 0.01, FDR-corrected.

Further comparisons between the z scores of short- and long-range fibers show that the short-range connections have a larger increase than the long-range connections in both MD and RD. The MD z score was 2.57 (SD, 2.78) (short) versus 1.06 (SD, 1.05) (long), P < .05; and the RD z score was 3.10 (SD, 3.44) (short) versus 0.75 (SD, 1.29) (long), P < .01. The other microstructure metrics also showed the same tendency: The short-range fibers were more severely damaged than the long-range fibers.

Associations with Clinical Variables

No significant associations were found between MR imaging metrics and clinical variables after adjustment was made for the effect of age and years of education.

DISCUSSION

Long-range structural connections are more severely damaged in patients with long-standing MS.13 We have observed that the short-range connections are more severely damaged in early-stage MS, suggesting that the structural connections are altered differently during the progress of MS. In this study, the members of the MS cohort were in the early stages of disability, with a median EDSS score of 1.0, and had distinct cognitive impairment without obvious brain atrophy.

Microstructure Properties in MS WM Lesions and Whole WM

Our results show that in subjects with MS, WM lesion ROIs have higher MD, AD, and RD and lower FA and ficvf values compared with HCs. These results suggest there is damage to the WM integrity in these focal lesion areas, which is consistent with previous findings.32,33 However, there were no significant differences in the microstructure metrics of whole WM as found in previous studies,32,34 even though these changes have been observed in patients who have had MS for a longer time (>10 years).13,33 This finding is not surprising because the volume of the detectable WM lesions is relatively small (∼4 mL on average) and takes only a small portion of the whole WM in early-stage MS, while the WM lesions are much larger in long-lasting MS (eg, ∼670 mL13). In addition, previous studies have found that there was no significant difference in diffusion metrics in the normal-appearing WM of subjects with early-stage MS compared with controls.32,34 These 2 factors could make the changes of the whole-WM averaged diffusion MR imaging metrics relatively small, which means a large sample size is needed to make such changes significant in statistics.

Short-Range Connections Are More Severely Damaged in Early-Stage MS

In this study, the short-range fibers showed a more severe increase in the mean RD and MD values than the long-range fibers, a finding different from the results in patients with long-standing MS.13 Previous studies have shown that notable changes in RD are considered as noninvasive surrogate markers for myelin integrity, and myelin integrity may influence the diffusivity along the perpendicular direction of fibers; AD and ficvf correspond more to axonal loss.28,35

These results agree with MS being primarily a demyelinating disease that ultimately results in axonal degeneration, and they are in line with reported pathologic findings and current dogma.36,37 The early damage to the short-range fibers reflects the possibility that cortical lesions precede the degeneration of long-range fibers, as discussed below. Previous studies have demonstrated that short-range fibers have more myelin than long-range fibers.9,38 Injury to long axons in MS, which eventually causes the fragmentation of fibers, is secondary to myelin loss and may be the consequence of trophic disturbances after mixed outcomes of cumulative interactions among oligodendrocytes, microglia, and neurons.36 Most interesting, the ODIs of short fibers showed no significant difference between 2 groups because ODI reflects only neurite orientation, which is not sensitive to demyelination.39

Potential Invisible Leukocortical Lesions

We found that the lesion load is higher for long-range connections, suggesting that WM lesions visible in T1-/T2-weighted MR imaging are located in the long-range fibers (Online Supplemental Data). This result seems to contradict the finding of more severe microstructural damage to the short-range connections compared with the long-range connections. However, it could also be that we have failed to identify some tissue injuries within the current T1-/T2-weighted MR imaging, especially those leukocortical lesions located in the connections between anatomic neighboring areas of the cerebral cortex (short-range fibers).11,38,40 These leukocortical lesions running through the U-fibers in patients have been defined as cortical type I lesions.41 Cortical demyelination occurs early and is common in patients with MS, and it develops independent from WM lesions.4,14 With the help of ultra-high-field MR imaging, some cortical pathology can be detected in patients with MS.42,43 Fortunately, we further confirmed by MP2RAGE that the U-fiber lesions appear in almost all patients with MS (12/16); this use of MP2RAGE provides a more precise anatomic delineation of white and gray matter pathology (Online Supplemental Data).43 However, it is still challenging to detect most cortical lesions due to their relatively small size, sparse inflammatory cell infiltration, and limited damage to the blood-brain barrier. All of these factors could result in invisible cortical lesions under current MR imaging methods.42 The more severe demyelination to the short-range connections found in this study suggests that fiber tract–based microstructure analysis might be another efficient way to see the invisible cortical lesions.

Limitations and Future Work

This study has some limitations. First, our sample of patients with early-stage MS was small and recruited cross-sectionally, but large and longitudinal studies are still needed to further validate the current study and monitor how the disease progresses. Second, our understanding of the relationship between short- and long-range connections is relatively immature, and future studies combining structural data with more functional data are needed to verify the intrinsic functional architecture of brain networks. Most important, although we have carefully compared our results with the available and published pathology and radiology results and NODDI is a well-validated method, a direct comparison between MR imaging findings and the pathology of the same subject should be conducted to further confirm our interpretation.

CONCLUSIONS

We evaluated the damage to structural connections in patients with early-stage MS with cognitive impairment and found that short-range fibers are more vulnerable to damage in early-stage MS, indicating that cortical demyelination might precede the axonal loss of long-range fibers in patients with MS.

Footnotes

  • This work was supported by the National Natural Science Foundation of China (NSFC) (Grant No. 81873894) and the Natural Science Foundation of Zhejiang Province, China (Grant No. LR20H180001), China middle-young VG Clinical Research Fund (2017-CCA-VG-047), National key research and development plan of China(2019YFC0118203, 2016YFC1306402), Zhejiang key research and development plan (2017C03011).

  • H. Liang is senior author. H. Liang and R. Bai contributed equally to this work.

  • Disclosure forms provided by the authors are available with the full text and PDF of this article at www.ajnr.org.

Indicates open access to non-subscribers at www.ajnr.org

References

  1. 1.↵
    1. Reich DS,
    2. Lucchinetti CF,
    3. Calabresi PA
    . Multiple sclerosis. N Engl J Med 2018;378:169–80 doi:10.1056/NEJMra1401483 pmid:29320652
    CrossRefPubMed
  2. 2.↵
    1. Rocca MA,
    2. Amato MP,
    3. De Stefano N, et al
    ; MAGNIMS Study Group. Clinical and imaging assessment of cognitive dysfunction in multiple sclerosis. Lancet Neurol 2015;14:302–17 doi:10.1016/S1474-4422(14)70250-9 pmid:25662900
    CrossRefPubMed
  3. 3.↵
    1. Filippi M,
    2. Rocca MA,
    3. Barkhof F, et al
    ; Attendees of the Correlation between Pathological MRI Findings in MS workshop. Association between pathological and MRI findings in multiple sclerosis. Lancet Neurol 2012;11:349–60 doi:10.1016/S1474-4422(12)70003-0 pmid:22441196
    CrossRefPubMed
  4. 4.↵
    1. Kutzelnigg A,
    2. Lucchinetti CF,
    3. Stadelmann C, et al
    . Cortical demyelination and diffuse white matter injury in multiple sclerosis. Brain 2005;128:2705–12 doi:10.1093/brain/awh641 pmid:16230320
    CrossRefPubMed
  5. 5.↵
    1. Barkhof F
    . The clinico-radiological paradox in multiple sclerosis revisited. Curr Opin Neurol 2002;15:239–45 doi:10.1097/00019052-200206000-00003 pmid:12045719
    CrossRefPubMed
  6. 6.↵
    1. Mesaros S,
    2. Rocca MA,
    3. Riccitelli G, et al
    . Corpus callosum damage and cognitive dysfunction in benign MS. Hum Brain Mapp 2009;30:2656–66 doi:10.1002/hbm.20692 pmid:19067325
    CrossRefPubMed
  7. 7.↵
    1. Cercignani M,
    2. Gandini Wheeler-Kingshott C
    . From micro- to macro-structures in multiple sclerosis: what is the added value of diffusion imaging. NMR Biomed 2019;32:e3888 doi:10.1002/nbm.3888 pmid:29350435
    CrossRefPubMed
  8. 8.↵
    1. Dineen RA,
    2. Vilisaar J,
    3. Hlinka J, et al
    . Disconnection as a mechanism for cognitive dysfunction in multiple sclerosis. Brain 2009;132:239–49 doi:10.1093/brain/awn275 pmid:18953055
    CrossRefPubMed
  9. 9.↵
    1. Bajada CJ,
    2. Schreiber J,
    3. Caspers S
    . Fiber length profiling: a novel approach to structural brain organization. Neuroimage 2019;186:164–73 doi:10.1016/j.neuroimage.2018.10.070 pmid:30399419
    CrossRefPubMed
  10. 10.↵
    1. Mesulam MM
    . Large-scale neurocognitive networks and distributed processing for attention, language, and memory. Ann Neurol 1990;28:597–613 doi:10.1002/ana.410280502 pmid:2260847
    CrossRefPubMed
  11. 11.↵
    1. Ouyang M,
    2. Kang H,
    3. Detre JA, et al
    . Short-range connections in the developmental connectome during typical and atypical brain maturation. Neurosci Biobehav Rev 2017;83:109–22 doi:10.1016/j.neubiorev.2017.10.007 pmid:29024679
    CrossRefPubMed
  12. 12.↵
    1. Sepulcre J,
    2. Liu H,
    3. Talukdar T, et al
    . The organization of local and distant functional connectivity in the human brain. PLoS Comput Biol 2010;6:e1000808 doi:10.1371/journal.pcbi.1000808 pmid:20548945
    CrossRefPubMed
  13. 13.↵
    1. Meijer KA,
    2. Steenwijk MD,
    3. Douw L, et al
    . Long-range connections are more severely damaged and relevant for cognition in multiple sclerosis. Brain 2020;143:150–60 doi:10.1093/brain/awz355 pmid:31730165
    CrossRefPubMed
  14. 14.↵
    1. Calabrese M,
    2. Gallo P
    . Magnetic resonance evidence of cortical onset of multiple sclerosis. Mult Scler 2009;15:933–41 doi:10.1177/1352458509106510 pmid:19667021
    CrossRefPubMed
  15. 15.↵
    1. Engl C,
    2. Tiemann L,
    3. Grahl S, et al
    . Cognitive impairment in early MS: contribution of white matter lesions, deep grey matter atrophy, and cortical atrophy. J Neurol 2020;267:2307–18 doi:10.1007/s00415-020-09841-0 pmid:32328718
    CrossRefPubMed
  16. 16.↵
    1. Portaccio E,
    2. Amato MP,
    3. Bartolozzi ML, et al
    . Neocortical volume decrease in relapsing-remitting multiple sclerosis with mild cognitive impairment. J Neurol Sci 2006;245:195–99 doi:10.1016/j.jns.2005.07.019 pmid:16631794
    CrossRefPubMed
  17. 17.↵
    1. Thompson AJ,
    2. Banwell BL,
    3. Barkhof F, et al
    . Diagnosis of multiple sclerosis: 2017 revisions of the McDonald criteria. Lancet Neurol 2018;17:162–73 doi:10.1016/S1474-4422(17)30470-2 pmid:29275977
    CrossRefPubMed
  18. 18.↵
    1. Langdon DW,
    2. Amato MP,
    3. Boringa J, et al
    . Recommendations for a Brief International Cognitive Assessment for Multiple Sclerosis (BICAMS). Mult Scler 2012;18:891–98 doi:10.1177/1352458511431076 pmid:22190573
    CrossRefPubMed
  19. 19.↵
    1. Benedict RH,
    2. Amato MP,
    3. Boringa J, et al
    . Brief International Cognitive Assessment for MS (BICAMS): international standards for validation. BMC Neurol 2012;12:55 doi:10.1186/1471-2377-12-55 pmid:22799620
    CrossRefPubMed
  20. 20.↵
    1. Fink F,
    2. Eling P,
    3. Rischkau E, et al
    . The association between California Verbal Learning Test performance and fibre impairment in multiple sclerosis: evidence from diffusion tensor imaging. Mult Scler 2010;16:332–41 doi:10.1177/1352458509356367 pmid:20150400
    CrossRefPubMed
  21. 21.↵
    1. Freitas S,
    2. Batista S,
    3. Afonso AC, et al
    . The Montreal Cognitive Assessment (MoCA) as a screening test for cognitive dysfunction in multiple sclerosis. Appl Neuropsychol Adult 2018;25:57–70 doi:10.1080/23279095.2016.1243108 pmid:27791389
    CrossRefPubMed
  22. 22.↵
    1. Kurtzke JF
    . Rating neurologic impairment in multiple sclerosis: an Expanded Disability Status Scale (EDSS). Neurology 1983;33:1444–52 doi:10.1212/wnl.33.11.1444 pmid:6685237
    Abstract/FREE Full Text
  23. 23.↵
    1. Gromisch ES,
    2. Dhari Z
    . Identifying early neuropsychological indicators of cognitive involvement in multiple sclerosis. Neuropsychiatr Dis Treat 2021;17:323–37 doi:10.2147/NDT.S256689 pmid:33574669
    CrossRefPubMed
  24. 24.↵
    1. Nelson F,
    2. Datta S,
    3. Garcia N, et al
    . Intracortical lesions by 3T magnetic resonance imaging and correlation with cognitive impairment in multiple sclerosis. Mult Scler 2011;17:1122–29 doi:10.1177/1352458511405561 pmid:21543552
    CrossRefPubMed
  25. 25.↵
    1. Cheng J,
    2. Shen D,
    3. Yap PT, et al
    . Single- and multiple-shell uniform sampling schemes for diffusion MRI using spherical codes. IEEE Trans Med Imaging 2018;37:185–99 doi:10.1109/TMI.2017.2756072 pmid:28952937
    CrossRefPubMed
  26. 26.↵
    1. Pierpaoli C,
    2. Walker L,
    3. Irfanoglu MO, et al
    . TORTOISE an integrated software package for processing of diffusion MRI data. In: Proceedings of the Annual Meeting of the International Society for Magnetic Resonance Medicine, Stockholm, Sweden. May 1–7, 2010
  27. 27.↵
    1. Irfanoglu MO,
    2. Modi P,
    3. Nayak A, et al
    . DR-BUDDI (Diffeomorphic Registration For Blip-Up Blip-Down Diffusion Imaging) method for correcting echo planar imaging distortions. Neuroimage 2015;106:284–99 doi:10.1016/j.neuroimage.2014.11.042 pmid:25433212
    CrossRefPubMed
  28. 28.↵
    1. Zhang H,
    2. Schneider T,
    3. Wheeler-Kingshott CA, et al
    . NODDI: practical in vivo neurite orientation dispersion and density imaging of the human brain. Neuroimage 2012;61:1000–16 doi:10.1016/j.neuroimage.2012.03.072 pmid:22484410
    CrossRefPubMed
  29. 29.↵
    1. Tournier JD,
    2. Smith R,
    3. Raffelt D, et al
    . MRtrix3: a fast, flexible and open software framework for medical image processing and visualisation. Neuroimage 2019;202:116137 doi:10.1016/j.neuroimage.2019.116137 pmid:31473352
    CrossRefPubMed
  30. 30.↵
    1. Smith RE,
    2. Tournier JD,
    3. Calamante F, et al
    . Anatomically-constrained tractography: improved diffusion MRI streamlines tractography through effective use of anatomical information. Neuroimage 2012;62:1924–38 doi:10.1016/j.neuroimage.2012.06.005 pmid:22705374
    CrossRefPubMed
  31. 31.↵
    1. Smith RE,
    2. Tournier JD,
    3. Calamante F, et al
    . SIFT: spherical-deconvolution informed filtering of tractograms. Neuroimage 2013;67:298–312 doi:10.1016/j.neuroimage.2012.11.049 pmid:23238430
    CrossRefPubMed
  32. 32.↵
    1. Granberg T,
    2. Fan Q,
    3. Treaba CA, et al
    . In vivo characterization of cortical and white matter neuroaxonal pathology in early multiple sclerosis. Brain 2017;140:2912–26 doi:10.1093/brain/awx247 pmid:29053798
    CrossRefPubMed
  33. 33.↵
    1. Hagiwara A,
    2. Kamagata K,
    3. Shimoji K, et al
    . White matter abnormalities in multiple sclerosis evaluated by quantitative synthetic MRI, diffusion tensor imaging, and neurite orientation dispersion and density imaging. AJNR Am J Neuroradiol 2019;40:1642–48 doi:10.3174/ajnr.A6209 pmid:31515218
    Abstract/FREE Full Text
  34. 34.↵
    1. De Santis S,
    2. Granberg T,
    3. Ouellette R, et al
    . Evidence of early microstructural white matter abnormalities in multiple sclerosis from multi-shell diffusion MRI. Neuroimage Clin 2019;22:101699 doi:10.1016/j.nicl.2019.101699 pmid:30739842
    CrossRefPubMed
  35. 35.↵
    1. Aung WY,
    2. Mar S,
    3. Benzinger TL
    . Diffusion tensor MRI as a biomarker in axonal and myelin damage. Imaging Med 2013;5:427–40 doi:10.2217/iim.13.49 pmid:24795779
    CrossRefPubMed
  36. 36.↵
    1. Nave KA
    . Myelination and support of axonal integrity by glia. Nature 2010;468:244–52 doi:10.1038/nature09614 pmid:21068833
    CrossRefPubMed
  37. 37.↵
    1. Trapp BD,
    2. Nave KA
    . Multiple sclerosis: an immune or neurodegenerative disorder? Annu Rev Neurosci 2008;31:247–69 doi:10.1146/annurev.neuro.30.051606.094313 pmid:18558855
    CrossRefPubMed
  38. 38.↵
    1. Yoshino M,
    2. Saito K,
    3. Kawasaki K, et al
    . The origin and development of subcortical U-fibers in gyrencephalic ferrets. Mol Brain 2020;13:37 doi:10.1186/s13041-020-00575-8 pmid:32156301
    CrossRefPubMed
  39. 39.↵
    1. Grussu F,
    2. Schneider T,
    3. Tur C, et al
    . Neurite dispersion: a new marker of multiple sclerosis spinal cord pathology? Ann Clin Transl Neurol 2017;4:663–79 doi:10.1002/acn3.445 pmid:28904988
    CrossRefPubMed
  40. 40.↵
    1. Miki Y,
    2. Grossman RI,
    3. Udupa JK, et al
    . Isolated U-fiber involvement in MS: preliminary observations. Neurology 1998;50:1301–06 doi:10.1212/wnl.50.5.1301 pmid:9595978
    Abstract/FREE Full Text
  41. 41.↵
    1. Peterson JW,
    2. Bo L,
    3. Mork S, et al
    . Transected neurites, apoptotic neurons, and reduced inflammation in cortical multiple sclerosis lesions. Ann Neurol 2001;50:389–400 doi:10.1002/ana.1123 pmid:11558796
    CrossRefPubMed
  42. 42.↵
    1. Mainero C,
    2. Benner T,
    3. Radding A, et al
    . In vivo imaging of cortical pathology in multiple sclerosis using ultra-high field MRI. Neurology 2009;73:941–48 doi:10.1212/WNL.0b013e3181b64bf7 pmid:19641168
    Abstract/FREE Full Text
  43. 43.↵
    1. Beck ES,
    2. Sati P,
    3. Sethi V, et al
    . Improved visualization of cortical lesions in multiple sclerosis using 7T MP2RAGE. AJNR Am J Neuroradiol 2018;39:459–66 doi:10.3174/ajnr.A5534 pmid:29439120
    Abstract/FREE Full Text
  • Received August 20, 2021.
  • Accepted after revision December 11, 2021.
  • © 2022 by American Journal of Neuroradiology
PreviousNext
Back to top

In this issue

American Journal of Neuroradiology: 43 (3)
American Journal of Neuroradiology
Vol. 43, Issue 3
1 Mar 2022
  • Table of Contents
  • Index by author
  • Complete Issue (PDF)
Advertisement
Print
Download PDF
Email Article

Thank you for your interest in spreading the word on American Journal of Neuroradiology.

NOTE: We only request your email address so that the person you are recommending the page to knows that you wanted them to see it, and that it is not junk mail. We do not capture any email address.

Enter multiple addresses on separate lines or separate them with commas.
Short-Range Structural Connections Are More Severely Damaged in Early-Stage MS
(Your Name) has sent you a message from American Journal of Neuroradiology
(Your Name) thought you would like to see the American Journal of Neuroradiology web site.
CAPTCHA
This question is for testing whether or not you are a human visitor and to prevent automated spam submissions.
Cite this article
H. Wu, C. Sun, X. Huang, R. Wei, Z. Li, D. Ke, R. Bai, H. Liang
Short-Range Structural Connections Are More Severely Damaged in Early-Stage MS
American Journal of Neuroradiology Mar 2022, 43 (3) 361-367; DOI: 10.3174/ajnr.A7425

Citation Manager Formats

  • BibTeX
  • Bookends
  • EasyBib
  • EndNote (tagged)
  • EndNote 8 (xml)
  • Medlars
  • Mendeley
  • Papers
  • RefWorks Tagged
  • Ref Manager
  • RIS
  • Zotero
0 Responses
Respond to this article
Share
Bookmark this article
Short-Range Structural Connections Are More Severely Damaged in Early-Stage MS
H. Wu, C. Sun, X. Huang, R. Wei, Z. Li, D. Ke, R. Bai, H. Liang
American Journal of Neuroradiology Mar 2022, 43 (3) 361-367; DOI: 10.3174/ajnr.A7425
del.icio.us logo Twitter logo Facebook logo Mendeley logo
  • Tweet Widget
  • Facebook Like
  • Google Plus One
Purchase

Jump to section

  • Article
    • Abstract
    • ABBREVIATIONS:
    • MATERIALS AND METHODS
    • RESULTS
    • DISCUSSION
    • CONCLUSIONS
    • Footnotes
    • References
  • Figures & Data
  • Supplemental
  • Info & Metrics
  • Responses
  • References
  • PDF

Related Articles

  • PubMed
  • Google Scholar

Cited By...

  • In search of a unifying theory of white matter aging: improving the understanding of tract-wise degeneration using multi-parametric signatures of morphometry and microstructure
  • Crossref (6)
  • Google Scholar

This article has been cited by the following articles in journals that are participating in Crossref Cited-by Linking.

  • Neurite Orientation Dispersion and Density Imaging in Multiple Sclerosis: A Systematic Review
    Homa Seyedmirzaei, Fardin Nabizadeh, Mohammad Hadi Aarabi, Lorenzo Pini
    Journal of Magnetic Resonance Imaging 2023 58 4
  • Distinct subdivisions of subcortical U-fiber regions in the gyrencephalic ferret brain
    Mayuko Yoshino, Yoshitake Shiraishi, Kengo Saito, Narufumi Kameya, Toshihide Hamabe-Horiike, Yohei Shinmyo, Mitsutoshi Nakada, Noriyuki Ozaki, Hiroshi Kawasaki
    Neuroscience Research 2024 200
  • The different damage patterns of short-, middle- and long-range connections between patients with relapse-remitting multiple sclerosis and neuromyelitis optica spectrum disorder
    Xiaoya Chen, Yuling Peng, Qiao Zheng, Dan Luo, Yongliang Han, Qi Luo, Qiyuan Zhu, Tianyou Luo, Yongmei Li
    Frontiers in Immunology 2022 13
  • Association of Peak Width of Skeletonized Mean Diffusivity With Neurofilament Light Chain in Non‐Dementia Adults
    Rui‐Ping Cui, He‐Ying Hu, Shuang‐Ling Han, Shu‐Yu Liang, Min Liu, Pei‐Yang Gao, Yan‐Ming Chen, Yu‐Dong Wang, Fan Guo, Rong‐ji Xue, Meng‐Shan Tan, Hao Hu, Lan Tan
    Journal of Neurochemistry 2025 169 5
  • Regional brain function study in patients with primary Sjögren’s syndrome
    Chunfeng Hu, Luoyu Wang, Jiao Huang, Yushan Shang, Xiaofang Zhang, Xinyun Du, Huijun Cao, Zhijiang Han, Peiying Wei
    Arthritis Research & Therapy 2025 27 1
  • Uncovering patterns of white matter degeneration in normal aging: Links between morphometry and microstructure
    Tyler D. Robinson, Yutong L. Sun, Paul T.H. Chang, J. Jean Chen
    Imaging Neuroscience 2024 2

More in this TOC Section

Adult Brain

  • Diagnostic Neuroradiology of Monoclonal Antibodies
  • Cerebral ADC Changes in Fabry Disease
  • ML for Glioma Molecular Subtype Prediction
Show more Adult Brain

Functional

  • Kurtosis and Epileptogenic Tubers: A Pilot Study
  • Glutaric Aciduria Type 1: DK vs. Conventional MRI
  • Multiparametric MRI in PEDS Pontine Glioma
Show more Functional

Similar Articles

Advertisement

Indexed Content

  • Current Issue
  • Accepted Manuscripts
  • Article Preview
  • Past Issues
  • Editorials
  • Editor's Choice
  • Fellows' Journal Club
  • Letters to the Editor
  • Video Articles

Cases

  • Case Collection
  • Archive - Case of the Week
  • Archive - Case of the Month
  • Archive - Classic Case

More from AJNR

  • Trainee Corner
  • Imaging Protocols
  • MRI Safety Corner

Multimedia

  • AJNR Podcasts
  • AJNR Scantastics

Resources

  • Turnaround Time
  • Submit a Manuscript
  • Submit a Video Article
  • Submit an eLetter to the Editor/Response
  • Manuscript Submission Guidelines
  • Statistical Tips
  • Fast Publishing of Accepted Manuscripts
  • Graphical Abstract Preparation
  • Imaging Protocol Submission
  • Evidence-Based Medicine Level Guide
  • Publishing Checklists
  • Author Policies
  • Become a Reviewer/Academy of Reviewers
  • News and Updates

About Us

  • About AJNR
  • Editorial Board
  • Editorial Board Alumni
  • Alerts
  • Permissions
  • Not an AJNR Subscriber? Join Now
  • Advertise with Us
  • Librarian Resources
  • Feedback
  • Terms and Conditions
  • AJNR Editorial Board Alumni

American Society of Neuroradiology

  • Not an ASNR Member? Join Now

© 2025 by the American Society of Neuroradiology All rights, including for text and data mining, AI training, and similar technologies, are reserved.
Print ISSN: 0195-6108 Online ISSN: 1936-959X

Powered by HighWire