
Abstract
BACKGROUND AND PURPOSE: Perivascular spaces surround the blood vessels of the brain and are involved in neuroimmune functions and clearance of metabolites via the glymphatic system of the brain. Enlarged perivascular spaces could be a marker of dysfunction in these processes and, therefore, are highly relevant to monitoring disease activity in MS. This study aimed to compare the number of enlarged perivascular spaces in people with relapsing MS with MR imaging markers of inflammation and brain atrophy.
MATERIALS AND METHODS: Fifty-nine patients (18 with clinically isolated syndrome, 22 with early and 19 with late relapsing-remitting MS) were scanned longitudinally (mean follow-up duration = 19.6 [SD, 0.5] months) using T2-weighted, T1-weighted, and FLAIR MR imaging. Two expert raters identified and counted enlarged perivascular spaces on T2-weighted MR images from 3 ROIs (the centrum semiovale, basal ganglia, and midbrain). Baseline and change with time in the number of enlarged perivascular spaces were correlated with demographics and lesion and brain volumes.
RESULTS: Late relapsing-remitting MS had a greater average number of enlarged perivascular spaces at baseline at the level of the basal ganglia (72.3) compared with early relapsing-remitting MS (60.5) and clinically isolated syndrome (54.7) (F = 3.4, P = .042), and this finding correlated with lesion volume (R = 0.44, P = .0004) but not brain atrophy (R = −0.16). Enlarged perivascular spaces increased in number with time in all regions, and the rate of increase did not differ among clinical groups.
CONCLUSIONS: Enlarged perivascular spaces at the level of the basal ganglia are associated with greater neuroinflammatory burden, and the rate of enlargement appears constant in patients with relapsing-remitting disease phenotypes.
ABBREVIATIONS:
- BPF
- brain parenchymal fraction
- CIS
- clinically isolated syndromes
- EDSS
- Expanded Disability Status Scale
- ePVS
- enlarged perivascular spaces
- PVS
- perivascular spaces
- RRMS
- relapsing-remitting MS
MS is a chronic autoimmune-mediated neuroinflammatory condition associated with neurodegeneration and progressive neurologic disability. The disease course is highly heterogeneous, likely relating to genetic, lifestyle, and treatment variations. There is currently a search for biologic markers for pathophysiologic changes in the brain that are associated with poorer relapse recovery and more rapid disease progression. Such markers will be useful as outcome measures in treatment trials and for patient monitoring and prognostication.
Perivascular spaces (PVS), also known as Virchow-Robin spaces, are pial-lined, fluid-filled structures that ensheathe vessels entering (penetrating arteries) or leaving (draining veins) brain tissue.1,2 Due to the extensive vascularity of the brain, PVS occupy a significant proportion of the cerebral volume. Normally, they are visible on MR imaging in 3 characteristic locations: 1) the centrum semiovale penetrating the subcortical white matter, 2) surrounding lenticulostriate arteries entering the basal ganglia, and 3) the midbrain.3 Because PVS are small and usually difficult to identify on clinical MR imaging due to limitations in spatial resolution, increased numbers of PVS are commonly considered to reflect enlargement of the PVS. Previously, enlarged PVS (ePVS) were radiologically classed as incidental findings without pathologic significance4 or merely related to aging5⇓-7 but, more recently, have been posited as pathologic markers in the context of cerebral vascular disease and dementia,4,8⇓-10 More specifically, dilation of the PVS could indicate perivascular inflammation11 or impaired waste clearance to the glial-lymphatic system.12,13
There has been significant interest in exploring ePVS in people with MS, as well as correlations between ePVS and other disease features to better understand what drives ePVS in MS. Previous studies in MS have demonstrated that increased numbers of MR imaging–visible PVS indicative of ePVS are associated with the onset of disease,14 new lesions,11,15 clinical disability,16,17 and atrophy.18 While the relationship between ePVS and lesion load suggests that ePVS are associated with neuroinflammatory burden, the relationship between ePVS and atrophy could merely reflect contraction of the brain parenchyma associated with cerebral atrophy, similar to sulcal and ventricular enlargement. Therefore, this study aimed to evaluate the following: 1) the radiologic disease features (neuroinflammation and/or brain atrophy) that best correlate with the number of ePVS, 2) the rate at which ePVS appear with time, and 3) potential differences in the number of ePVS in different relapsing-remitting disease phenotypes (clinically isolated syndromes [CIS] and early/late relapsing-remitting MS [RRMS]). On the basis of the hypothesis that ePVS are associated with inflammatory burden rather than parenchymal retraction, we expected that the number of ePVS would be positively associated with lesion load (commensurate with increased inflammatory activity) but not atrophy (commensurate with parenchymal retraction). We also expected that ePVS would increase in number with time, and that the number of ePVS gained across time would be associated with the increase in lesion volume. Finally, we expected that ePVS would be more prevalent in subjects at more advanced disease stages.
MATERIALS AND METHODS
Subjects and Clinical Assessments
Fifty-nine patients were recruited to the study and underwent clinical MR imaging sessions as part of their routine clinical care from December 2010 to October 2014. Patients were categorized into 3 groups based on clinical diagnostic criteria19 and disease duration at baseline: 1) CIS (n = 18; mean age = 34.1 [SD, 7.5] years; 14 women/4 men); 2) early RRMS (disease duration <5 years; n = 22; mean age = 38.6 [SD, 9.6] years; 19 women/3 men); and 3) late RRMS (disease duration >5 years; n = 19; mean age = 49.2 [SD, 9.8] years; 18 women/1 man). Four patients with CIS converted to RRMS during follow-up. In Australia, people with MS are entitled to an annual monitoring MR imaging scan that is government funded. Many patients, thus, underwent serial scanning during the study, with 14 patients (5 with CIS and 5 with early and 4 with late RRMS) having 3 scanning sessions; 26 patients (7 with CIS and 10 with early and 9 with late RRMS) having 2 scanning sessions; and the remaining 19 patients (6 with CIS and 7 with early and 6 with late RRMS) having 1 scanning session available for analysis. The mean follow-up time for all patients with serial scans was 19.6 (SD, 0.5) months, irrespective of the number of scans. In addition to MR imaging, patients underwent a standard neurologic examination by a consultant neurologist (O.W.) for calculation of the Expanded Disability Status Scale (EDSS). All subjects provided voluntary written consent, and the study was approved by the Human Research Ethics Committee of the Royal Melbourne Hospital, Australia.
MR Imaging Acquisition
Subjects were scanned using a 3T MR imaging scanner (Tim Trio; Siemens), with a body transmit coil and a 12-channel head-receive coil providing full brain coverage. Scans included the following: axial 2D fast spin-echo T2-weighted imaging (TR/TE = 4700/157 ms; flip angle = 120°; in-plane voxel dimensions = 0.7 × 0.7 mm2; section thickness = 5mm); 2D axial FLASH T1-weighted imaging (TR/TE = 250/2.46 ms; flip angle = 70°; in-plane voxel dimensions = 0.43×0.43 mm2; section thickness = 5 mm) after a single-dose intravenous gadolinium injection; and sagittal acquired 3D FLAIR imaging (TR/TE/TI = 5000/350/1800 ms; flip angle = 120°; voxel dimensions = 0.5 × 0.5× 1 mm3).
Perivascular Space Quantification
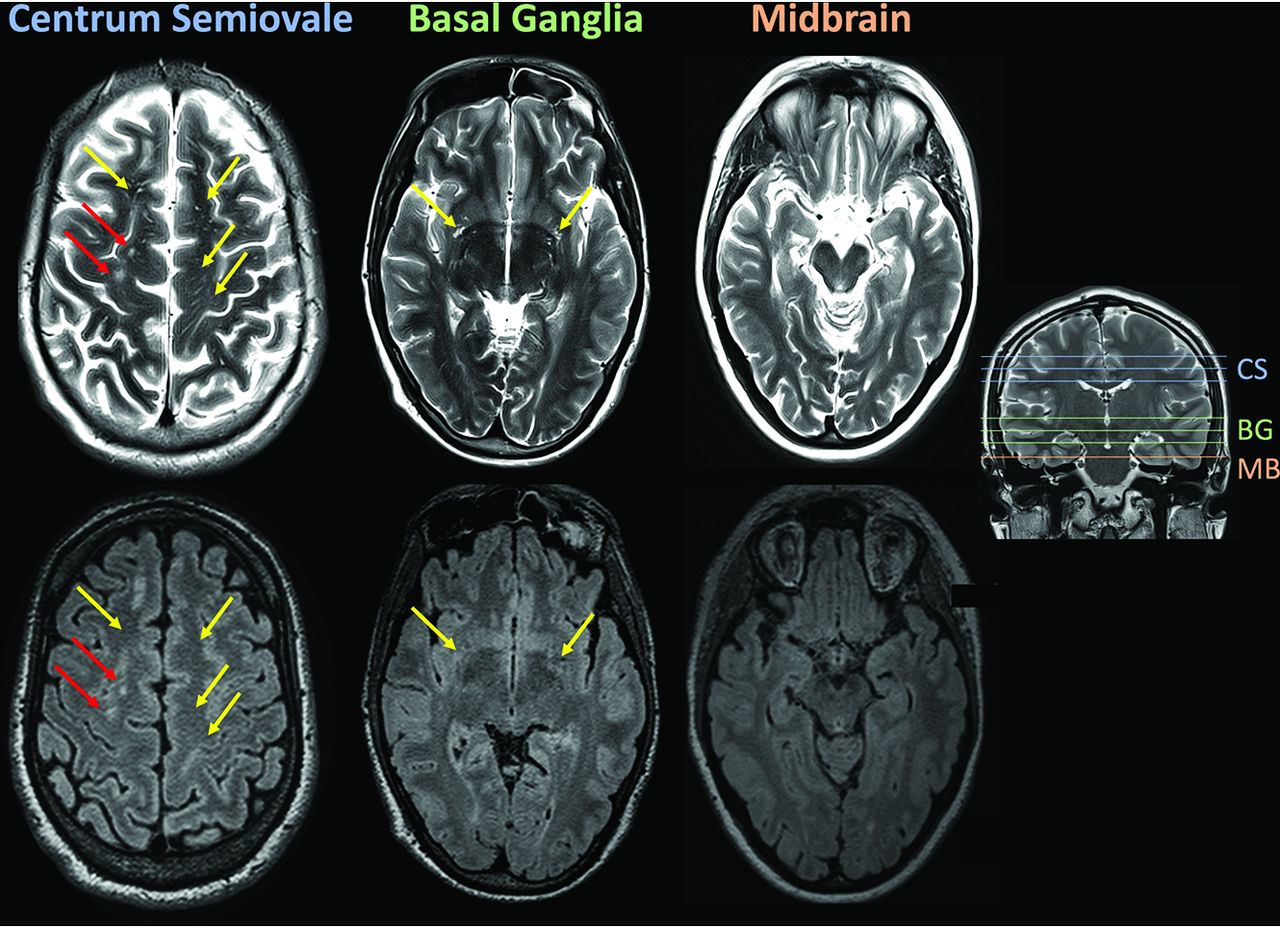
All available T2 scans were anonymized (both within and across subjects), and the number of PVS was quantified manually by a neuroradiologist (L.M.G.) from 3 brain regions proposed by Potter et al:3 the centrum semiovale (3 slices), basal ganglia (3 slices), and midbrain (1 section) (see Fig 1 for examples of identification of ePVS). The number of ePVS reported included all ePVS summed across slices because we were not able to determine which ePVS were unique across slices. T2 scans were presented alongside corresponding slices on the FLAIR image (reformatted to the same resolution as T2), and putative perivascular spaces were checked against FLAIR to ensure that there was no FLAIR hyperintensity indicating a lesion rather than ePVS.

Scans from a sample patient data set illustrating the 3 regions of the brain that were selected for counting ePVS: the centrum semiovale (CS), basal ganglia (BG), and midbrain (MB). PVS were counted if they were evident on T2 (upper row) but absent on FLAIR (lower row) (yellow arrows). Lesions (red arrows) were identified as hyperintensities on both T2 and FLAIR.
Thirty random subjects were also assessed by a second rater (N.Y.) for calculation of interrater reliability. The intraclass correlation between the total number of ePVS detected for the 2 raters from the 30 subjects was 0.83.
Lesion and Brain Volume Quantification
Brain and lesion volumes were calculated from 3D FLAIR scans using a fully automated analysis pipeline. For each subject, a brain mask was calculated using the SPM12 segmentation algorithm (http://www.fil.ion.ucl.ac.uk/spm/software/spm12). GM and WM are output as 2 segmentation classes by the algorithm but were added together to calculate total brain volume because gray and white matter were not reliably segmented on FLAIR. The CSF class was added to the brain mask to make an intracranial mask with which to calculate the brain parenchymal fraction (BPF). Lesions were automatically segmented using the Lesion Prediction Algorithm contained within the Lesion Segmentation Tool for SPM12. Lesion masks were generated from the Lesion Prediction Algorithm output and then were used for inpainting the brain masks. From these masks, the we calculated the following: intracranial volume, lesion volume, and brain volume. For further statistical analyses, lesion and brain volumes were normalized to intracranial volume by division and expressed as BPF and lesion fraction.
Statistical Analyses
The number of ePVS or rate of change in the number of ePVS was compared between CIS and early and late RRMS groups using 1-way ANOVA (for normally distributed data) with Tukey post hoc tests or Kruskal-Wallis nonparametric tests (for non-normally distributed data). The correlation between the number of ePVS and FLAIR lesion load, single digit modalities test (SDMT), age, and BPF was calculated using Pearson parametric correlation analysis, and the correlation between the number of ePVS and the EDSS was calculated using the Spearman rank correlation. For lesion volume, the distribution was transformed using a log10 operation (Matlab; MathWorks), which resulted in a normal distribution (tested against the standard normal distribution using the Kolmogorov-Smirnov test, P = .98). When significant correlations were identified, multiple linear regression was used to determine whether the relationships with the number of ePVS were independent. To determine whether longitudinal changes in the number of ePVS were statistically significant, we first used linear regression to calculate the annualized change (regression slope for number versus time) in ePVS for each patient with longitudinal scans. Annualized change was then analyzed using single-sample t tests with the null hypothesis of zero change.
RESULTS
Patient Cohort Description
Summary demographic and disease information for the patients can be found in the Online Supplemental Data. Additionally, only 7/59 patients (CIS, n = 3; early RRMS, n = 3; late RRMS, n = 1) showed any contrast-enhancing lesions on gadolinium+ FLASH scans (a marker of acute rather than historical inflammatory burden). All except 1 of these patients had only 1 gadolinium+ lesion, with a single patient with CIS having 4 gadolinium+ lesions that were not evident in follow-up scans.
Regional Differences in ePVS among Groups at Baseline
The number of ePVS was significantly different among MS clinical phenotypes only at the level of the basal ganglia (CIS, mean = 54.7 [SD, 17.9]; early RRMS, mean = 60.5 [SD, 17.1]; late RRMS, mean = 72.3 [SD, 27.2]; F[2, 56] = 3.4, P = .042) (Online Supplemental Data and Fig 2). Post hoc pair-wise tests revealed a significant difference between the CIS and late RRMS groups (mean difference = +17.5; 95% CI, 0.9–34.2; P(Tukey adjusted) = 0.037). The average number of ePVS for all patients differed strongly across the 3 regions studied, with the greatest number of ePVS in the centrum semiovale (74.0 [SD, 26.7]) followed by the basal ganglia (62.5 [SD, 21.9]), with the midbrain containing, on average, <4% of the total ePVS counted (5.6 [SD, 2.9]).

Baseline number of ePVS for CIS and early and late RRMS at the level of centrum semiovale (A), basal ganglia (B), and midbrain (C). The number of ePVS at the level of the basal ganglia were greater in patients in late RRMS than in those with CIS. The asterisk indicates P < 0.05.
Correlations between the Number of ePVS and Markers of Inflammation and Neurodegeneration
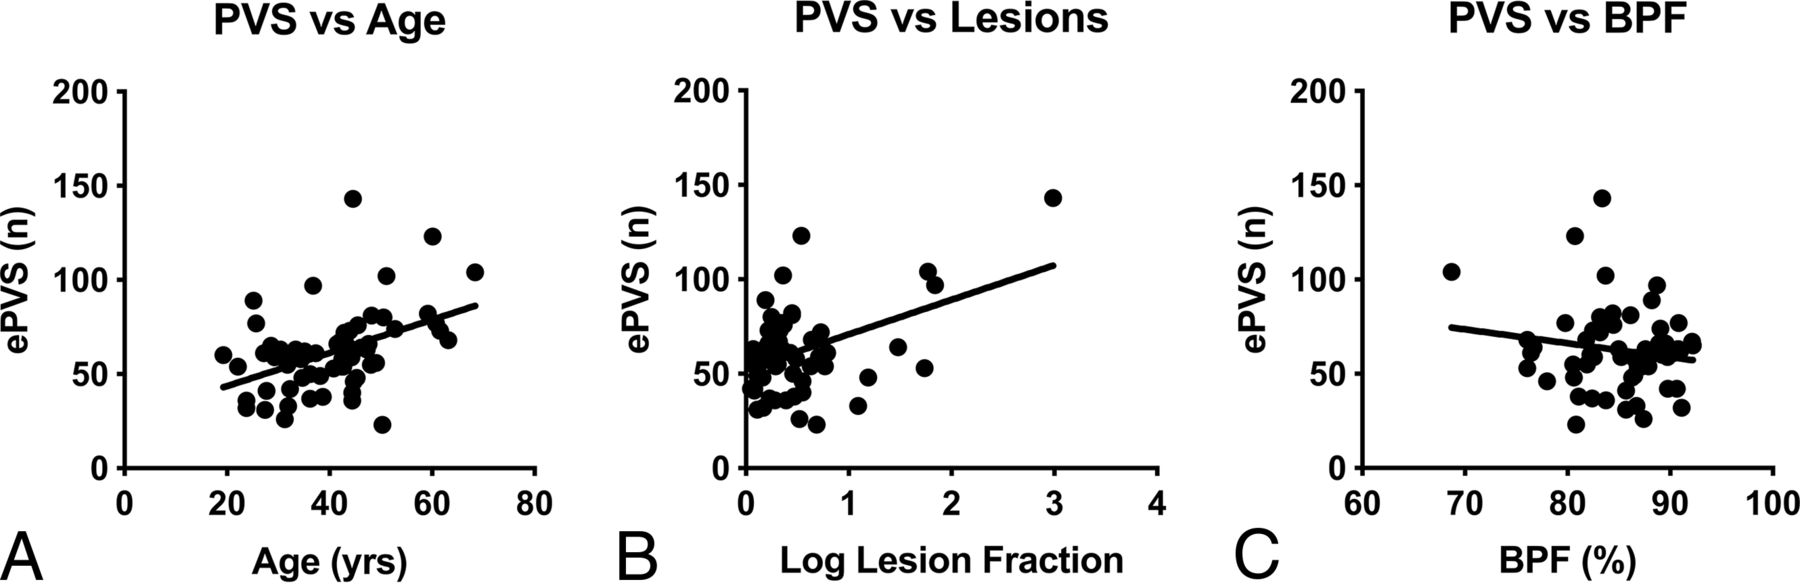
Given that number of ePVS showed a significant group effect for the basal ganglia only, we chose to focus on this region specifically for correlation analyses. The number of ePVS in the basal ganglia correlated significantly with age (R = 0.44, P < .001) and logarithmically transformed FLAIR lesion volume (R = 0.34, P = .008) (Fig 3). Multiple linear regression showed that age and lesion volume were independently associated with the number of ePVS in the basal ganglia (total model R2 = 0.57, P < .001): Each additional year of life was associated with an additional 0.73 enlarged perivascular space (95% CI, 0.27–1.18; P = .002), and each additional percentage of brain being classified as lesion was associated with an additional 15.35 ePVS (95% CI, 6.13–24.58; P = .002).

Scatterplots showing significant correlations between the number of ePVS at the level of the basal ganglia and age (A) and lesion volume (B) as a fraction of intracranial volume. C, BPF did not significantly correlate with the number of ePVS at the level of the basal ganglia.
The number of ePVS in the basal ganglia did not correlate with disease duration (R = 0.24), BPF (R = −0.16), or EDSS (ρ = 0.17), so these variables were not included in multivariate modeling.
Longitudinal Change in ePVS
Across all patients, the number of ePVS detected significantly increased in the centrum semiovale (mean change = +4.1 [SD, 8.8] ePVS/year, t(single sample) = 2.8, P = .008), with a near-significant trend toward an increase in the basal ganglia (mean change = +2.3 [SD, 6.8] ePVS/year, t(single sample) = 2.0, P = .054), but no change in the midbrain (mean change = +0.3 [SD, 1.4] ePVS/year, t(single sample) = 1.47, P = .15). Among MS phenotypes, there were no significant differences in the rate of change in the number of ePVS (Online Supplemental Data and Fig 4).

There were no significant differences between MS phenotypes in the annualized rate of change in the number of ePVS at the level of centrum semiovale (A), basal ganglia (B), and midbrain (C).
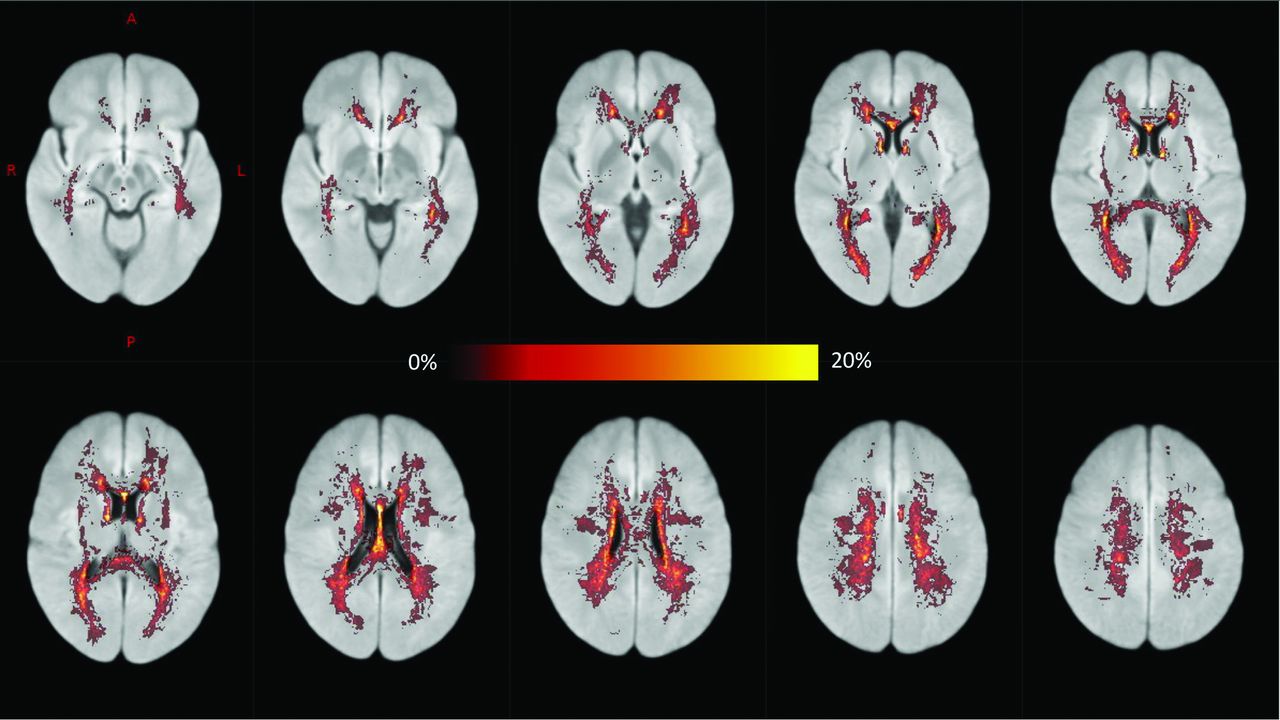
The rate of change in ePVS in the midbrain was associated with change in whole-brain lesion volume (R = 0.44, P = .008). However, across the patient group as a whole, new FLAIR lesions most commonly appeared in the periventricular WM and centrum semiovale (Fig 5). We did not detect any other correlations between ePVS change and the appearance of contrast-enhancing lesions or change in the BPF or EDSS.

A voxelwise map showing the proportion of patients exhibiting new FLAIR hyperintensities (new lesions or lesion enlargement) during MR imaging follow-up after registration to Montreal Neurological Institute standard space (ie, a value of 20% indicates that 20% of patients developed new hyperintensities in that voxel). New lesions most commonly appeared in the periventricular WM and centrum semiovale.
DISCUSSION
Enlarged PVS have been observed in the context of inflammatory neurodegenerative disorders like MS. Enlarged PVS are believed to be associated with blood-brain barrier leakage and associated infiltration of monocytes, lymphocytes, and macrophages in the PVS, in addition to trafficking of toxic metabolites, myelin debris, and other byproducts of neurodegeneration.20 Thus, there is significant interest in the development of neuroimaging markers that can detect and track the formation of ePVS for monitoring these nefarious secondary consequences of neuroinflammation. Here, we investigated the number of ePVS in people with MS (pwMS) and compared their incidence across relapsing-remitting disease phenotypes and across time. We found that the number of visible PVS in the basal ganglia was larger in later disease stages and was associated with older age and a larger volume of FLAIR lesions. With time, the number of PVS in the centrum semiovale increased, yet there was no significant different in rates among clinical phenotypes.
A recent meta-analysis21 evaluated 9 studies11,14,16⇓-18,22⇓⇓-25 of ePVS in MS. The results of our study are partially in agreement with previous findings. First, the meta-analysis reported that people with MS exhibited greater prevalence, counts, and volume of ePVS compared with healthy individuals. However, in contrast to our findings, previous studies have identified correlations between ePVS and clinical disease severity11,16,18,23 and cognitive function.16 The lack of correlation with clinical disease severity could reflect a bias in our sample toward patients at the lower end of the disability spectrum (median EDSS = 0; range, 0–4.5), despite some patients having long-standing disease (maximum disease duration = 31 years). Similar to findings in 1 previous study, our study identified a significant correlation between ePVS and age.18 We interpret this result to indicate that aging rather than time living with MS contributes more to enlargement of the PVS.
We observed a significant correlation between ePVS counts and FLAIR but not contrast-enhancing lesion load. This result suggests that ePVS might be more associated with historical rather than acute inflammatory burden. However, patients in this study were all receiving ongoing disease-modifying therapies, and we detected only a small number of enhancing lesions in patients during the study, with most at baseline, so the cohort was not well-suited to studying active inflammation.
Wuerfel et al11 performed monthly imaging follow-up of 18 patients and showed that PVS volumes and counts increased in time points at which contrast-enhancing lesions were detected. Our longitudinal analysis involved less frequent imaging (roughly annual scanning in line with routine clinical monitoring) and did detect significant increases in the number of ePVS in the centrum semiovale. We did not detect many concomitant contrast-enhancing lesions, possibly explained by 2 factors: efficacious treatment (people diagnosed with MS in Australia are entitled to receive high-efficacy monoclonal antibody therapies after diagnosis) and the transiency of contrast enhancement. Therefore, we calculated the change in FLAIR lesion volume during the time period concurrent with PVS quantification as a marker of new inflammatory activity. We detected a significant correlation between the number of new ePVS in the midbrain and lesion-volume change. It is unclear why this region specifically might be affected. However, it is conceivable that inflammatory infiltrates and other metabolic and proteinaceous waste products might build up in more distal PVS channels. Indeed, significant differences in ePVS among disease phenotypes were observed only at the level of the basal ganglia, with patients with later-stage RRMS having significantly more ePVS than those with CIS or early RRMS. The PVS at the level of the basal ganglia are most likely fed by smaller PVS channels originating in deep GM structures such as the striatum and thalamus, which, by virtue of their widespread and long-range axonal connectivity, are confluently affected by multifocal WM lesions in MS.26
We did not detect any correlation between ePVS number and BPF. This finding is consistent with the results of most studies comparing ePVS and brain volume in MS.11,16,17,23,24 Taken together with the results of the present article, we would contend that ePVS in MS are not merely a product of brain parenchymal retraction associated with cerebral atrophy. However, 1 previous study using 7T MR imaging did find a significant correlation between ePVS and brain volume, but, in conflict with our results, not lesion load.18 This finding could reflect differences in the patient group studied: Patients studied here were relatively free of disability (mean EDSS = 0.53), whereas patients in the previous study had a higher median EDSS of 4, and 12/34 patients had progressive phenotypes. Another possibility is that the increased resolution afforded by 7T imaging (0.8 mm isotropic) in that study could have improved quantification of PVS.
Limitations and Future Directions
Several features of this study limit our interpretations. First, PVS were manually counted from slices on 2D MR imaging. Interrater reliability for this study was reasonable (intraclass correlation = 0.83); however, future studies should ideally use 3D acquisitions and take advantage of recently developed algorithms based on image processing27,28 or machine learning29 that allow the automated quantification of the number of PVS and volume from 3D MR imaging. Also, the use of 3D scans of sufficient resolution could allow the tracking of individual ePVS across time to identify which channels of PVS are enlarging and the rate of enlargement. Second, it was not possible using our method to comprehend the connectivity of regional channels of PVS to focal inflammatory lesions due to the limitations of scan resolution. Future studies using high-resolution 3D MR imaging should focus on developing an atlas of the PVS network to act as a template for comparison with focal pathology. Thus, it might be possible to better understand the causative relationships between inflammation and ePVS. Third, chronic MS lesions may appear as ovoid CSF-filled lesions in the periventricular and juxtacortical WM. As with the other vascular and inflammatory insults, MS plaques are generally distinguished from PVS by surrounding hyperintense T2/FLAIR signal and clinical history; however, it is possible that in severely degenerative lesions, fluid within the lesion core could lead to FLAIR signal attenuation that mimics an enlarged perivascular space. Finally, here we did not investigate the number of ePVS in progressive disease phenotypes, limiting the generalizability of our results. However, our hypothesis was that ePVS are associated with inflammatory aspects of MS; given that inflammatory relapses and the appearance of new lesions occur at a lower rate in progressive disease phenotypes, we expect that the relevance of ePVS in progressive disease phenotypes is limited.
CONCLUSIONS
Here, we showed that the number of ePVS in people with MS is associated with the degree of historical inflammatory burden rather than brain atrophy, indicating that ePVS are likely to be associated with neuroimmune dysfunction. The rate of ePVS accumulation showed a trend toward increasing in later disease stages, which could indicate chronic neuroinflammatory processes. This issue requires further study in a larger cohort including patients in a later stage.
Acknowledgments
We thank the participants in the research for their time. We would also like to thank Bayer Australia for providing the financial support for this study. We acknowledge the traditional owners of the land on which this research took place, the Wurundjeri people of the Kulin nation, and pay our respects to elders past, present, and emerging.
Footnotes
Disclosures: Scott C. Kolbe—UNRELATED: Grants/Grants Pending: Biogen Australia, Comments: I have been awarded research funding from Biogen Australia*; Payment for Lectures Including Service on Speakers Bureaus: Biogen, Merck, Comments: I have received speaker honoraria from Biogen and Merck. Meaghan Clough—UNRELATED: Employment: Sanofi Genzyme*; Anneke van der Walt—UNRELATED: Consultancy: Roche, Novartis, Merck, Comments: I served on scientific advisory boards; Grants/Grants Pending: Roche, Novartis, Biogen, Merck, Comments: Unrestricted research grants*; Payment for Lectures Including Service on Speakers Bureaus: Roche, Novartis, Biogen, Merck. Helmut Butzkueven—RELATED: Grant: Monash University, Comments: Academic start-up funding*; UNRELATED: Board Membership: Biogen, Merck, Novartis, Comments: Steering Committee fees*; Consultancy: Biogen, Roche, Novartis, Merck, Comments: Advisory Board fees*; Grants/Grants Pending: Biogen, Roche, Novartis, Merck, Comments: research grants to the institution*; Payment for Lectures Including Service on Speakers Bureaus: Biogen, Roche, Novartis, Merck. *Money paid to the institution.
References
- Received April 13, 2021.
- Accepted after revision October 19, 2021.
- © 2022 by American Journal of Neuroradiology


