
Abstract
BACKGROUND AND PURPOSE: Malignant glioma is a highly infiltrative malignancy that causes variable disruptions to the structure and function of the cerebrovasculature. While many of these structural disruptions have known correlative histopathologic alterations, the mechanisms underlying vascular dysfunction identified by resting-state blood oxygen level–dependent imaging are not yet known. The purpose of this study was to characterize the alterations that correlate with a blood oxygen level–dependent biomarker of vascular dysregulation.
Materials and Methods: Thirty-two stereotactically localized biopsies were obtained from contrast-enhancing (n = 16) and nonenhancing (n = 16) regions during open surgical resection of malignant glioma in 17 patients. Preoperative resting-state blood oxygen level–dependent fMRI was used to evaluate the relationships between radiographic and histopathologic characteristics. Signal intensity for a blood oxygen level–dependent biomarker was compared with scores of tumor infiltration and microvascular proliferation as well as total cell and neuronal density.
Results: Biopsies corresponded to a range of blood oxygen level–dependent signals, ranging from relatively normal (z = −4.79) to markedly abnormal (z = 8.84). Total cell density was directly related to blood oxygen level–dependent signal abnormality (P = .013, R2 = 0.19), while the neuronal labeling index was inversely related to blood oxygen level–dependent signal abnormality (P = .016, R2 = 0.21). The blood oxygen level–dependent signal abnormality was also related to tumor infiltration (P = .014) and microvascular proliferation (P = .045).
Conclusions: The relationship between local, neoplastic characteristics and a blood oxygen level–dependent biomarker of vascular function suggests that local effects of glioma cell infiltration contribute to vascular dysregulation.
ABBREVIATIONS:
- BOLD
- blood oxygen level–dependent
- CE
- contrast-enhancing
- Gd
- gadolinium
- NE
- nonenhancing
Malignant glioma is a highly infiltrative malignancy that causes variable disruptions to the structure and function of the cerebrovasculature.1 Most prominent among these is a breakdown of the blood-brain barrier, associated with the main tumor mass1⇓–3 and clinically evident through the extravasation of gadolinium-conjugated contrast media.4 However, other vascular deficits are identifiable in the infiltrative margin of the tumor. Vasogenic edema, represented by T2-FLAIR hyperintensity, is the most frequently used abnormality for directing surgical and radiation treatments in nonenhancing (NE) areas. Recent application of functional imaging has identified additional physiologic consequences of malignant glioma infiltration, with decreased vascular reactivity noted on hypercapnia challenges5⇓–7 and reduced cortical activation intensity and volume using task-based fMRI.8⇓⇓–11 Tumor vessel angiogenesis is a frequently cited and plausible contributor to such deficits within the contrast-enhancing (CE) tumor mass.5,7,9,10 However, areas of decreased vascular reactivity and reduced cortical activation have also been identified in lower grade gliomas, indicating that even sparsely infiltrated regions of brain parenchyma could have similar functional impairment.5 Nevertheless, the variable presence, distribution, and degree of these abnormalities leave their relationship to tumor infiltration uncertain.
A recent report by Chow et al12 identified a biomarker of glioma-related vascular dysregulation using resting-state blood oxygen level–dependent (BOLD) fMRI. The mean BOLD time-series extracted from normal, tumor-free brain of the contralesional hemisphere represents normal cardiac pulsations and respiration-related changes in arterial carbon dioxide (CO2)13⇓–15 and can be used as a temporal signature of normal vascular reactivity.16 Similarly, the mean BOLD time-series extracted from CE tumor represents abnormal tumor-related vascular function. By combining these temporal signatures, the spatial extent of glioma-related vascular deficits can be illustrated by identifying voxels of NE brain parenchyma that behave more like the CE tumor and less like the normal contralesional brain tissue. This technique demonstrated that vascular dysregulation can extend beyond the CE tumor core into the NE infiltrative margin. Furthermore, the presence of nonoverlapping regions between the BOLD biomarker and T2-FLAIR hyperintensity, or BOLD-FLAIR mismatch, suggests discordance between deficits in neurovascular function and a breakdown of the blood-brain barrier. However, the absence of a histologic correlate in Chow et al12 leaves substantial uncertainty as to whether this vascular dysregulation is related directly to tumor infiltration or to the indirect effects of the tumor. For example, such dysfunction could be directly related to local tumor effects, such as a disruption in the structural, physical, or ultrastructural properties of the brain by invading glioma cells.11 Alternatively, distal, indirect causes, such as mass effect from the tumor or vasogenic edema; disruption of shared venous drainage; or damage to axons could also explain these BOLD abnormalities.8,12,17
The purpose of this study was to characterize the histopathologic alterations underlying the BOLD biomarker of vascular dysfunction in malignant gliomas. We compared BOLD dynamics from resting-state fMRI with neoplastic characteristics of a set of stereotactically localized biopsies. We hypothesized that the degree of disruption of vascular function measured by the BOLD biomarker is related to the severity of histopathologic abnormalities associated with tumor infiltration.
Materials and Methods
Patient Selection
We performed a retrospective review of a database of MRI-localized biopsies obtained during open surgical resection of glioma at Columbia University Medical Center (CUMC). All patients included in the database previously provided consent as part of a CUMC review board-approved study protocol. Seventeen patients with pathology-proved, treatment-naïve glioblastoma (n = 14) or grade III, IDH wild-type astrocytoma (n = 3) and preoperative BOLD fMRI were identified. The average age was 63.8 years (range, 48–82 years) with 5 men and 12 women. Thirty-two tissue biopsies were obtained from the CE (n = 16) and the NE (n = 16) regions of tumor during open surgical resection. Automated cell counting was successfully performed on 31 H&E stains and 28 NeuN stains (MAB377; MilliporeSigma, Darmstadt, Germany).
Image Acquisition
Before tumor resection, patients underwent standard-of-care imaging (including T1-weighted, gadolinium-enhanced [T1+Gd], T2-FLAIR, and DWI) as well as a resting-state BOLD fMRI scans on 1 of 4 hospital scanners (Intera 1.5T, Achieva 3T, Philips Healthcare, Best, the Netherlands; TwinSpeed HDx 1.5T or Excite HDx 3T, GE Healthcare, Milwaukee, Wisconsin). The ranges of scanning parameters for T1 sequences were the following: TR = 10–2000 ms, flip angle = 13°–90°, TE = 2–20 ms. For FLAIR sequences, the ranges were the following: TR = 8000–11,000 ms, flip angle = 90°, TE = 104–337 ms, TI = 2200–2800 ms. BOLD parameters were the following: TR = 1000–2400 ms, flip angle = 72°–90°, TE = 20–34 ms, number of volumes = 150–200. The scanning parameters for each patient are listed in the On-line Table. Contrast-enhanced images were acquired with IV gadobenate dimeglumine (MultiHance; Bracco Diagnostics, Princeton, New Jersey) with a weight-based dose of 0.2 mL/kg. The time between the IV injection and contrast-enhanced imaging was 5 minutes. BOLD images were obtained before contrast-enhanced imaging.
Biopsy Acquisition
All tissue sampling was performed during the normal surgical plan, provided it posed no additional risk to the patient. Samples were taken from the CE tumor core in all cases and NE regions when within the planned surgical trajectory. Biopsies were obtained before surgical debulking to minimize the effects of brain shift and deformation. Frameless stereotactic guidance was provided by a volumetric T1+Gd scan uploaded to a neuronavigation interface (Curve; Brainlab, Feldkirchen, Germany). Biopsy location was recorded by screen captures of the neuronavigation interface, allowing the downstream determination of the Cartesian coordinates of each biopsy. We have recently shown that this method results in spatial accuracy to within ∼2 mm.18 Biopsies that were taken from radiologically defined areas of necrosis or those that were predominantly histologically necrotic (>75% of the tissue sample) were excluded from the analysis.
Histopathologic Analysis
Samples were formalin-fixed and paraffin-embedded for histopathologic analysis. Five-micrometer sections were stained with H&E. Seven-micrometer sections were immunostained with the NeuN antibody. Qualitative histologic characteristics of neoplasms were evaluated by 2 blinded neuropathologists (G.Z., P.C.). H&E-stained sections were reviewed for the degree of tumor infiltration and scored as no tumor present (score = 0), infiltrating tumor (score = 1), or highly cellular tumor (score = 2). The tumor score was a composite of several features, including cytologic atypia and cell density. H&E slides were also reviewed for the degree of microvascular proliferation, scored as delicate microvasculature (normal vascular architecture; score = 0), simple hyperplastic structures (<3 circumferential layers with patent lumen; score = 1), or complex microvascular hyperplasia (≥3 endothelial layers or glomeruloid-type vessels; score = 2).
Total cell density was calculated using an automated cell-counting algorithm.18 Briefly, the H&E-stained sections were digitalized using a Leica scn400 system (Leica Biosystems, Buffalo Grove, Illinois), with hematoxylin-stained nuclei counted in iteratively processed high-power fields. Total cell density was computed as the median number of hematoxylin-stained cells across all high-power fields that contained at least 1 nucleus. Each immunoperoxidase-stained slide was digitized at low-power ×10 magnification, and a semiautomated algorithm was used to determine the overall NeuN index, to calculate the labeling index for NeuN. For each slide, user-defined RGB (3-channel) and size thresholds were determined by visual inspection of 9 randomly generated low-power ×10 fields. On the basis of these statistics, the algorithm subsequently identified all immunoperoxidase-stained cells in each low-power field and computed the neuronal fraction by dividing the surface area of stained cells by the total surface area of all tissue in the low-power field. The NeuN index was defined as the 90% quantile of fractions across all low-power fields that contained at least 1 stained cell.
Screenshot Registration and Coordinate Determination
Screenshots of the neuronavigation interface showing the biopsy location were superimposed onto a coregistered T1+Gd image. Coregistration of the screenshots to the T1+Gd image in 3D space was performed using custom software written in Matlab (MathWorks, Natick, Massachusetts). The registration pipeline first correlated the pixel intensities of the screenshot to the voxel intensities of each volumetric T1 slice, and the slice with peak correlation was identified as the biopsy slice. A correlation between the screenshot and the biopsy slice was then taken at different x and y offsets, and the peak correlation was used to identify the correct x and y offsets. Finally, each biopsy location on the screenshot was labeled with a cross-hair. To identify this location, we correlated a digital cross-hair to the screenshot at different x and y offsets and used the peak correlation to identify the x and y coordinates of the biopsy site. All coregistered screenshots were confirmed by visual inspection.
Tumor Masks
All structural images were coregistered to the T1+Gd image with the highest spatial resolution using rigid-body registration (FMRIB Linear Image Registration Tool, FLIRT; https://fsl.fmrib.ox.ac.uk/fsl/fslwiki/FLIRT19; 6 df), and all masks were created in the high-resolution reference image space. 3D masks of the CE tumor were hand drawn on high-resolution T1+Gd images by a board-certified neuroradiologist (C.I.H.). The boundaries of the masks were drawn to be as specific for CE intra-axial tumor as possible. To this end, we excluded the following from the tumor mask: ambiguous voxels at the border of CE tumor and NE brain tissue; ambiguous voxels at the border of CE tumor and necrotic core; areas of linear enhancement determined to represent vessels; and extra-axial spread of tumor along the dura or ventricular surface. The control masks were generated by coregistering the T1+Gd image to Montreal Neurological Institute 152 space and transforming a contralesional hemisphere mask, created in Montreal Neurological Institute 152 space, to the patient's reference space (ie, the high-resolution T1+Gd image) using nearest-neighbor interpolation. The contralesional control masks were then visually inspected by a board-certified neuroradiologist (C.I.H.) to ensure that no CE tumor or abnormal FLAIR hyperintense tissue was included in the mask. To generate the functional masks, we registered BOLD scans to the high-resolution reference image (FLIRT, 6 df) and applied the inverse transform to the high-resolution masks to put them into functional space. Because the BOLD data were collected at a lower spatial resolution than the structural data, the transformation of the masks resulted in partial voluming. To minimize any influence of partial voluming from nonenhancing portions of the surrounding tissue, the CE masks were thresholded so that the fraction of the CE tumor was at least 0.95. Similarly, the control masks were thresholded so that the fraction of NE tissue was at least 0.95. All original and transformed masks were visually inspected by a board-certified radiologist (C.I.H.) to confirm accuracy.
Image Preprocessing of BOLD Data
All functional data were processed with the FMRIB Software Library (FSL, Version 5.0.6; http://www.fmrib.ox.ac.uk/fsl)19 and Matlab (2012b) software. Each functional image was motion-corrected, slice-timing corrected, spatially smoothed (Gaussian filter, full width at half maximum = 5 mm), high-pass filtered (100 seconds), and skull-stripped. We performed independent components analysis (MELODIC; https://fsl.fmrib.ox.ac.uk/fsl/fslwiki/MELODIC20), which resulted in ∼40–90 components per scan. The components were visually inspected, and any components related to scanner noise or head movement artifacts were removed. To further minimize the effect of motion on BOLD signal intensity, the motion parameters were regressed out of the data before additional regression was performed with the tumor and control ROI time-series. The 18 motion regressors used in the regression model consisted of 3 translations, 3 rotations, the first derivative of each, and the corresponding quadratic terms. The residual from this model was then used for all subsequent regression analyses.
BOLD Dynamics
To create the BOLD masks, we followed the procedure described in Chow et al.12 We first made the simplifying assumption that there are 2 functional tissue classes within the brain, tumor and healthy tissue, which are represented by the CE portion of the tumor and the contralesional hemisphere, respectively. Mean time-series were extracted from the masks defined by the CE tumor and from the contralesional control hemisphere, by averaging the BOLD time-series of all voxels within each mask. Multiple linear regression was performed for all brain voxels using the 2-regressor model, the CE tumor mean time-series and the contralesional control mean time-series and their first derivatives, to allow variation in timing. The output of this analysis and the metrics used to make our conclusions consisted of parameter estimates (β weights) and z statistic values (β weights normalized by the residual variance) for each voxel. The difference between the 2 z statistic images (ie, ZCE − ZControl) was used as the BOLD biomarker representing vascular function, as described in Chow et al.12 Specifically, strongly negative values (shown in blue on z statistic maps, Fig 1) represent areas of normal vascular function—that is, the voxel time-series is more like the control ROI; strongly positive values (shown in red-yellow on z statistic maps, Fig 1) represent areas of vascular dysregulation—that is, the voxel time-series is more like the CE tumor.
Analysis of Histopathologic and Radiologic Correlation
All statistical tests were performed using the Statistics Toolbox in Matlab (2012b). Linear regression was used to evaluate the relationships between BOLD signal intensity and quantitative histopathologic features (total cell density and NeuN labeling index). The parameter estimate for the CE regressor decreases as a function of distance from the CE mask due to tumor-related vascular dysregulation and nonspecific effects of distance (ie, voxels in close proximity have more similar intensities than voxels that are far apart). To control for nonspecific effects of distance, we included a distance regressor, the measured distance from the biopsy location to the nearest CE voxel, in the regression model of cellularity versus BOLD and NeuN versus BOLD. To assess the relationship between qualitative histologic features (degree of tumor infiltration and microvascular proliferation) and the BOLD signal, we performed a 1-way analysis of variance.
Results
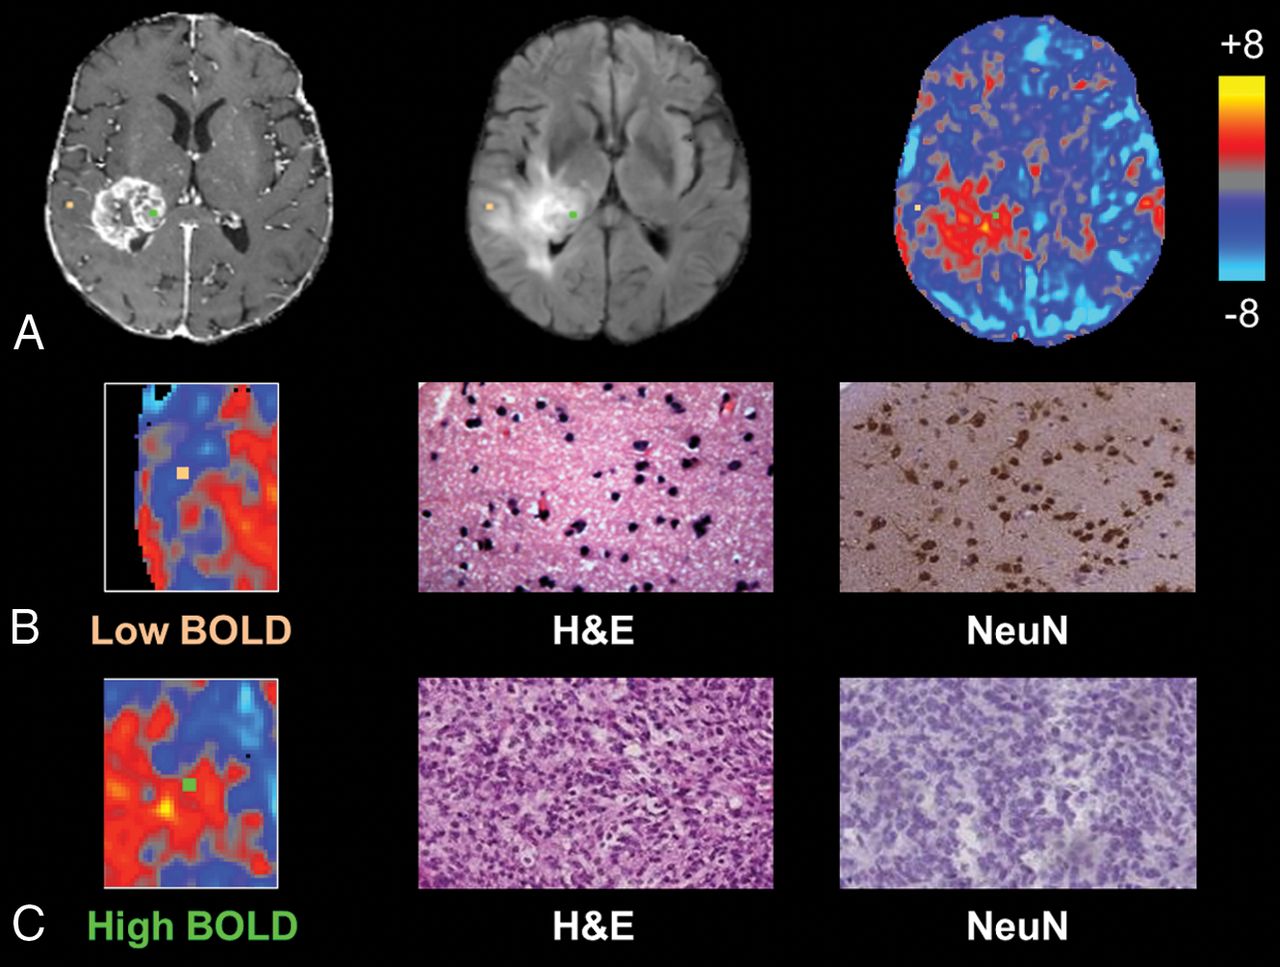
Biopsies demonstrated a range of BOLD signal intensities based on their projection onto z statistic maps, ranging from relatively normal (z = −4.79) to markedly abnormal (z = 8.84). Differences in the degree of signal abnormality appeared to be related to certain histopathologic characteristics within individual tissue samples. Representative biopsies from a single patient are shown in Fig 1, which illustrates tissue samples taken from areas of differing BOLD signals (Fig 1A). Tissue corresponding to a negative BOLD value (z = −1.90; Fig 1B) demonstrated normal cell density, high NeuN staining, noninfiltrated gray matter, and normal, delicate microvasculature. In contrast, a sample corresponding to a highly positive BOLD signal (z = 4.44; Fig 1C) contained hypercellular tissue, little neuronal staining, highly cellular tumor, and complex microvascular hyperplasia.

Individual biopsies from areas of intact and disrupted vascular function exhibit distinct histopathologic characteristics. A, Biopsy locations overlaid onto T1 postcontrast, FLAIR, and BOLD images with correlative histopathology in B and C. The sample from relatively normal BOLD signal, representing normal vascular function (orange, B), shows normal cellularity and high NeuN staining, suggestive of noninfiltrated gray matter, whereas the sample from a region of BOLD signal abnormality (green, C) shows tumor tissue and no neuronal staining.
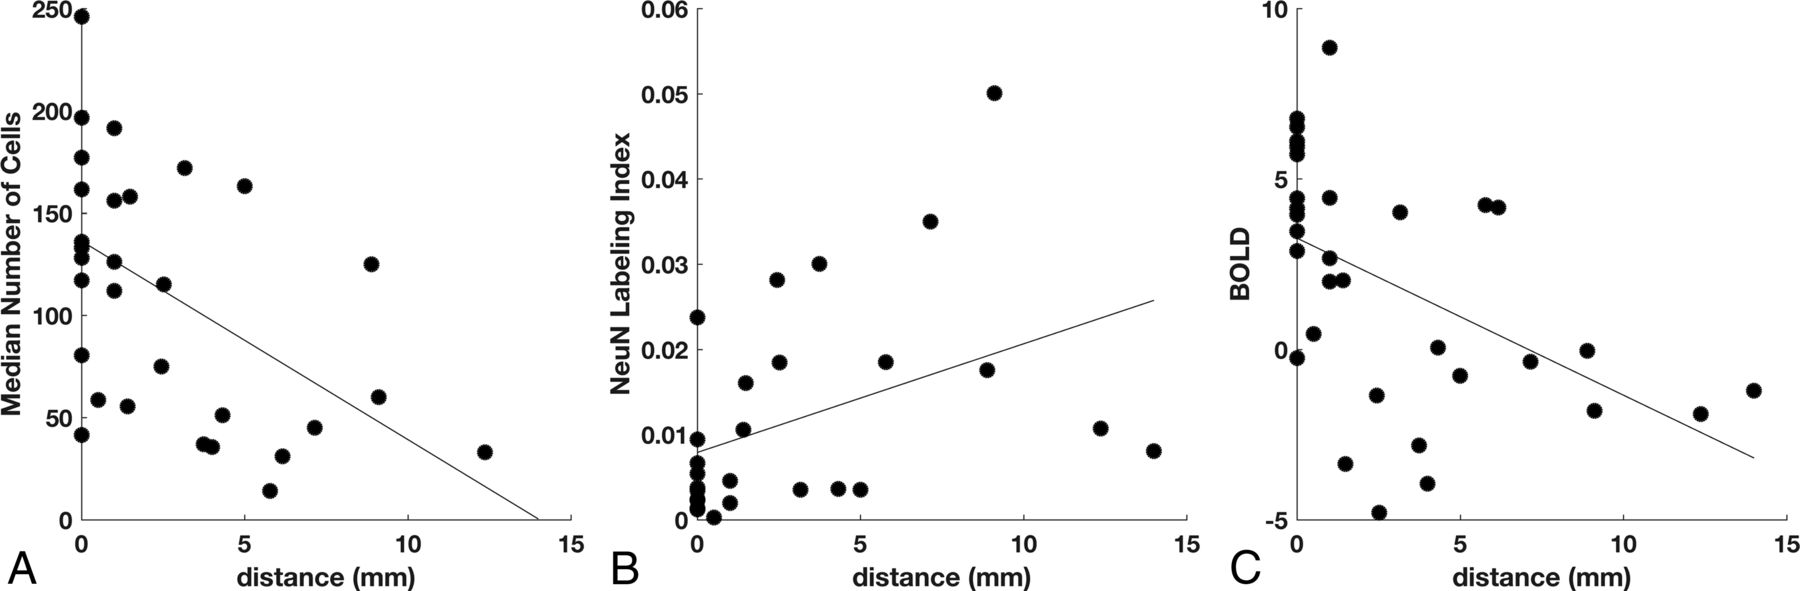
Among all biopsies, linear regression analysis demonstrated a significant inverse relationship between total cell density and distance from the nearest CE voxel (P = .003, R2 = 0.27; Fig 2A) and a positive relationship between neuronal density and distance (P = .032, R2 = 0.17; Fig 2B). The BOLD signal also showed an inverse relationship with distance (P = .004, R2 = 0.25; Fig 2C). Linear regression between BOLD signal intensity and total cell density, with distance to the nearest CE voxel as a confounding variable, showed a positive relationship (P = 2 × 10⁻⁵, R2 = 0.48; Fig 3A). A similar analysis showed that the NeuN labeling index was negatively related to BOLD signal intensity (P = .001, R2 = 0.35; Fig 3B). An alternative explanation for this negative relationship could be the greater prevalence of gliomas in white matter, which normally has low neuronal density, rather than the neurotoxic effects of the tumor. To test this hypothesis, we compared the BOLD values in gray (mean, −2.9 ± 0.76) and white (mean, −2.4 ± 0.83) matter on the contralesional control hemisphere. Gray matter voxels were significantly more negative than white matter voxels (t test, P = .001, t = 4.00); however, the difference in BOLD values due to tissue type (gray–white = −0.54 ± 0.56) cannot explain the very large range of BOLD values across the biopsy samples (maximum–minimum = 8.85 to −4.79 = 13.64).

Effect of distance from contrast enhancement on cellularity, neuronal density, and BOLD signal abnormality. A, Cell density decreases with the distance to the nearest contrast-enhancing voxel (n = 31, P = .003). B, Neuronal density increases with the distance to contrast enhancement (n = 27, P = .032). C, Intensity of the BOLD biomarker decreases with the distance to contrast enhancement (n = 32, P = .004).

BOLD signal abnormality is related to total cell and neuronal density. A, After we controlled for the effect of distance on the BOLD signal, median cell density is positively related to the BOLD z statistic (n = 31, P = 2 × 10⁻⁵). B, The NeuN labeling index is inversely related to the BOLD z statistic (n = 27, P = .001).
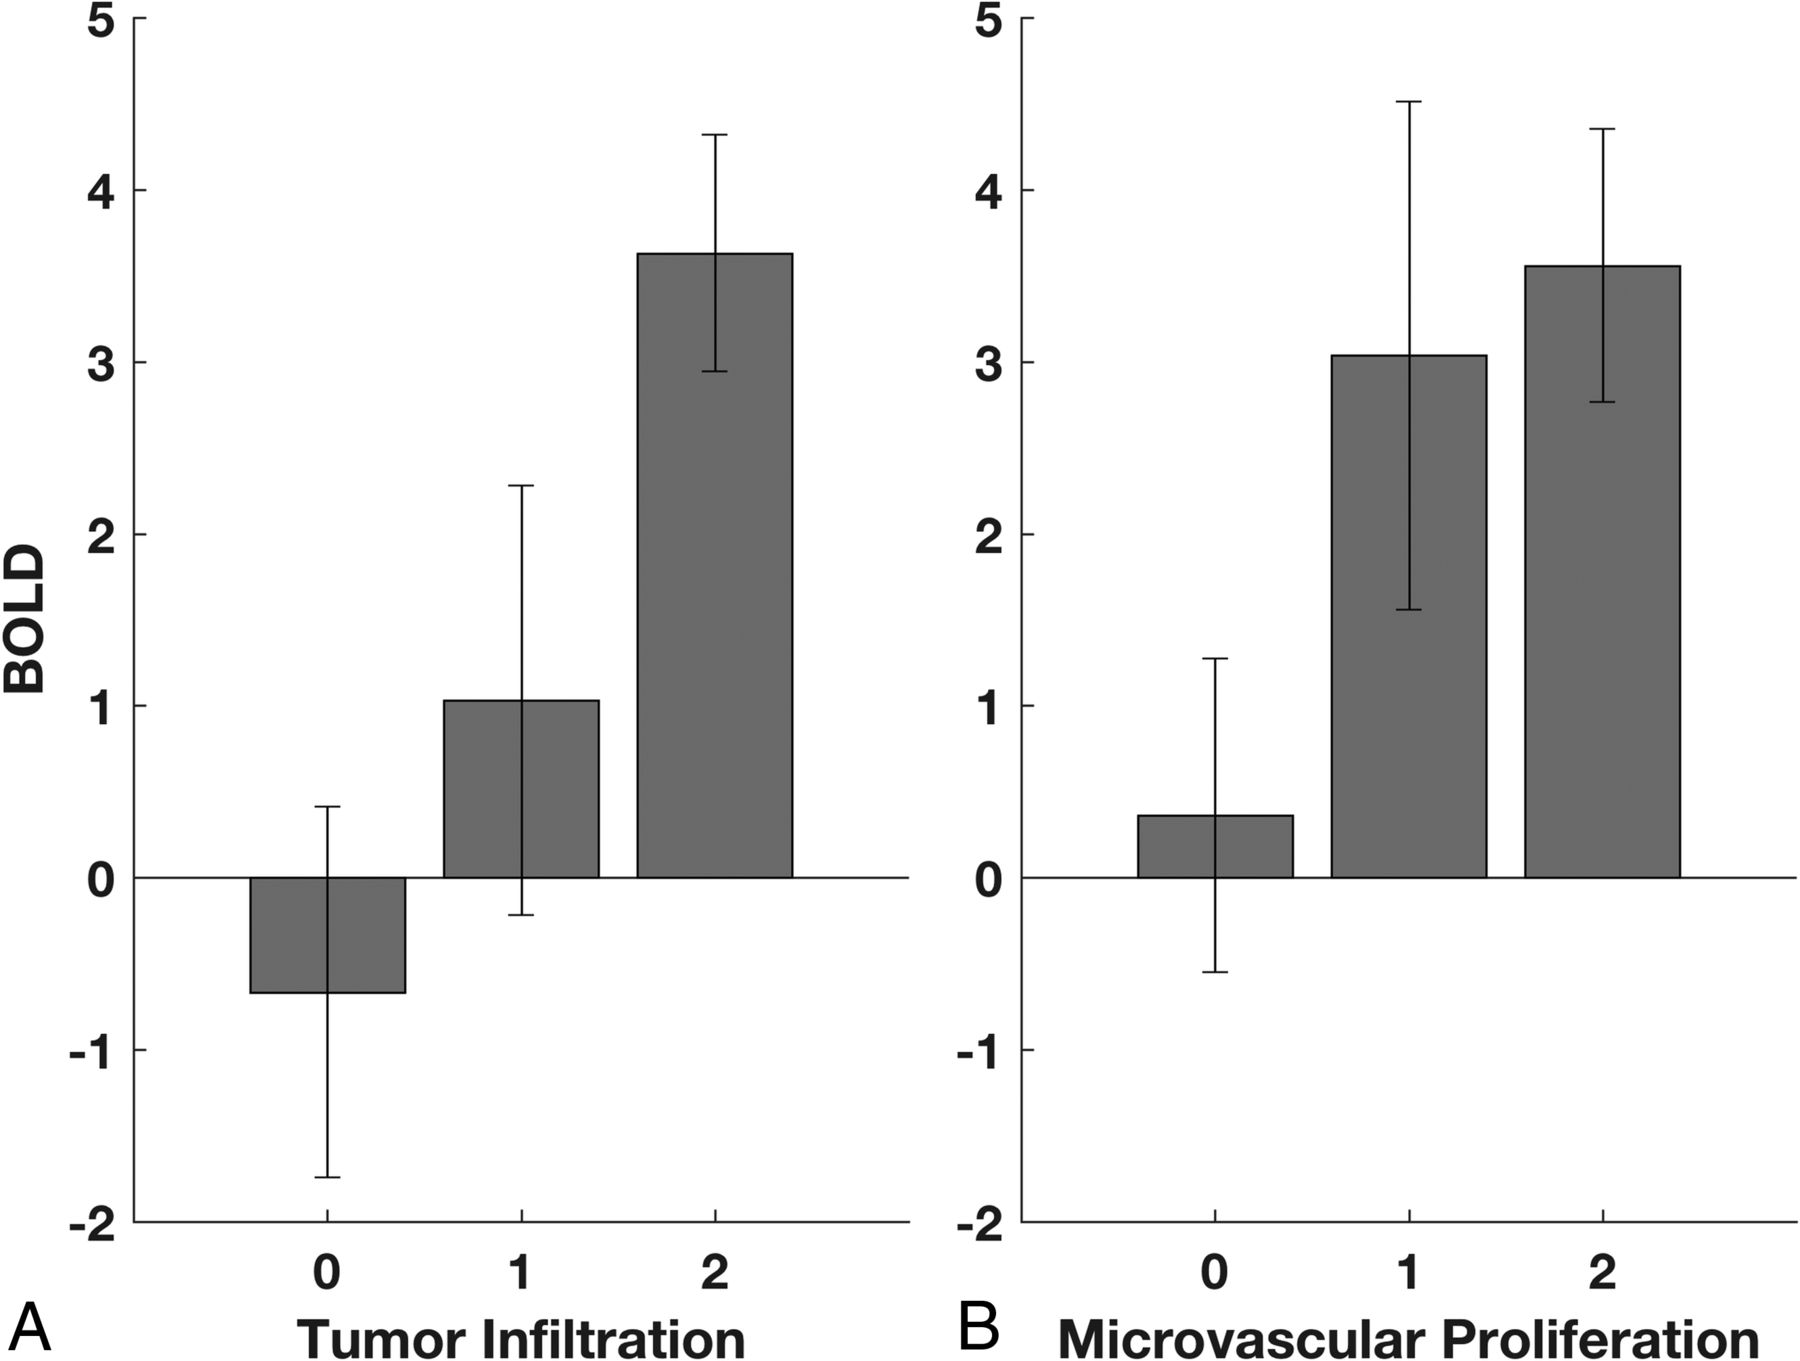
The distributions of BOLD signal abnormality related to tumor infiltration and microvascular proliferation are summarized in Fig 4. Across all biopsies, both the tumor infiltration score (ANOVA: F[2,29] = 4.95, P = .014) (Fig 4A) and the microvascular proliferation score (ANOVA: F[2,29)] = 3.46, P = .045) (Fig 4B) were significantly related to the BOLD signal abnormality. A post hoc Student t test showed a significant difference in BOLD signal between the group of samples with no detectable tumor (score = 0) and those with highly cellular tumor (score = 2; P = .003) or the combination of infiltrating and highly cellular tumor (score 1 or 2; P = .029). Similarly, a t test showed a significant difference in BOLD signal between the group of samples with no identifiable microvascular proliferation (score = 0) and those with marked vascular hyperplasia (score = 2; P = .038) or the combination of simple and complex vascular hyperplasia (score 1 or 2; P = .027).

BOLD signal abnormality is related to tumor infiltration and microvascular proliferation. A, ANOVA demonstrates a significant relationship between the BOLD z statistic and tumor infiltration (P = .014). Scores of 0, 1, and 2 represent no detectable tumor, infiltrating tumor, and highly cellular tumor, respectively. B, ANOVA demonstrates a significant relationship between the BOLD z statistic and microvascular proliferation (P = .045). Scores of 0, 1, and 2 represent normal vascular architecture, simple hyperplastic structures, and complex microvascular hyperplasia, respectively.
Discussion
The diffuse infiltration and histologic heterogeneity of malignant gliomas pose a distinct challenge to the identification of the toxic effects of these tumors on the structure and function of the cerebrovasculature. The integrity of the vasculature in and around the main mass of the tumor is typically assessed with standard-of-care imaging that uses T1-weighted contrast-enhanced and FLAIR sequences.1⇓⇓–4 Regions of abnormal contrast enhancement associated with the main tumor mass typically correspond to elevated CBV, CBF, and microvascular permeability on perfusion-weighted imaging.21⇓⇓⇓⇓⇓–27 Most interesting, there are few vascular abnormalities in the NE, FLAIR-hyperintense peritumoral regions on perfusion imaging,21⇓⇓⇓⇓⇓–27 despite the recognized infiltration of tumor cells into these areas.28⇓⇓–31 Additional evidence suggests that edema surrounding the tumor originates directly from the CE tissue, passively diffuses into the NE regions, and may therefore not be associated with blood-brain barrier breakdown in the NE tissue.32,33
Several intriguing studies have, however, identified decreased vascular reactivity outside CE regions of glioma.5,7,34 In turn, it has been postulated that infiltrating glioma cells disrupt neurovascular coupling,35,36 impairing both normal hypercapnia-induced elevations in CBF and CBV and the vascular reactivity of cortical tissue, particularly within gray matter. However, without any histopathologic correlation to these radiologic findings, it has been unclear whether infiltrating glioma cells contribute directly to these abnormalities. The results of the present study, by relating histopathologic and radiologic data, demonstrate that the BOLD biomarker of vascular dysfunction is directly associated with tumor infiltration. We found markedly abnormal tissue in areas of BOLD signal abnormality and relatively unaffected brain tissue in areas of relatively normal BOLD signal. Moreover, the BOLD biomarker is directly related to total cell density and inversely related to neuronal density and is correlated to scores of tumor infiltration and microvascular proliferation.
The spatial distribution of the BOLD biomarker is also consistent with a decreasing cell density gradient with distance from the tumor core.28 The biomarker decreases as a function of distance from the CE tumor core, replicating our previous findings.12 We found that the effect of distance is similar among BOLD, cellularity, and neuronal density, suggesting that the detectable infiltrating margins of the tumor span approximately 1–2 cm beyond the contrast enhancement, comparable with the commonly used 2- to 3-cm margins for radiation treatment.37 More important, the relationship between the BOLD biomarker and the cell counts (ie, cellularity and neuronal density) remained statistically significant, even after including distance from the CE core as a covariate, indicating that the BOLD data can explain additional variance of tumor heterogeneity unrelated to a simple density gradient.
The mechanisms by which glioma influences vascular function are unknown. Several potential mechanisms have been proposed as broad or long-distance effects of glioma on vascular function. For example, mass effect and consequent venous compression could alter rates of blood flow over large regions of surrounding brain tissue8,17; shared venous drainage could allow signal from blood draining from the tumor core to predominate even in the peritumoral area12; the effects of aberrant metabolite and neurotransmitter production found in gliomas may extend to normal cortical vessels, inducing vascular dysregulation at indeterminate distances from invading tumor cells; and the tumor may affect fibers of passage in its vicinity, inducing necrosis or structural changes with detrimental downstream effects, consistent with findings of multidomain cognitive dysfunction in some patients with glioblastoma that are not easily attributable to local injury from the tumor38 and the disruption of global resting-state networks.39⇓⇓–42
In contrast, local tumor effects may also contribute to the vascular dysfunction seen with the BOLD biomarker. For example, invading glioma cells could perturb the structure of the neurovascular unit by compromising direct contact between vascular endothelial cells and astrocytes.1,3,43 Alternatively, astrocytic mediation of the vascular response may be modulated directly by the neurotransmitters of the glioma cells44 or by affecting the action of normal signaling molecules.
A BOLD fMRI biomarker of vascular dysfunction has several potential clinical applications that could warrant further investigation. BOLD, with its sensitivity to local effects of infiltrating glioma, could be another useful adjunct in guiding surgery beyond the CE boundary, especially considering the growing body of evidence favoring aggressive resection.45,46 For the same reason, it may be useful in targeting adjuvant radiation therapy toward affected areas unamenable to surgical resection. In the same vein, investigating the BOLD dynamics in areas of residual disease may offer insight into the mechanisms of disease recurrence and progression: It is possible that disease recurrence is more attributable to compromised vascular function than residual tumor burden alone. Thus, application of the BOLD biomarker in posttreatment surveillance could offer new insight into patterns of glioblastoma spread, assess response to new therapies, and segment areas of tumor recurrence.
There are, however, several limitations to our conclusions. There is no way to ensure perfect fidelity between the physical biopsy location and the biopsy site as represented by frameless stereotaxy during an open tumor resection. As per the study protocol, attempts were made to mitigate the effects of intraoperative brain shift within the limits of the surgical plan by minimizing intraoperative use of mannitol, CSF diversion, or hyperventilation before biopsy. Most important, all biopsy sampling was performed before tumor debulking. Nevertheless, it is possible that the BOLD value extracted from the presumed biopsy site could be displaced by ≥1 voxel from the true biopsy location. However, we recently showed that our sampling method has registration accuracy to within ∼2 mm,18 suggesting that this type of error would have minimal effect on our results.
Additionally, we did not have rigid control of scanning parameters due to the retrospective nature of this study; consequently, contrast-to-noise and signal-to-noise could vary significantly across individuals. However, all structural data were reviewed by a neuroradiologist and assessed to be clearly interpretable for creating tissue masks. Similarly, variability in scanning parameters certainly affected the signal-to-noise properties of the BOLD data. Despite this variability, we showed a significant relationship between BOLD data and histologic features, suggesting that future prospective studies that can hold scanning parameters constant could decrease the variance of this relationship. Finally, masks were constructed by a single neuroradiologist, resulting in some subjectivity in mask boundaries. However, our previous work12 has demonstrated that the vascular dysregulation maps are not sensitive to small changes in mask variability (eg, using gray matter versus white matter as the contralesional control mask resulted in 2 BOLD maps that had a correlation of 0.96).
Conclusions
Vascular dysregulation, as represented by a resting-state BOLD biomarker, is seen both within and well beyond the margins of contrast enhancement in malignant gliomas. Many factors likely influence this dysfunction in NE regions. However, the statistically significant correlation between tumor infiltration and the degree of BOLD abnormality suggests that infiltrating glioma cells contribute to vascular dysfunction in both CE and NE regions.
Footnotes
Disclosures: Peter D. Chang—RELATED: Provision of Writing Assistance, Medicines, Equipment, or Administrative Support: NVIDIA Corporation, Comments: donation of graphics-processing unit computing hardware for analysis. Peter Canoll—RELATED: Grant: James S. McDonnell Foundation, Comments: This grant supported the collection and analysis of the localized biopsies*. Jack Grinband—RELATED: Grant: American Society of Neuroradiology*. *Money paid to the institution.
Preliminary results from this work were presented at: Eastern-Atlantic Medical Student Research Forum, March 3–5, 2016; Miami, Florida. Further results were previously presented at: Society of Neuro-Oncology Annual Meeting and Education Day, November 17–22, 2016; Scottsdale, Arizona.
This project was funded, in part, by the 2015 Research Scientist Award from the American Society of Neuroradiology (J.G.), the James S. McDonnell Foundation, and the Irving Institute for Clinical and Translational Research: Pilot Research Award (P.C.). Support from NVIDIA included 1 TITAN X Graphic Card (12 GB) to run a deep learning code to perform cell counting (P.D.C.). Dr Chang's salary is supported by the National Institutes of Health (National Institute of Biomedical Imaging and Bioengineering) T32 Training Grant, T32EB001631.
Indicates open access to non-subscribers at www.ajnr.org
References
- Received February 8, 2017.
- Accepted after revision November 9, 2017.
- © 2018 by American Journal of Neuroradiology


