
Abstract
BACKGROUND AND PURPOSE: 4D-DSA provides time-resolved 3D-DSA volumes with high temporal and spatial resolutions. The purpose of this study is to investigate a shifted least squares method to estimate the blood velocity from the 4D DSA images. Quantitative validation was performed using a flow phantom with an ultrasonic flow probe as ground truth. Quantification of blood velocity in human internal carotid arteries was compared with measurements generated from 3D phase-contrast MR imaging.
MATERIALS AND METHODS: The centerlines of selected vascular segments and the time concentration curves of each voxel along the centerlines were determined from the 4D-DSA dataset. The temporal shift required to achieve a minimum difference between any point and other points along the centerline of a segment was calculated. The temporal shift as a function of centerline point position was fit to a straight line to generate the velocity. The proposed shifted least-squares method was first validated using a flow phantom study. Blood velocities were also estimated in the 14 ICAs of human subjects who had both 4D-DSA and phase-contrast MR imaging studies. Linear regression and correlation analysis were performed on both the phantom study and clinical study, respectively.
RESULTS: Mean velocities of the flow phantom calculated from 4D-DSA matched very well with ultrasonic flow probe measurements with 11% relative root mean square error. Mean blood velocities of ICAs calculated from 4D-DSA correlated well with phase-contrast MR imaging measurements with Pearson correlation coefficient r = 0.835.
CONCLUSIONS: The availability of 4D-DSA provides the opportunity to use the shifted least-squares method to estimate velocity in vessels within a 3D volume.
ABBREVIATIONS:
- PC
- phase-contrast
- SBR
- sideband ratio
- TCC
- time concentration curve
- VIPR
- vastly undersampled isotropic projection reconstruction
2D digital subtraction angiography and a 3D rotational angiography acquisition followed by 3D-DSA reconstruction are the standards for vascular morphology assessment. There is an increasing demand for hemodynamic information, including blood flow rate and velocity for diagnosis, treatment planning, and evaluation.1⇓–3 Many algorithms have been proposed to estimate blood flow in arteries from 2D-DSA; these are divided into 2 major classes: bolus-tracking and computational methods.4⇓⇓⇓⇓⇓⇓–11 A thorough review of these techniques can be found in Shpilfoygel et al.12 However, 2D-DSA based methods are challenged by vessel overlap and vessels being aligned with the primary x-ray beam direction.
Recently, a new reconstruction method13⇓⇓–16 has been applied to a single 3D rotational angiography acquisition to generate time-resolved 3D-DSA at frame rates up to 30 frames/second (4D DSA). The availability of the geometric and temporal data in a 4D-DSA reconstruction provides the opportunity to estimate velocity and flow more accurately than has previously been possible with 2D DSA. In this article, a shifted least-squares based technique was used with the 4D-DSA data to estimate blood velocity. The proposed algorithm was first validated using flow phantom studies, in which the velocity could be documented using an ultrasonic flow probe. Blood velocity was also determined in 4D-DSA datasets from 14 ICAs of volunteers who also underwent 3D fast phase-contrast with vastly undersampled isotropic projection reconstruction (PC VIPR) studies.17⇓–19
Materials and Methods
4D DSA Acquisition and Data Preparation
Noncontrast (mask) and contrast-enhanced (fill) rotational acquisitions were performed using a conventional flat panel detector angiographic system (Artis zee; Siemens, Erlangen, Germany) with the following settings: 70 kV(peak), 0.36 μGy/frame, 304 images, 260° arc. Contrast injection (iohexol, Omnipaque 300; GE Healthcare, Piscataway, New Jersey) into the subject was started at the beginning of the fill run (3 mL/second, 7-second injection duration). The rotational acquisition protocol yields x-ray projection images, which are used to automatically reconstruct both 3D-DSA and 4D-DSA with an isotropic spatial resolution of 0.46 × 0.46 × 0.46 mm3.
The centerline of each vascular segment was determined from the static 3D volume using an efficient 3D parallel-thinning algorithm.20 The contrast waveform map, which is the time concentration curves (TCCs) along the centerline path (curvilinear length z), was extracted from the 4D-DSA and stored for each vascular segment for velocity calculation.
Shifted Least-Squares Algorithm
In an arterial contrast injection, there is a temporal oscillation in iodine concentration that arises from the mixing of contrast medium, which is injected at a fixed rate, and nonopacified blood, which flows at a variable rate driven by the cardiac cycle. This temporal variation in contrast, referred to as pulsatility, appears at points downstream of the injection with a time delay. The time delay is related to the distance downstream and the blood velocity. Therefore, velocity can be estimated by measuring the distance along the vessel centerline and the time delay.
For any 2 points, i and j, along the centerline, the shifted least-squares difference between their TCCs, ci(t) and cj(t), can be calculated as
 The value τij0, τij0 ∈ [0, T] that minimizes the shifted least-squares difference, ε (τij), is regarded as the time of bolus transport between these 2 points. The spatial distance z between the 2 points is calculated from the 3D path length along the vessel centerline. The time-shift τ0 as a function of the spatial distance z can then be fit to a linear relation:
 where the slope a is the inverse of the velocity v.
Optimizing Waveform Selection
It has been found that the shifted least-squares algorithm provides the most reliable velocity calculation in vessel segments where pulsatility is strong and consistent. To automatically select the waveform regions with strong and consistent pulsatility, we generated a sideband ratio (SBR) map.21
For each point in the waveform map, a short-time Fourier transform was applied to generate the local power spectrum PSfn, where fn is the nth characteristic frequency. The SBR at this point can be calculated as
 where the denominator summation includes the neighboring frequency points and excludes the fundamental frequency f0. From this SBR map, a low-pass filter was applied and a threshold of one-fourth of the median SBR was enforced to generate a mask. This mask excludes low pulsatile signals from consideration in the velocity calculation.
Phantom Study
To validate the proposed method for velocity estimation, we used a flow phantom containing a loop of plastic tubing to perform 4D-DSA studies. Pulsatile water flow with different mean flow rates was generated using a perfusion pump with a controllable flow setting (S3; Storkcert, Freiburg, Germany). A 5F catheter was introduced into the tubing for injection of iodinated contrast medium (Omnipaque 300 diluted with 25% water) with a power injector. 4D-DSA-derived flow was compared with flow measurements made with an ultrasonic flow probe (400-Series Multi-Channel Flowmeter; Transonic, Ithaca, New York) attached to the tubing 5 inches away from the catheter tip.
Rotational projection images were acquired using the mask and iodine-filled scans with 12-second acquisition over a 260° arc. The frame rate was 30 frames per second. The 4D-DSA volume data were reconstructed using the vendor's prototype software (Siemens Healthineers, Forchheim, Germany).
A time-resolved flow profile was recorded during each fill scan using the ultrasonic probe. The reference flow measurement was taken as the average of the flow profile over the same time window that was used for 4D-DSA-derived flow.
Five different flow settings were selected to provide average flow rates ranging from 285 to 1140 mL/min (corresponding to the mean velocity of 15–60 cm/s for the tubing with a 0.64-cm diameter). Three 4D-DSA scans and reference flow measurements were made for each flow setting.
Clinical Study
Nine subjects who had both DSA and PC VIPR examinations were selected from a data base generated under University of Wisconsin review board approval. Because 5 of 9 subjects had bilateral studies, a total of 14 ICAs were available for evaluation. Scanning parameters for postcontrast PC VIPR were the following: FOV = 22 × 22 × 22 cm2, TR/TE = 12.5/4.8 ms, velocity-encoded gradient-echo imaging = 80~100 cm/s, bandwidth = 83.3 kHz, readout matrix = 320 points per projections, spatial resolution for the complex difference image = 0.68 × 0.68 × 0.68 mm3. The complex difference images from the PC VIPR scan were segmented for vessel content using Materialise Mimics (Materialise NV, Leuven, Belgium). The segmented MR imaging data were then registered to the 3D-DSA using a correlated point registration with manual point placement, followed by an affine rigid registration. Centerline coordinates of the ICAs generated from the 3D-DSA volumes were used for velocity estimation. An automated workflow for the PC VIPR analysis was developed in Matlab (MathWorks, Natick, Massachusetts). This software performed cross-sectional plane placement for every voxel along the 3D centerline path, segmentation of the vessel boundaries in each plane, and averaging of the normal velocities for all points inside the segmented boundaries. The reported velocity value for a vessel was then the average result over all the centerline points that were present in both the PC VIPR and 3D-DSA volumes.
Statistical Analysis
The validation process was performed using linear regression fit between flow probe (Vfp) and Vdsa (calculated using 4D-DSA) for the phantom study. Correlation analysis and Bland-Altman plots were used to compare the velocity measurements using PC VIPR versus 4D-DSA for the clinical study. The Pearson r was used for correlation analysis, and a P value < .05 for the correlation coefficient was considered statistically significant.
Results
Phantom Study
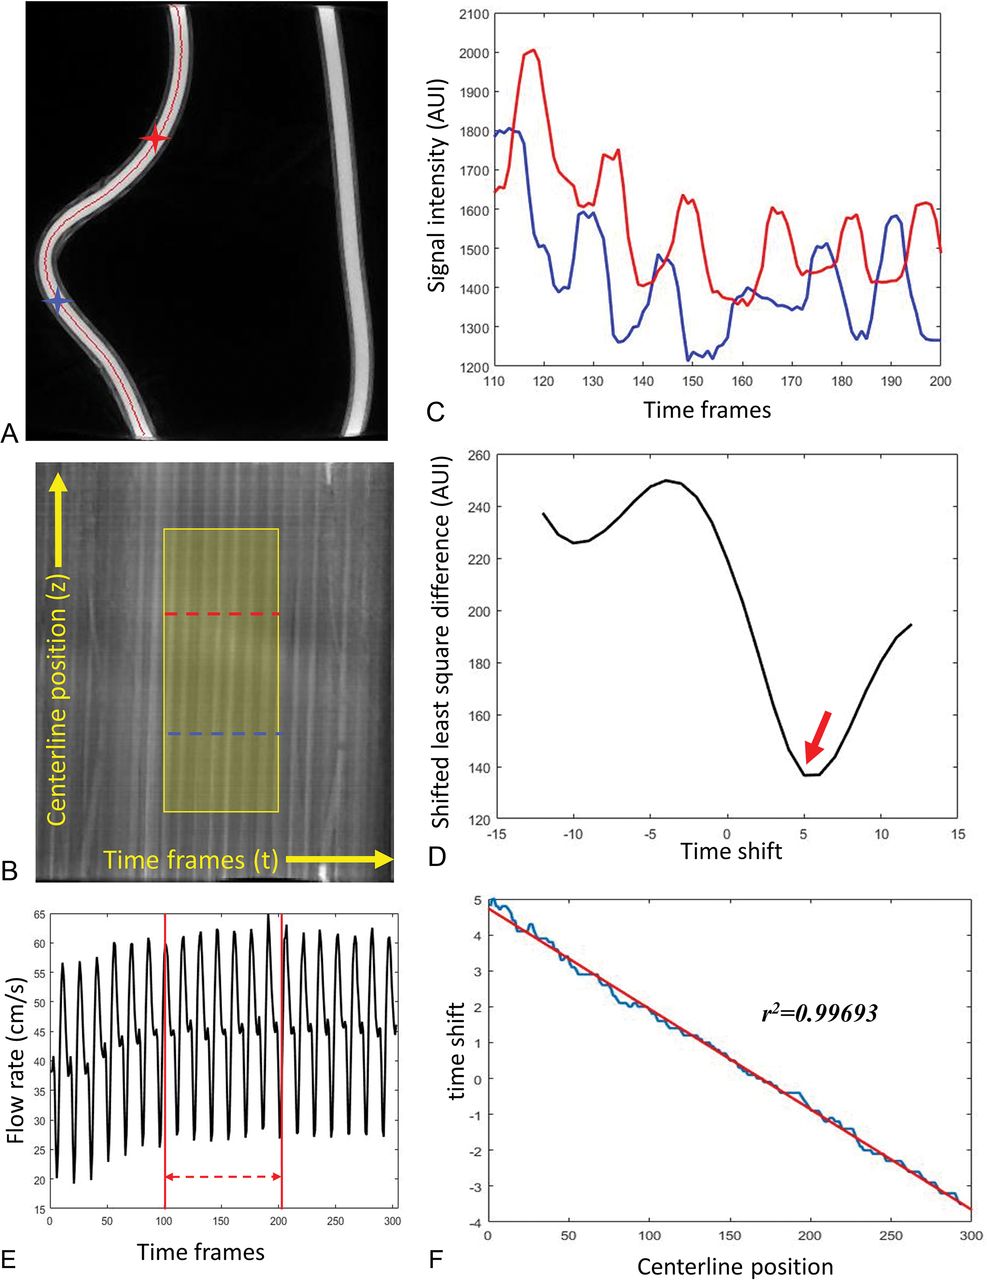
Figure 1 shows sample data from the phantom study. First, the centerline was generated from the static 3D volume (Fig 1A). Figure 1B is the contrast waveform map (TCCs along the centerline path) of the selected centerline. Each point in the map M(t,z) represents the signal intensity of the voxel at distance z along the centerline and at timeframe t [Cz(t)]. The intensity variations along the vertical axis reflect the concentration of iodine contrast medium versus the distance from the injection site for a given time point. Variations along the horizontal axis reflect variations in concentration versus time for a given point along the centerline. The slope of the intensity ridges reflects the blood velocity. In the displayed format, higher blood velocities produce ridges that are closer to vertical, whereas lower blood velocities produce ridges closer to horizontal. The highlighted region is the optimized waveform region for the flow calculation determined using the SBR method. TCCs of 2 selected voxels along the centerline (marked as blue and red stars on Fig 1A and blue and red dashed lines on Fig 1B) are shown in Fig 1C. Figure 1D shows the least-squares differences of these 2 signals as a function of the time-shift, where the minimal appears at τ0 = 5 is considered as the time of bolus transport from the blue voxel to the red voxel. Figure 1F demonstrates the linear fitting between the time-shift of each voxel along the centerline and its corresponding centerline position. Figure 1E is the flow profile recorded from the flow probe (downsampled to 1/30 second to correspond to the 4D-DSA timeframes). Flow measurement was taken as an average over the same temporal window used in the 4D-DSA flow calculation.

A representative phantom study demonstrates the flow calculation from 4D-DSA. A, MIP image of the reconstructed phantom with centerline (red) overlaid. B, The contrast waveform map of the voxels along the centerline. The horizontal direction is the timeframe in the 4D-DSA scan, and the vertical direction is the position along the vessel centerline. Each point in the map M(t,z) represents the signal intensity of the voxel at distance z along the centerline and at time frame t. The highlighted area is the optimized waveform region where the pulsatility is strong and consistent. TCCs of 2 selected voxels along the centerline (marked as blue and red stars on A and blue and red curves on B) are shown in C. D, The least-squares differences of these 2 signals as a function of the time-shift, in which the minimal appears at τ0 = 5 shown as red arrow on D is considered as the time of bolus transport from the blue voxel to the red voxel. The time-shift as a function of the centerline position was fit to a linear relation (F), where the slope is the inverse of the velocity. E, The flow profile recorded from the flow probe (downsampled to 1/30 second to correspond to the 4D-DSA timeframes). Flow measurement is the average taken between the red lines, which correspond to the optimized window shown in B. AUI indicates arbitrary unit of intensity.
The linear regression fit between the flow probe measurement and the 4D-DSA calculation is shown in Fig 2. The linear regression equation is as follows: Vdsa = 1.0069Vfp + 2.8482, where Vdsa is the velocity calculated from 4D-DSA and Vfp is the measurement using the flow probe. The determination coefficient R2 of the fit was 0.9677. The 95% confidence interval slope was 0.8966–1.1172 and the 95% CI intercept was −1.4917–7.1881. These evaluations have been obtained with significance levels of P = 4.521E-11 and P = 0.18, respectively. The relative root mean square error (normalized by mean velocity) was 11.3%.

Linear regression between the flow probe measurements and the 4D-DSA calculations from 15 phantom studies. Evaluations have been obtained with significance levels P = 4.521E-11 for the slope and P = 0.18 for the intercept.
Clinical Study
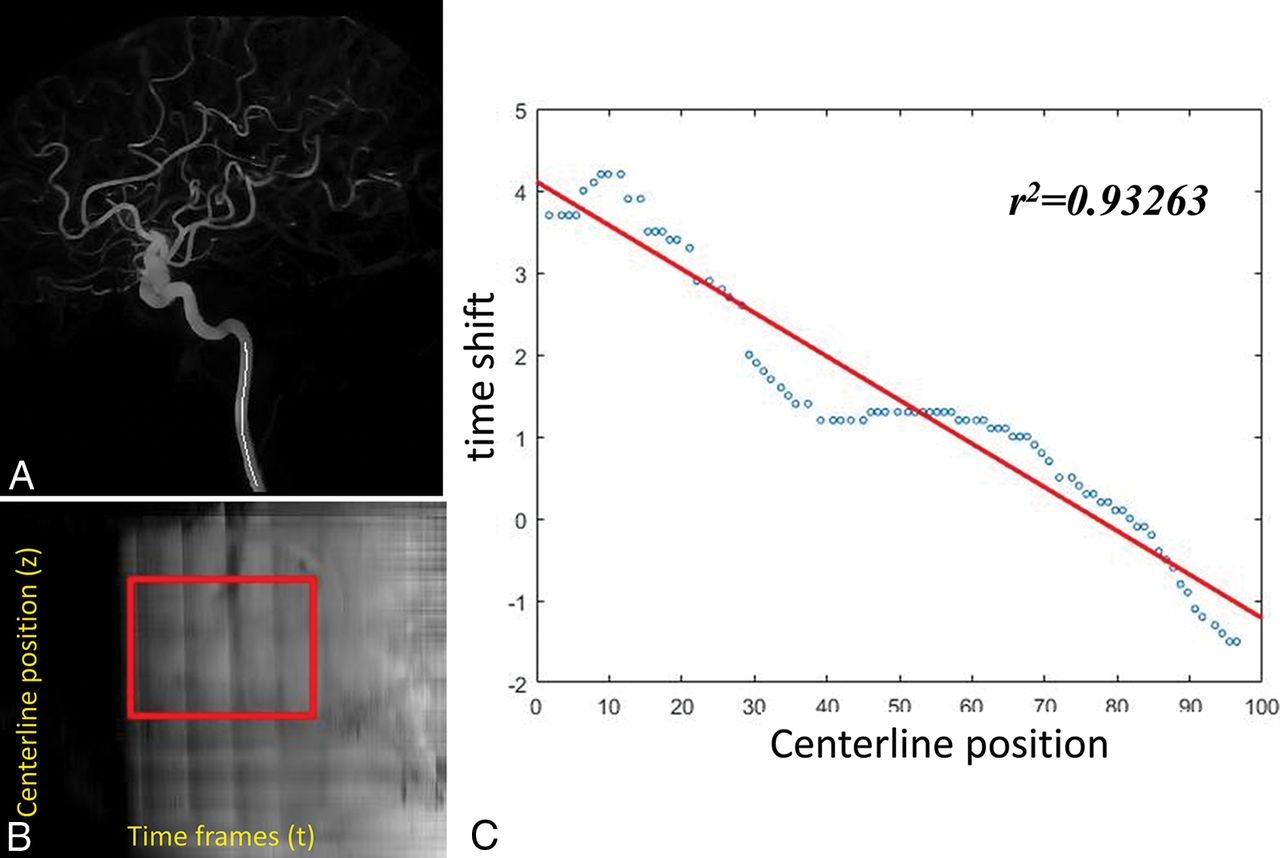
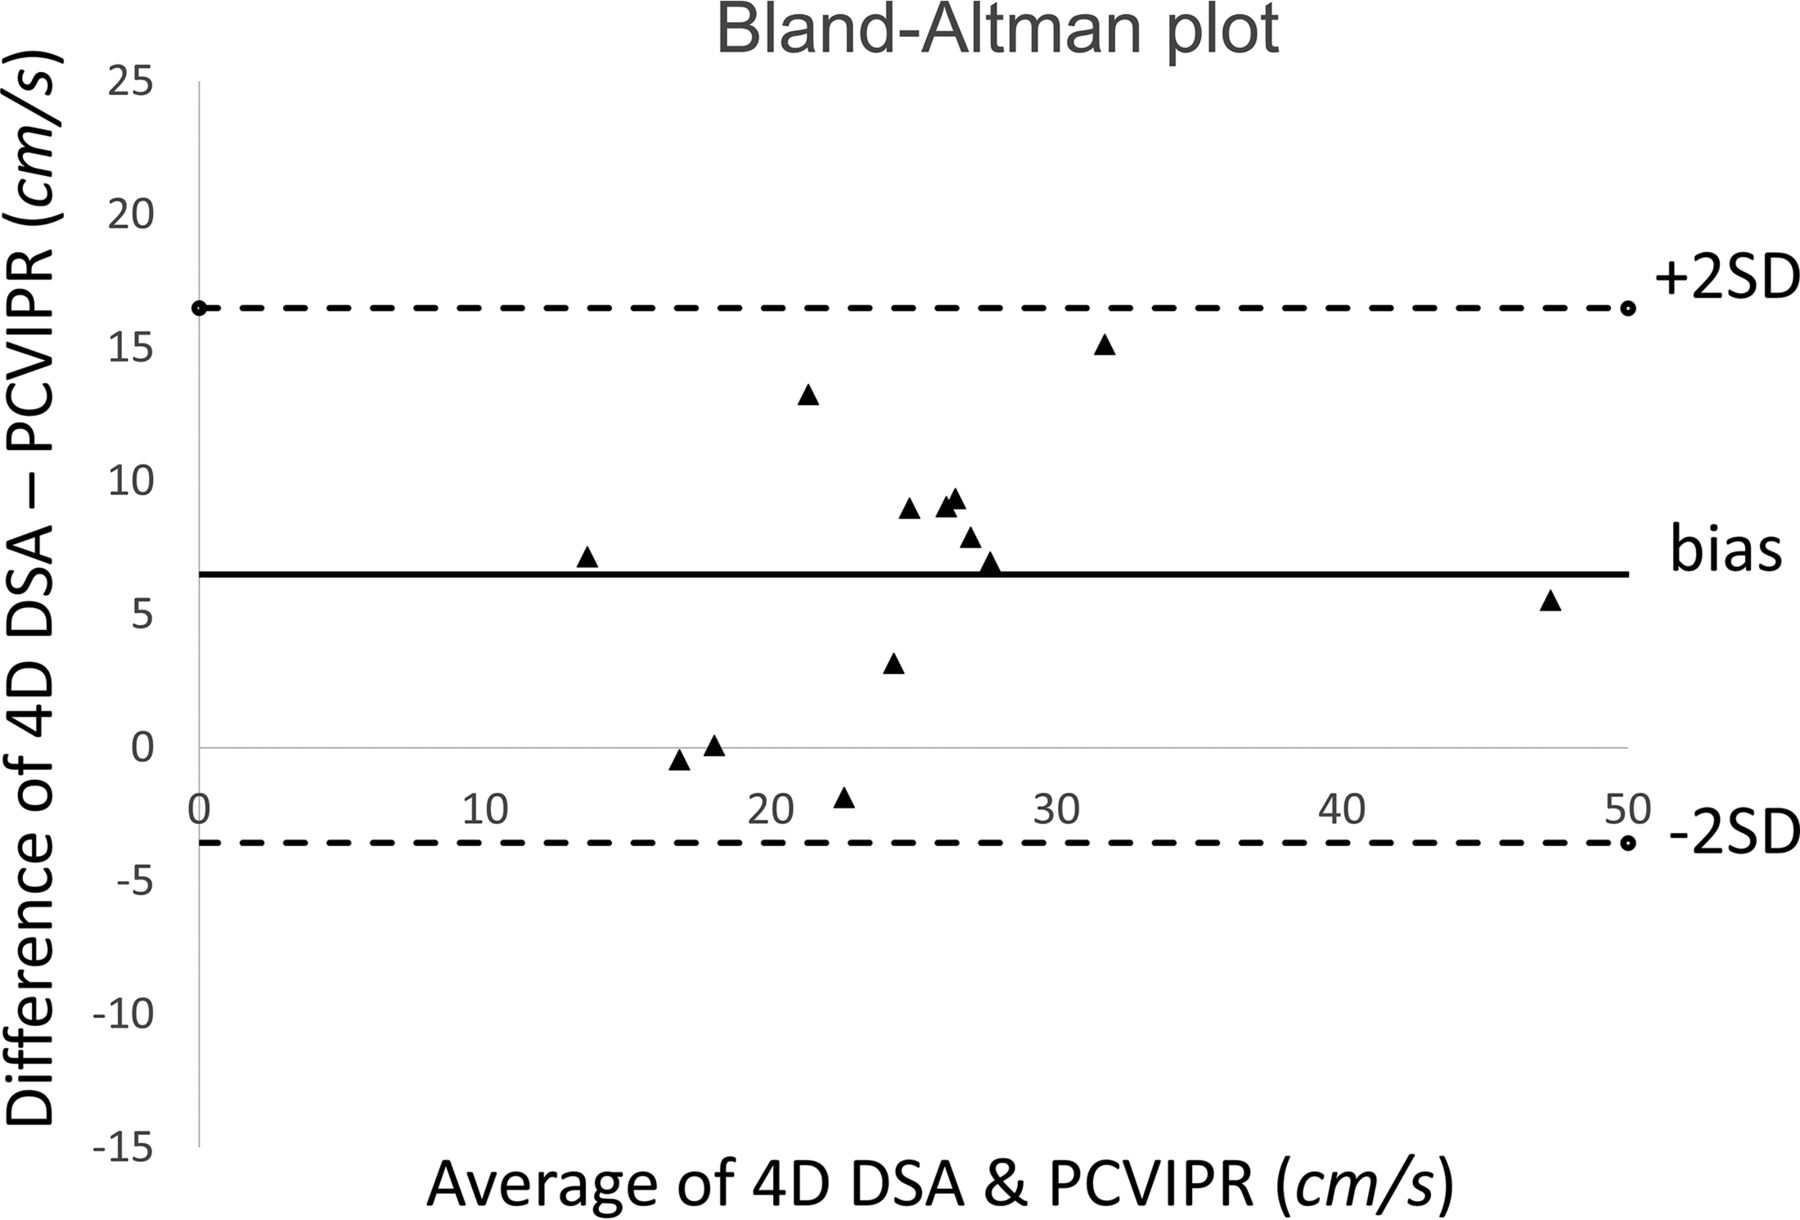
The average ICA flow rates were calculated from 13 of the 14 ICAs that had 4D-DSA examinations. One subject was excluded due to the poor pulsatility in the TCCs. Figure 3 shows an example of the ICA studies. Average ICA flow rates were also measured with the PC VIPR studies. Correlation between 2 measurements using 4D-DSA and PC VIPR is shown in Fig 4. Average ICA flow rates calculated using 4D-DSA and measured using PC VIPR are well-correlated, with the Pearson r = 0.835 and a significance level P = .0002. Figure 5 is the Bland-Altman analysis of 4D-DSA compared with PC VIPR, which shows all points within 2 SDs, with a bias of 6.5 cm/s and 2-SD limits of agreement of −3.56 cm/s and 16.5 cm/s.

A representative ICA study. A, The centerline positions of the ICA. B, The contrast waveform map of the voxels along the centerline. The highlighted area is the optimized waveform region for the flow calculation. C, The time-shift as a function of the centerline position was fit to a linear relation in which the slope is the inverse of the velocity.

Correlation analysis between velocity estimated from 4D-DSA and measured using PC VIPR. The significance level is P = .0002.

Bland-Altman analysis of 4D-DSA compared with PC VIPR.
Discussion
The shifted least-squares algorithm is a simple-but-robust method to calculate flow rates by finding the bolus transport time between any 2 points along the centerline and performing linear regression with the corresponding positions. The combination of the spatial and temporal data available in the 4D-DSA reconstruction provides the opportunity to apply this technique to measurement of blood flow in routine 4D-DSA acquisitions. The flow phantom study demonstrated that by using this method, we were able to calculate the flow rates with 11% relative root mean square error compared with ultrasonic flow probe measurements. Results from the 13 human ICAs showed that the calculated velocities from 4D-DSA studies correlated well with the measurements using the 3D phase-contrast MR imaging method. We believe that the reason for the higher velocities in the 4D-DSA studies compared with the PC VIPR measurements (6.5 cm/s bias) is the increment in flow caused by the intra-arterial power injection of contrast medium.
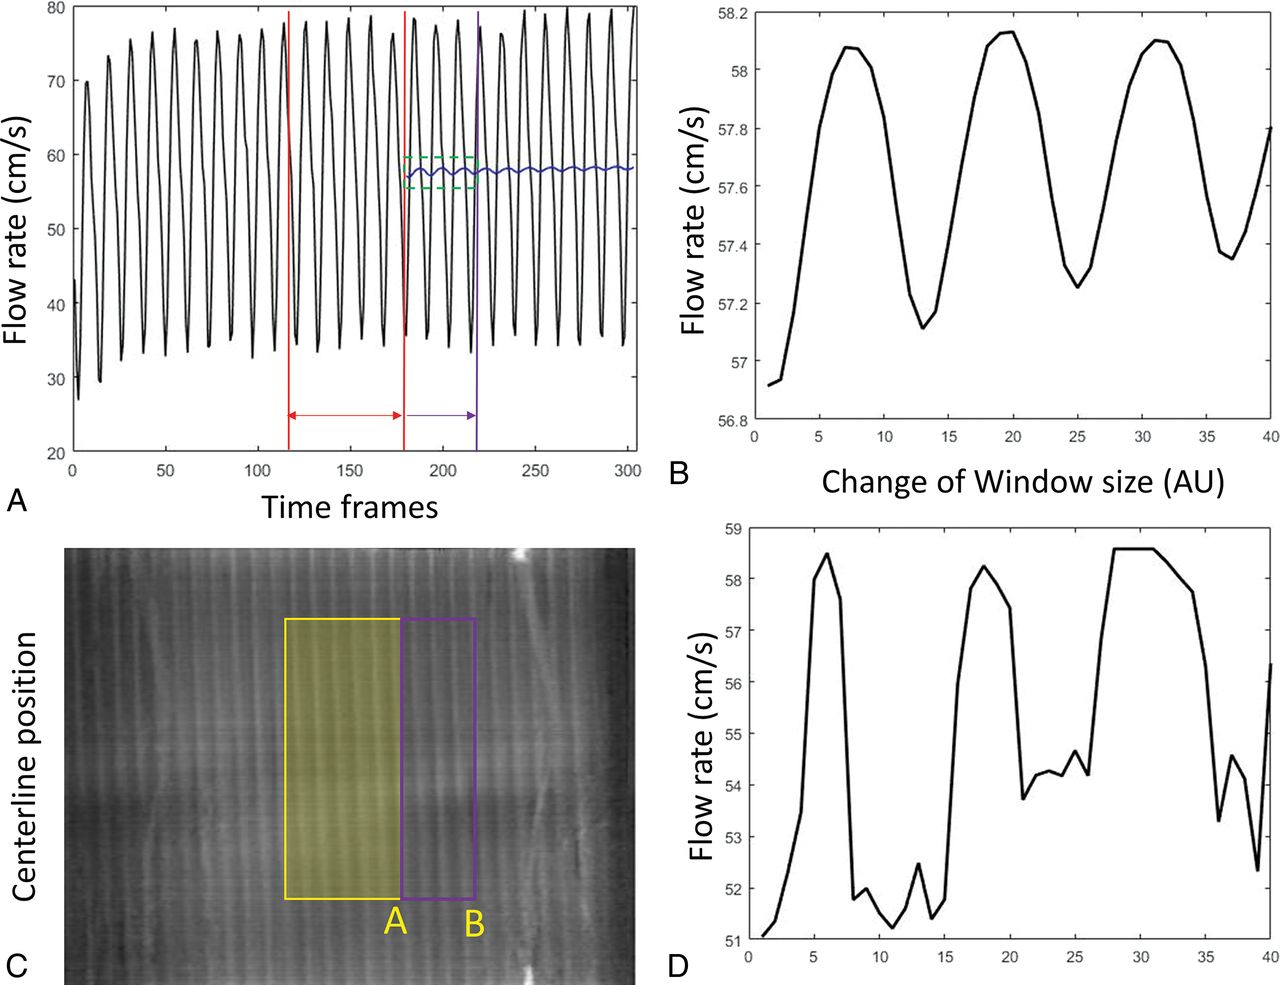
The proposed method calculates the mean flow rate within a selected window defined by the SBR map. This truncated average of pulsatile flow varies depending on the window size and location. This variation can be demonstrated in Fig 6A and B, where the average of the flow profile was performed with a gradually expanding average window. The truncated average oscillates depending on where the truncation window ends and eventually converges to the mean signal as the window expands. Similar oscillation has been observed in the flow calculation using 4D-DSA. Figure 6D shows the estimated average velocity changes as the right side of the window gradually expands as shown in Fig 6C. The current algorithm automatically selects a window purely on the basis of the SBR map so that the selected window range may fall anywhere between 4 and 6 pulsatile cycles. Further criteria could be included to trim the window to an integer number of pulsatile cycles to minimize this error.

Fluctuation of the velocity estimation with a different average range. A, The flow profile recorded from the flow probe. Red lines define the starting average window. This window was gradually expanded to the purple line. The corresponding mean velocity was shown as the blue curve. A zoom-in of the green window is shown in B. Similarly, velocity calculations have been performed by gradually expanding the window coverage from yellow to purple as shown in the waveform map (C). Estimated velocity varies (D) as the window edge slides from position A toward B. AU indicates arbitrary units.
The proposed algorithm worked best when there was good and consistent pulsatility in the 4D-DSA TCCs. With each cardiac cycle, as an intra-arterial contrast bolus is injected, there is an oscillation in the ratio of contrast medium to nonopacified blood. This pulsatility can be identified and extracted from the contrast waveform map by thresholding the SBR map. For vessels more distal to the contrast injection site where the pulsatility can be low, injection protocols should be modified to enhance the pulsatility strength or contrast kinetics. The present work focused on the evaluation of blood velocity within the ICAs. Investigation of more downstream segments, including the MCAs and basilar arteries, should be performed in the future.
Conclusions
4D DSA is a novel technique that provides both the geometric and temporal information required to measure blood flow velocity and flow. In this study, calculated velocity values from 4D-DSA TCCs correlated well with human ICA measurements derived from phase-contrast MR imaging and flow phantom measurements using an ultrasonic flow probe.
Footnotes
Disclosures: Gabe Shaughnessy—RELATED: Grant: National Institutes of Health.* Erick L. Oberstar—RELATED: Grant: University of Wisconsin, Madison, Comments: National Institutes of Health Grant R01HL116567*. Sebastian Schafer—UNRELATED: Employment: Siemens Healthineers, Comments: full-time employee. Michael A. Speidel—RELATED: Grant: Siemens Healthineers, Comments: Partial support was received from a research grant*; UNRELATED: Patents (Planned, Pending or Issued): Wisconsin Alumni Research Foundation, Comments: I am a coinventor on a Wisconsin Alumni Research Foundation patent (pending) on resolving artifacts in 4D angiographic data. Money of the patents was paid to Wisconsin Alumni Research Foundation. Charles A. Mistretta—RELATED: Grant: National Institute of Biomedical Imaging and Bioengineering, Comments: Strother/Mistretta R01 on 4DDSA*;UNRELATED: Patents (Planned, Pending or Issued): Wisconsin Alumni Research Foundation. Charles M. Strother—RELATED: Grant: University of Wisconsin School of Medicine and Public Health*; UNRELATED: Patents (Planned, Pending or Issued): Wisconsin Alumni Research Foundation, Comments: I have a pending IP for flow quantification; the IP is assigned to the Wisconsin Alumni Research Foundation. *Money paid to the institution.
This work was supported by the National Institutes of Health Center for Scientific Review 2R01HL116567 and Siemens Healthineers.
The concepts and information presented in this article are based on research and are not commercially available.
Indicates open access to non-subscribers at www.ajnr.org
References
- Received February 6, 2018.
- Accepted after revision June 11, 2018.
- © 2018 by American Journal of Neuroradiology


