
Abstract
BACKGROUND: Numerous studies have used structural neuroimaging to measure HIV effects on brain macroarchitecture. While many have reported changes in total brain volume, gray matter volume, white matter volume, CSF volume, and basal ganglia volume following HIV infection, quantitative inconsistencies observed across studies are large.
PURPOSE: Our aim was to evaluate the consistency and temporal stability of serostatus effects on a range of structural neuroimaging measures.
DATA SOURCES: PubMed, reference lists, and corresponding authors.
STUDY SELECTION: The meta-analysis included 19 cross-sectional studies reporting HIV effects on cortical and subcortical volume from 1993 to 2016.
DATA ANALYSIS: Random-effects meta-analysis was used to estimate individual study standardized mean differences and study heterogeneity. Meta-regression was used to examine the effects of the study publication year.
DATA SYNTHESIS: Meta-analysis revealed standardized mean differences related to the serostatus of −0.65 (P = .002) for total brain volume, −0.28 for gray matter volume (P = .008), −0.24 (P = .076) for white matter volume, and 0.56 (P = .001) for CSF volume. Basal ganglia volume differences related to serostatus were not significant. Nevertheless, estimates of between-study heterogeneity suggested that much of the observed variance was between studies. Publication year was associated with recent reductions in many neurostructural effects.
LIMITATIONS: Many studies pooled participants with varying durations of treatment, disease, and comorbidities. Image-acquisition methods changed with time.
CONCLUSIONS: While published studies of HIV effects on brain structure had substantial variations that are likely to result from changes in HIV treatment practice during the study period, quantitative neurostructural measures can reliably detect the effects of HIV infection during treatment, serving as reliable biomarkers.
ABBREVIATIONS:
- ART
- antiretroviral therapy
- CSFv
- CSF volume
- GMv
- gray matter volume
- SMD
- standardized mean difference
- TBv
- total brain volume
- WMv
- white matter volume
Since the onset of the AIDS epidemic, it has been known that HIV can have deleterious effects on both brain structure and function. In early studies using structural neuroimaging to measure brain macroarchitecture and microarchitecture, effects in HIV groups were due largely to opportunistic infections and HIV encephalitis.1 The advent of combination antiretroviral therapy (ART), promoting immune system reconstitution, markedly decreased the incidence of CNS opportunistic infection and acute HIV encephalitis.2 In the ensuing decades, HIV serostatus effects on brain structure have been consistently reported, with clear effects on WM microstructure.3 Nevertheless, peripheral viral suppression has not always prevented progressive cognitive and motor impairment, and the origin of these behavioral effects during treatment is still debated, with several ART-era studies demonstrating structural associations with cognitive deficits during treatment.4⇓–6
Early brain structural studies in HIV-infected participants found decreases in brain parenchyma,7 white matter,8 and basal ganglia7,9 volume. During the ART era, observations of cortical,10 subcortical, gray matter,9 and white matter10 atrophy have continued, with decreases in cortical gray matter and brain parenchymal volume observed even in the first year of HIV infection.11 While many studies have reported reduced total brain volume (TBv), total gray matter volume (GMv), white matter volume (WMv), basal ganglia volume, or increased CSF volume (CSFv) following HIV infection, quantitative inconsistencies observed across studies are large. The source of these inconsistencies is unclear, with possible mechanisms including image-acquisition methods, infection duration, ART treatment effects, sample demographics, and comorbidities commonly seen in seropositive patients.
To determine whether structural neuroimaging reveals consistent serostatus effects, we examined structural MR imaging studies in HIV-infected subjects, using meta-analytic techniques to explore the consistency of quantitative differences detected in structural neuroimaging studies from 1993 to 2016. Measures examined included TBv, GMv, WMv, CSFv, and subcortical GMv. We also investigated whether the observed HIV effects on brain structure are stable with time or have changed. Given that ART effectively suppresses peripheral viral load and allows immune system reconstitution, concurrent cessation of brain injury seems likely. We, therefore, expected that the structural effects of HIV infection would diminish in more recent HIV neurostructural studies that included large percentages of HIV-infected participants receiving ART.
Materials and Methods
Meta-Analysis of HIV Effects on Brain Structure
To summarize the literature on HIV effects on brain structure, we followed Preferred Reporting Items for Systematic Reviews and Meta-Analyses (PRISMA)12 standards. Six PubMed computerized searches were performed on September 25, 2016, with the following terms: “HIV” and “structural and MR imaging brain” yielded 77 records; “HIV” and “MR imaging” and “basal ganglia atrophy” yielded 42 records; “HIV” and “MR imaging” and “caudate atrophy” yielded 24 records; “HIV” and “MR imaging” and “gray matter atrophy” yielded 38 records; “HIV” and “MR imaging” and “gray matter” yielded 102 records; and “HIV” and “MR imaging” and “brain volume” yielded 112 records. Of these 395 records, 151 were duplicates, leaving a total of 244 records to be examined. An additional 13 records were added from the reference lists of articles, resulting in 257 articles to be screened. Of the 257 articles screened on the first pass by reading the abstract, 182 were excluded if they were the following: 1) animal studies, 2) review articles, 3) not written in English, 4) case reports, or 5) without seronegative controls, leaving 75 full-text articles to be assessed for eligibility. Thirty-eight of 75 full-text articles assessed for eligibility were excluded for the following reasons: 1) They were review articles, 2) they did not have seronegative controls, 3) they did not study quantitative HIV effects on brain volume, or 4) they studied the association of serostatus and brain volume with neuropsychological performance, and 5) they did not provide a means of contacting the authors. Of the 38 eligible full-text articles, 19 studies completed between 1993 and 2016 were included in the meta-analysis, with 9 studies reporting TBv,7,11,13⇓⇓⇓⇓⇓–19 10 reporting GMv,8,10,11,13,16⇓–18,20⇓–22 10 reporting WMv,8,10,11,13,16⇓–18,20⇓–22 12 reporting CSFv,7,8,10,13,14,17,18,20⇓⇓⇓–24 8 reporting caudate volume,4,7,11,18⇓–20,25,26 7 reporting putaminal volume,4,7,11,18,19,25,26 and 6 reporting globus pallidus volume.7,10,11,18,19,25 If the requisite numbers could not be located in the text or accompanying tables, ≥1 attempt was made to contact the corresponding authors of 20 studies for more information. Five authors responded and provided the requisite additional information. The remaining 19 studies, listed in the On-line Appendix, were excluded because the data were no longer available, the data could not be shared, or the authors did not respond to inquiries (Fig 1).

Meta-analysis flow diagram for study selection.
Statistical Analysis
Mean structural values and their SDs for TBv, GMv, WMv, CSFv, caudate volume, putaminal volume, and pallidum volume were taken from the article tables and converted into consistent units.
We used R statistical and computing software, Version 3.4.1 (http://www.r-project.org) and the meta-analysis package meta27 to estimate the standardized mean difference (SMD) in TBv, GMv, WMv, and CSFv and caudate, putaminal, and pallidum volumes for each study; then, we calculated a weighted average of these estimates across studies. The metacont function from meta uses the same estimator as RevMan5 (http://community.cochrane.org/tools/review-production-tools/revman-5/revman-5-download). This is a version of the standardized mean difference called Hedges g, based on the pooled sample variance. Random-effects models were used to test for serostatus group effects. The I2 statistic, representing the proportion of between-study variation due to heterogeneity, was used to estimate study inconsistency.28 τ2 was computed as an estimate of between-study variance, with values of >1 suggesting substantial heterogeneity. Forest plots were used to visualize variations in standardized mean differences across studies. Radial plots were used to visualize study heterogeneity, with less precise effect estimates lying near the origin and more precise estimates occurring farther away. Study bias was explored by examining funnel plots of sample size versus effect size. Meta-regression was used to examine imaging protocol and publication year effects.
Results
Serostatus Effects
Random-effects meta-analysis of TBv revealed a reduction (SMD = −0.58) related to serostatus (test of SMD = 0: z = −3.1, P = .0018), with study heterogeneity Q = 26.1 (df = 8), P = .001; and τ2 (variation in SMD attributable to heterogeneity) = 69%. The τ2 of between-study variance was 0.23. Five of the 9 studies had confidence intervals that included zero (Fig 2A).

Total brain volume standardized mean differences across studies comparing seropositive with seronegative participants. A, Forest plot. B, Funnel plot. C, Radial plot.
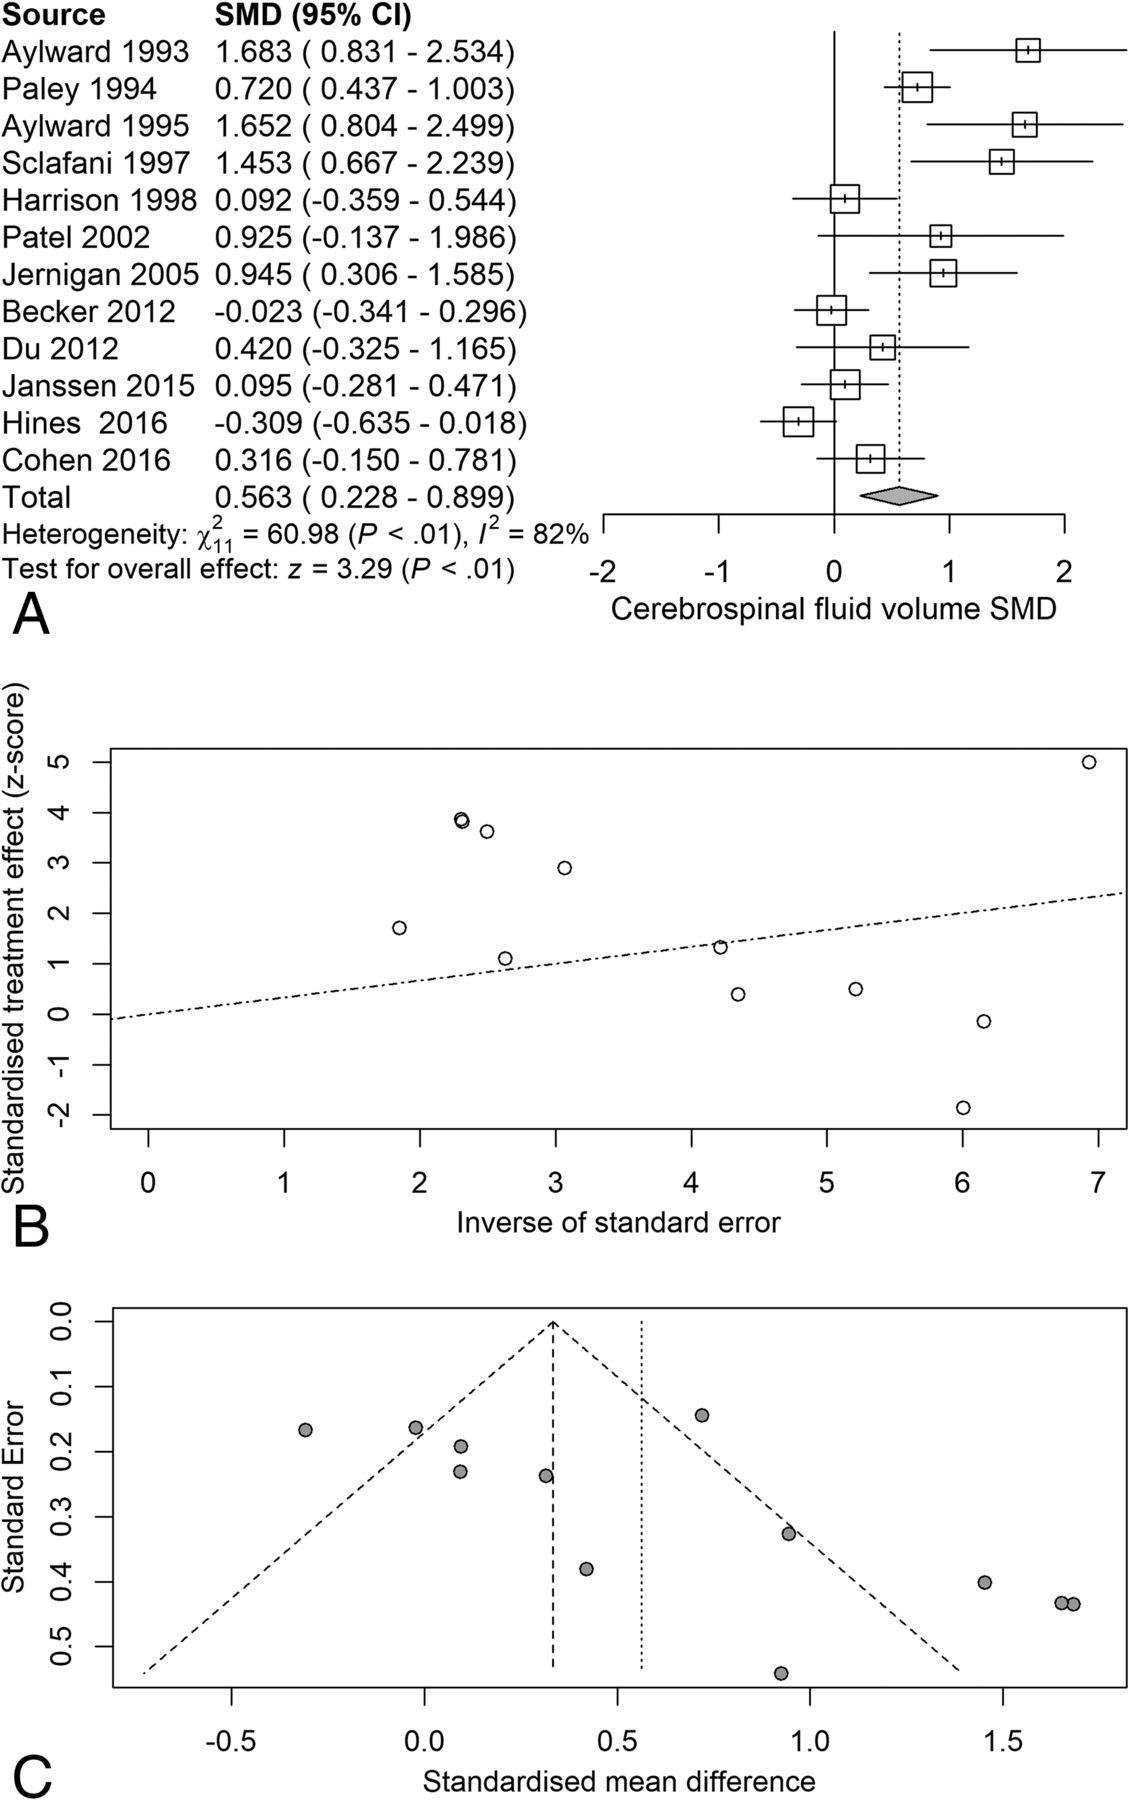
Next, we examined the serostatus effects on individual tissue compartments. Analysis of GMv revealed a reduction (SMD = −0.28) related to serostatus (test of SMD = 0: z = −2.65, P = .0081), with study heterogeneity Q = 14.8 (df = 9), P = .096, I2 = 39%, and τ2 = 0.04. Seven of the 10 studies had confidence intervals that included zero (Fig 3A). Analysis of WMv revealed a nonsignificant reduction (SMD = −0.24) related to serostatus (test of SMD = 0: z = −1.78, P = .076), with study heterogeneity Q = 24.3 (df = 9), P = .004, I2 = 63%, and τ2 = 0.11. Nine of the 10 studies had confidence intervals that included zero (Fig 4A). Analysis of CSFv revealed an increase (SMD = 0.56) related to serostatus (test of SMD = 0: z = 3.29, P = .001), with study heterogeneity Q = 61 (df = 11), P < .001, I2 = 82%, and τ2 = 0.26 (Fig 5A).

Gray matter standardized mean differences across studies comparing seropositive with seronegative participants. A, Forest plot. B, Funnel plot. C, Radial plot.

White matter standardized mean differences across studies comparing seropositive with seronegative participants. A, Forest plot. B, Funnel plot. C, Radial plot.

CSF standardized mean differences across studies comparing seropositive with seronegative participants. A, Forest plot. B, Funnel plot. C, Radial plot.
Although the included studies had a large range of group sample sizes, ranging from 5 to 85, it is possible that the known tendency for small-sample neuroimaging studies to go unpublished might have contributed to publication bias effects. Panel C of Figs 2⇑⇑–5 shows funnel plots of the estimated treatment effects against a measure of their precision, here the standard error. All show asymmetry consistent with small-study effects. If small-study effects were absent, the treatment effects of all studies should be distributed symmetrically around the average treatment effect. In addition, linear regression tests of funnel plot asymmetry were statistically significant for TBv (P = .001), GMv (P = .008), WMv (P = .025), and CSFv (P = .014). These results could reflect reporting bias because it is unlikely that small neurostructural studies that have failed to detect serostatus effects would find a place in most neuroimaging journals. Thus, the observed average effect sizes for each tissue compartment may reflect overestimates of their true values. Future studies may mitigate these effects owing to the increasing willingness of investigators to participate in more open data sharing, allowing aggregation and re-analysis of data that might not have shown serostatus effects in their original samples.
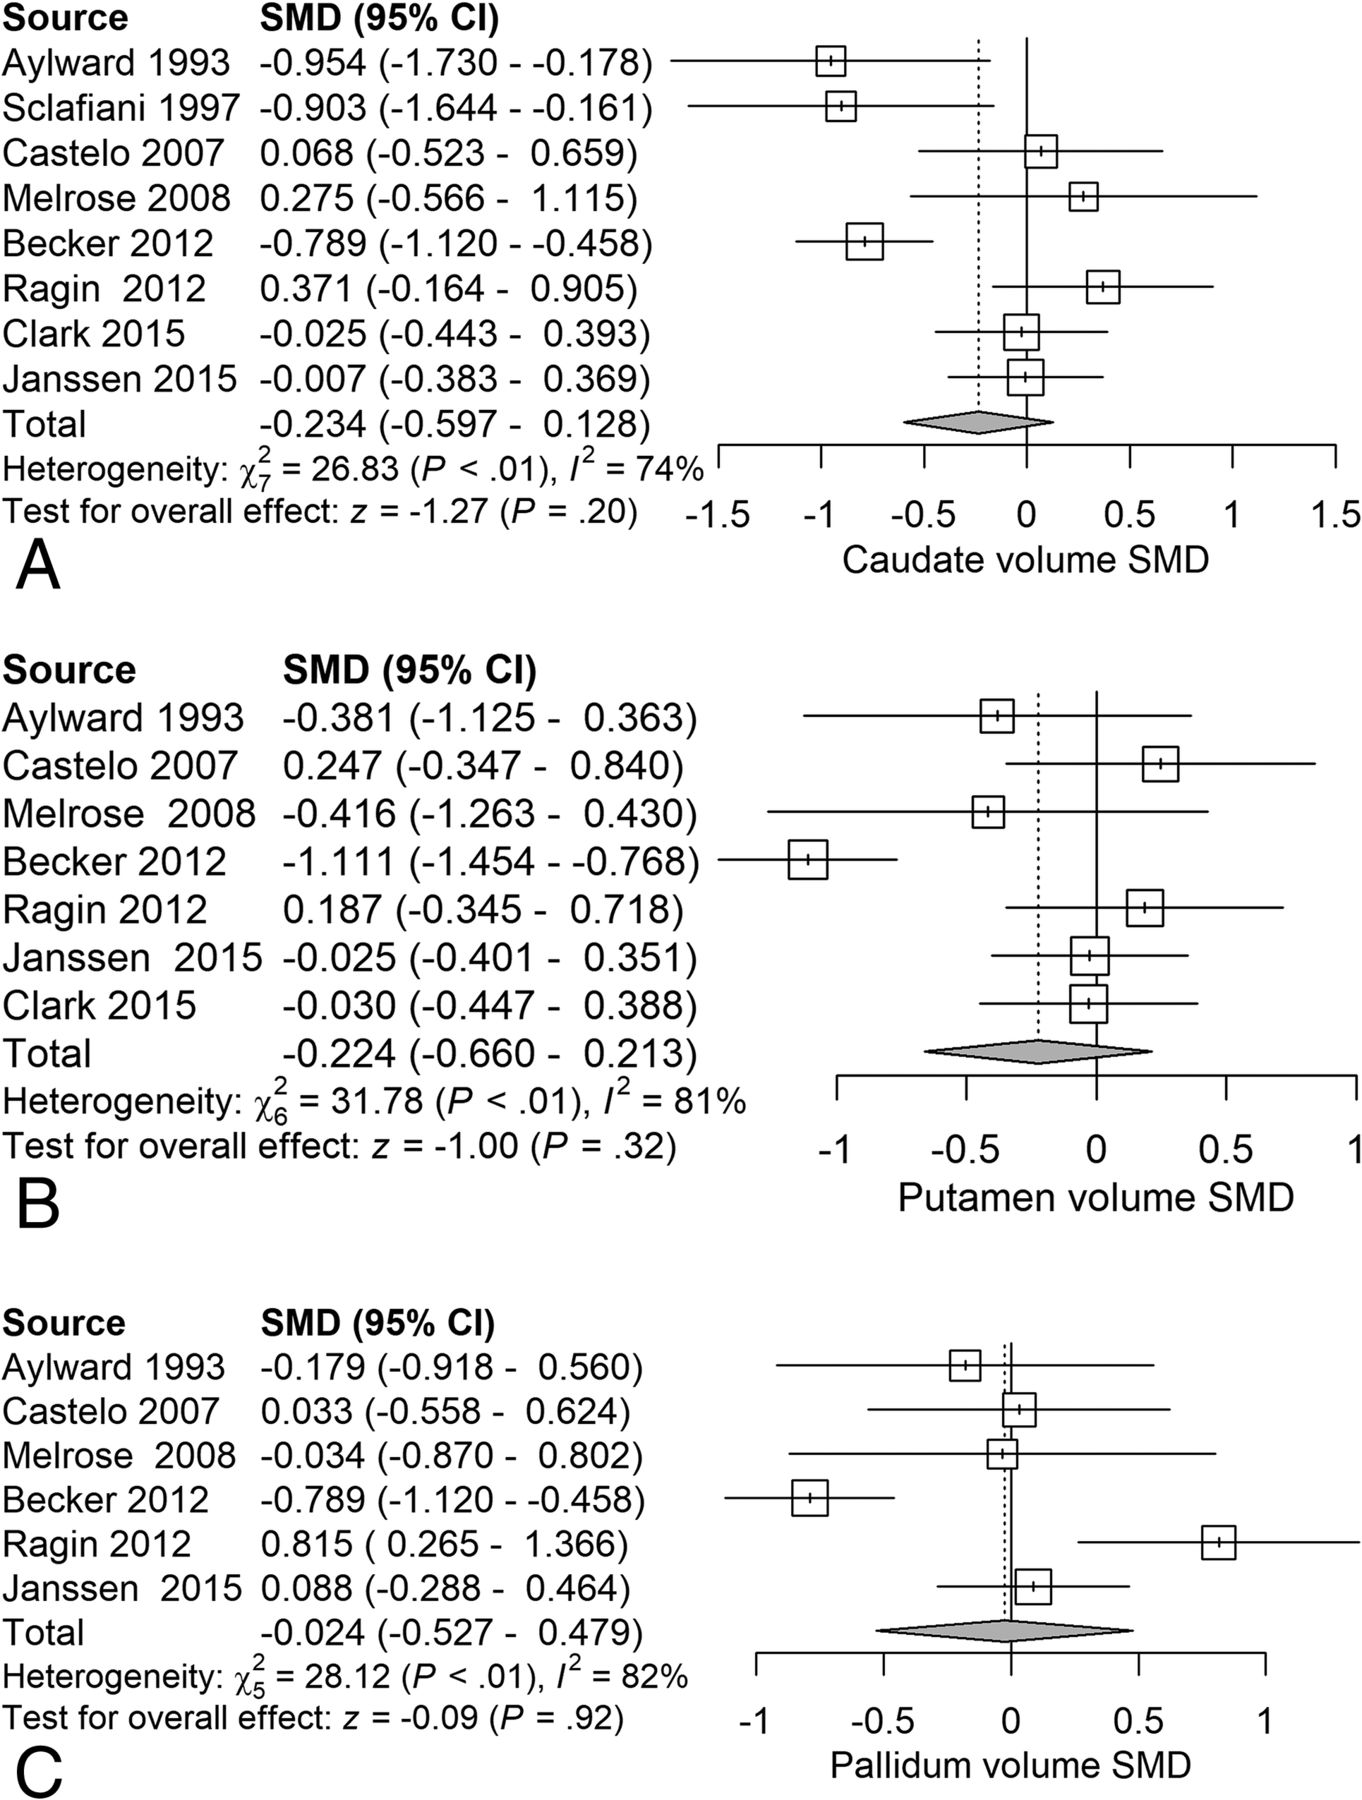
Next, we examined the serostatus effects on basal ganglia structures. Analysis of caudate volume revealed a nonsignificant reduction (SMD = −0.23) related to serostatus (test of SMD = 0: z = −1.27, P = .20) (Fig 6A). Analysis of putaminal volume revealed a nonsignificant reduction (SMD = −0.22) related to serostatus (test of SMD = 0: z = −1.00, P = .32) (Fig 6B). Analysis of pallidal volume revealed a nonsignificant reduction (SMD = −0.024) related to serostatus (test of SMD = 0: z = −0.09, P = .92) (Fig 6C).

Forest plots of basal ganglia gray matter showing standardized mean differences across studies comparing seropositive with seronegative participants A, Caudate volume. B, Putamen volume. C, Pallidal volume.
Covariate Effects
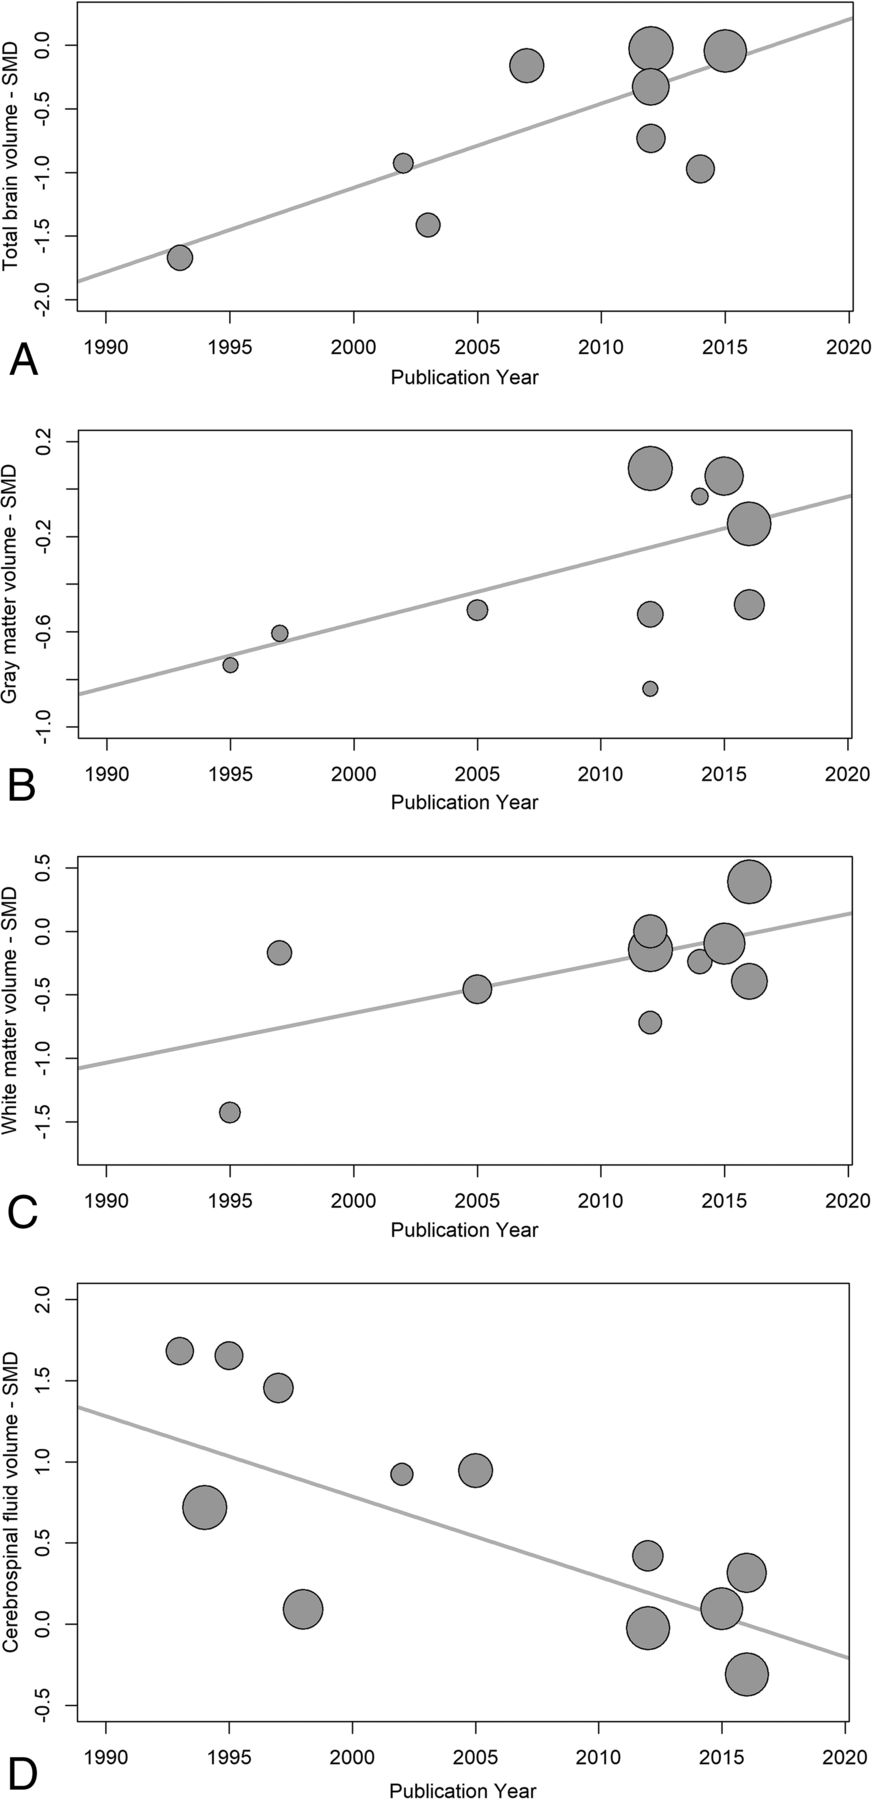
Temporal changes in serostatus effects were investigated using random-effects meta-regression, examining changes in SMDs for each measure with time. TBv SMDs became smaller with publication year, reflecting less volume loss in the seropositive group (P = .003). WMv SMDs also became smaller, with less seropositive volume loss (P = .028), and CSFv SMDs became smaller with time, reflecting less CSFv increase related to seropositivity (P < .001). GMv SMDs also became smaller with time, but this effect was not statistically significant (P = .086) (Fig 7). Possible small-sample effects are shown in the On-line Figure.

Publication year influence on serostatus effects. These are plots of structural brain measure standardized mean differences and their corresponding regression lines, for total brain volume (A) P = .001, gray matter volume (B) P = .086, white matter volume (C) P < .001, and CSF volume (D) P < .001. The plot circle area is inversely proportional to the estimated SMD variance.
Summaries of image acquisition protocols revealed that earlier studies tended to use 1.5T MR imaging systems and large voxels, while more recent studies used 3T MR imaging systems and smaller voxel volumes (On-line Table 1). Field strength and voxel volume are expected to have opposing effects on image SNR; thus, their effects may cancel each other out. Meta-regression revealed that there were no effects of field strength and voxel size on SMD. Because these 2 variables were confounded with publication year, it was not possible to examine their individual contributions statistically.
Summaries of participant clinical characteristics revealed that the more recent studies had a higher proportion of participants receiving ART, the treatment with the highest known efficacy (On-line Table 2). Use of combined therapies makes treatment more effective and reduces the risk of developing drug resistance. While illegal drug use was an exclusion criterion in 7/19 studies, in 10/19 studies drug use was not described (On-line Table 3). In the 2 studies reporting hepatitis status, a single participant was affected.7,8
Discussion
Summary of Results
In a quantitative meta-analysis of HIV neurostructural studies reported from 1993 to 2016, spanning the widespread introduction of antiretroviral treatment, we observed that serostatus was, on average, associated with decreases in TBv and GMv and concomitant CSFv increases. Serostatus effects in all tissue compartments, except gray matter, have diminished with time, suggesting that widespread use of ART has resulted in a decline in macroscopic neurostructural changes. Nevertheless, small effects in TBv, GMv, and CSFv do persist in treated seropositive patients.
HIV Effects on Total Brain and CSF Volume
TBv and CSFv in HIV are believed to reflect global atrophy. While qualitative and quantitative studies have demonstrated global atrophy in HIV, more recent studies have reported no differences in TBv,11,29 one in subjects infected with HIV for <1 year,11 suggesting that shorter illness duration before initiating treatment can decrease HIV-associated cerebral atrophy. HIV-associated global atrophy, however, may also be related to drug and alcohol abuse effects and other life stressors commonly seen in the HIV-infected population.30⇓–32
HIV Effects on Gray Matter Volume
Effects of HIV infection on cortical gray matter are less well-documented in the neuropathologic literature but include astroglial proliferation and glial atrophy.33 Cortical metabolite changes include NAA/Cr reductions34 and mIns/Cr and Cho/Cr increases.35
The articles used in the meta-analysis of HIV effects on GMv incorporated both cortical and subcortical gray matter under gray matter volume. Nearly 80% of post-antiretroviral therapy era studies assessed for eligibility in our analyses reported HIV-associated decreases in GMv, with several specifically reporting HIV-related cortical GMv reductions.10,11 Nevertheless, more recent literature includes multiple studies that find no HIV GMv effects, suggesting that ART treatment initiation diminishes gray matter loss. While GMv loss does persist in the ART era, there are strong associations between decreasing serostatus effects and more recent publication.
HIV Effects on White Matter Volume
Of the studies meeting eligibility requirements, our analysis found that ART may have a weak influence on HIV-associated WMv reductions. Our meta-analysis confirms that the degree of macrostructural WMv loss diminishes rapidly in the ART era. Nevertheless, there is evidence of microstructural changes persisting in HIV infection in the ART era,3 suggesting that DTI may be more sensitive in detecting HIV white matter serostatus effects.3
HIV Effects on Basal Ganglia Volume
There is ample evidence of the early and enduring influence of HIV on the basal ganglia. Neuropathologic findings demonstrate macrophages, microglia, and high concentrations of viral proteins in the basal ganglia.36 Metabolic studies found basal ganglia hypermetabolism in the early and middle stages of HIV infection,37 followed by hypometabolism with disease progression.38 Behavioral manifestations reflecting HIV effects on the basal ganglia included voluntary movement impairment and compromised executive function.39,40
Before the introduction of ART, structural HIV studies reported decreased basal ganglia volumes,7 particularly in the caudate nuclei, that were associated with dementia.41 Viral load has been reported to be highest in the caudate nuclei,42 possibly due to the proximity to the virus-enriched CSF. Dopaminergic neurons are particularly susceptible to HIV neurotoxic effects.43 Basal ganglia volume loss is associated with psychomotor slowing44 and may be an important predictor of cognitive impairment. While HIV-associated reductions in basal ganglia volume are still reported in the ART era,45 more recent studies failed to demonstrate serostatus effects on the basal ganglia, likely related to earlier and more effective treatments. Nevertheless, to isolate possible serostatus effects on basal ganglia structure in the setting of the observed high between-study heterogeneity, further work using aggregated multisite data with subject-level information allowing estimation and isolation of comorbid neurostructural moderating influences is warranted.
Sources of Between-Study Variability
Several potential sources contributed to the variability in the study effects included in our meta-analysis. First, differences in MR imaging acquisition parameters included field strengths ranging from 1.5T to 3T and voxel volumes ranging from 5.5 to 0.647 mm3. Second, there was wide variation in the demographic characteristics of the study cohort. For example, Sarma et al16 and Cohen et al22 examined TBv in young perinatally infected adolescents with mean ages of 17 and 13 years, respectively, while the cohort studied by Hines et al21 had a mean age of 59 years. Third, variation in sample comorbidities, including recreational drug use and antiretroviral therapy treatment type, was high. While ART effects on brain structure are difficult to isolate in cross-sectional studies with wide ranges of disease and treatment duration, our data suggest that ART does have a strong protective effect on brain macrostructure.
Temporal Variation in HIV-Related Brain Atrophy
The serostatus-associated reductions in TBv, GMv, and WMv and increases in CSFv effects vary with study age. Older studies demonstrated larger effects, with differences in WMv and subcortical GMv virtually disappearing in recent years. One possible explanation for this variation is the difference in field strengths. Earlier studies used 1.5T systems, and later studies predominantly used 3T systems. Another possible explanation is differences in voxel size, with later studies having smaller voxel sizes. Meta-regression, however, revealed that there were no independent effects of field strength and voxel size. It is unlikely that these acquisition changes contributed to the progressive reduction in serostatus effects observed because brain structure quantification would be expected to be more accurate in studies using smaller voxels, with diminished partial volume effects. The most likely explanation for the temporal variation in HIV-related brain atrophy is the duration of untreated or partially treated illness. In the oldest study included in our meta-analysis,7 which also had the greatest HIV-related brain atrophy, 62.5% of participants were treated with zidovudine or didanosine single therapy and 37.5% were untreated. In more recent studies, almost all subjects were treated with combination ART, implying that subjects are on a combination of at least 3 different drugs from 2 of the major antiretroviral therapy classes. Combined therapies make treatment more effective and reduce the risk of developing drug resistance. While the associated reductions in viral load and immune reconstitution do appear to have a role in preservation of brain structure,5 brain volume losses are still evident in treated seropositive patients.
There are several potential etiologies of the persistent volume losses in treated HIV-infected participants. Irreversible pretreatment CNS damage is a possibility. Alternatively, chronic subclinical CNS inflammation despite ART has been documented46 and may contribute to progressive brain atrophy. Neurotoxicity associated with ART, relatively underexplored, is another potential mechanism for progressive brain atrophy,47 a possibility that might be explored using longitudinal designs. With other measures, there is weak evidence of progressive HIV-induced CNS changes during ART. One study that examined treated seropositive subjects using DTI demonstrated greater-than-normal age-related increases in diffusion in the corpus callosum for 1 year compared with seronegative controls, indicating progressive white matter microstructural changes in HIV.48 Another DTI study looking at a small longitudinal HIV-infected cohort observed increased corpus callosum and centum semiovale diffusion after 6 months of ART.49
The comorbidities commonly associated with HIV may also contribute to brain atrophy in treated HIV infection. Illicit drug use such as methamphetamines, cocaine, opiates, and cannabinoids, common in HIV-infected participants,50 has been associated with structural brain abnormalities.30,31 In the studies included in the meta-analyses, many did not address drug use. Fifty-three percent of studies did not have drug use as an exclusion criterion, and inclusion of participants who used drugs was only described in 47% of studies. Although concomitant or previous drug use may have contributed to the observed structural changes, any quantitative effects could not be determined from the available data. Although it has been suggested that comorbid hepatitis C infection may contribute to HIV-associated neurostructural abnormalities, hepatitis C status was not reported by most articles. HIV infection predominates in lower socioeconomic groups who may have brain structure differences arising from other sources.32 Finally, HIV infection is associated with an increased incidence of cardiovascular risk factors such as diabetes, smoking,51,52 and chronic obstructive pulmonary disease,53 all associated with accelerated brain aging.51,54
Relation to Cognitive Effects
HIV-associated structural effects persist in treated cohorts, particularly in total GMv, albeit to a decreased degree. There is also evidence that progressive regional changes in GMv and WMv are associated with cognitive decline in treated HIV participants. In a study with 94% of participants treated with ART, impaired motor function was associated with basal ganglia gray matter atrophy.55 A study with 100% ART-treated subjects demonstrated a correlation between cortical thinning and reduced psychomotor speed.56 Another study of 100% ART-treated subjects revealed correlations between decreased TBv and reduced motor function and processing speed, and decreased thalamic volumes with reduced motor function.18 Impaired executive function correlated with decreased basal ganglia volumes in another study of treated subjects with HIV.9 Regional structural effects may therefore potentially serve as markers of fixed or progressive cognitive motor impairment, but this possibility may be best explored using longitudinal designs.
Study Limitations
As with most meta-analyses, not all eligible studies were included in this study due to inaccessibility of data. Publication bias resulting from the tendency not to publish negative results from small imaging studies may also be a factor. There were many sources of demographic variability among the included studies, such as participants' infection duration, treatment status, age, educational level, and the presence of comorbidities that may also affect brain structure. Finally, there were MR imaging acquisition parameter differences across the included studies. Nevertheless, meta-regression results did not suggest that these acquisition differences contributed to serostatus effects on brain macrostructure.
Conclusions
Published studies indicate that regional brain atrophy results from HIV infection, with serostatus effects often more pronounced in neurologically impaired subjects. This study provides a quantitative meta-analysis of neurostructural changes related to serostatus in HIV-infected participants, with TBv, GMv, and CSFv all showing reliable serostatus effects. While older studies in our meta-analysis demonstrated larger effect sizes, smaller HIV-related volume change was still seen in more recent studies in which all or most participants received ART. HIV effects on brain structure showed substantial between-study variation, which likely resulted from changes in HIV treatment practice during the study period. It remains unclear whether the persistent neurostructural effects of HIV infection are secondary to the following: 1) initial brain injury occurring before ART treatment; 2) subclinical neuroinflammation persisting despite ART; 3) ART neurotoxicity; or 4) common HIV comorbidities. Longitudinal studies of HIV-infected participants and meta-analysis approaches incorporating subject-level data are needed to pursue these possibilities in more detail.
Acknowledgments
We gratefully acknowledge the assistance of Drs Becker, Ragin, Jernigan, Archibald, Cohen, and Janssen for providing information not given in the original articles.
Footnotes
This work was partially supported by the Comprehensive NeuroAIDS Center grant (P30MH0921777).
Indicates open access to non-subscribers at www.ajnr.org
References
- Received March 29, 2017.
- Accepted after revision August 13, 2017.
- © 2018 by American Journal of Neuroradiology


Jump to section
Related Articles
Cited By...
- Large-scale brain network analysis reveals functional-structural dissynchrony in HIV-associated asymptomatic neurocognitive disorders: Functional disturbances precede structural changes
- Neurocognitive Dysfunction With Neuronal Injury in People With HIV on Long-Duration Antiretroviral Therapy
- Dopamine, Immunity, and Disease
- Association of White Matter Hyperintensities With HIV Status and Vascular Risk Factors
- Smaller limbic structures are associated with greater immunosuppression in over 1000 HIV-infected adults across five continents: Findings from the ENIGMA-HIV Working Group
- Global and regional brain hypometabolism on FDG-PET in treated HIV-infected individuals