
Abstract
BACKGROUND AND PURPOSE: Declines in both functional activation and functional connectivity have been reported in patients with sickle cell disease. In this study, we derived the functional and default mode responses to a word stem paradigm in age-, ethnicity-, and background-matched subjects with sickle cell disease and control groups, with the aim of testing whether both networks were similarly attenuated and whether the changes were related to physiologic parameters that characterize sickle cell disease.
MATERIALS AND METHODS: Both the functional and default mode responses were obtained from age- and background-matched controls and the sickle cell population by using a visually presented word stem paradigm on a 3T scanner.
RESULTS: We observed an attenuated response to both activation and deactivation in the sickle cell disease group. There were no significant differences in the activation response between the 2 groups for the contrast control > sickle cell disease; however, significant differences were observed in the medial parietal cortex, the auditory cortex, and the angular gyrus for the default mode. For the sickle cell group, a significant correlation between the activation z scores and the physiologic parameters was observed; for the deactivation, the results were not significant but the trend was similar.
CONCLUSIONS: The results indicate that the physiologic parameters modulate the activation in the expected fashion, but that the effect was weaker for deactivation. Given that significant differences between the 2 groups were only seen for deactivation, additional factors must modulate the deactivation in sickle cell disease.
ABBREVIATIONS:
- BOLD
- blood oxygen level–dependent
- DM
- default mode
- GLM
- General Linear Model
- SCD
- sickle cell disease
Sickle cell disease (SCD) is a hereditary condition that can cause ongoing hemolytic anemia and vaso-occlusion, which can subsequently cause irreversible organ damage. Individuals with SCD are also at an increased risk for ischemic insult to the brain, and both overt1⇓⇓–4 and silent-type strokes5⇓–7 have been shown to cause neurocognitive deficits. However, studies involving large numbers of neurologically asymptomatic children and adults with SCD have shown that cognitive impairment occurs even in the absence of structural brain abnormalities on MR imaging.8⇓–10 Even though the method of neurocognitive assessment varied among these studies, intellectual ability, executive functioning ability, and visual-spatial memory were usually the cognitive areas most likely to be affected.11 These observations support an emerging consensus that brain injury in SCD is diffuse and insidious12 and that conventional neuroimaging is prone to underestimating the extent of injury.
Thus, advanced neuroimaging techniques are warranted to better detect differences in SCD. Significant differences in gray matter volumes have been shown in patients with SCD compared with healthy controls.8 In addition, white matter changes have been discovered in patients with SCD by means of voxel-based morphometry, even in the absence of overt stroke.10 One article comparing patients with SCD with and without prior stroke demonstrated white matter “density” abnormalities in multiple, anatomic regions.10 Diffusion-weighted imaging has also been attempted with Tract-Based Spatial Statistics (TBSS; http://fsl.fmrib.ox.ac.uk/fsl/fslwiki/TBSS) to reveal reduced anisotropy and increased diffusivity in subjects with SCD compared with healthy controls, particularly in areas involving the corpus callosum and centrum semiovale.13
In addition to the aforementioned neuroimaging techniques, functional MR imaging seems to be a promising method for studying neurologic changes. Indeed, fMRI can be used to assess not only task-based activation but also deactivation, (ie, rest versus task). One of the most commonly studied networks assessed during rest is the default mode (DM) network. The DM network can be defined with either resting-state14 or task-driven fMRI.15
However, fMRI seems to be underused in SCD because there have been relatively few studies published using this neuroimaging technique, to our knowledge. One possible explanation may be the difficulty in determining whether the changes in the blood oxygen level–dependent (BOLD) effect are due to neurologic differences or possible differences in the hemodynamic properties of SCD. While the hemodynamic properties associated with anemia and SCD have been shown to alter the resting perfusion rate of the brain, the degree to which the changes in perfusion, oxygenation, and blood volume affect the BOLD response is unclear. The studies using fMRI have produced mixed results, depending on whether they were assessing deactivation or activation. One activation study using a visual paradigm for fMRI did find that the BOLD response was attenuated in children with SCD.16 Resting-state fMRI studies have reported that pain can alter the connectivity between the DM regions and pro- and antinociceptive structures in SCD.17 Additionally, connectivity of the medial parietal cortex, one of the main elements of the DM network, was shown to be higher in patients with SCD compared with controls.18
Given these findings, 1 advantage of using a task-driven approach to define the DM network is that the same paradigm can be used to derive the activation and responses, so that any hemodynamic differences between the patient and control populations will equally affect the activation and deactivation BOLD responses. Because the DM network is implicated in many aspects of brain function15 and disruption of the DM has been reported to negatively impact attention, working memory, and emotional capacity,19 an altered DM network in SCD may account for the some of the neurocognitive changes associated with SCD. While the core elements of the DM network are now well-defined, some areas show more variable deactivation, with the presence and/or strength of the deactivation being modulated by the nature of the stimulus.20,21
In this study, we used fMRI with a visually presented block word stem paradigm to derive the functional and DM responses from age- and background-matched subjects with SCD and control groups. In the subjects with SCD, we also recorded physiologic parameters that can be used to characterize the BOLD response and correlated these with the functional and DM responses. Our main aim was that with the same task for both activation and deactivation responses, we could better characterize neurologic differences between subjects with SCD and control groups.
Materials and Methods
Participants
This prospective study was approved by the institutional review board. The subjects with SCD had the homozygous form of SCD (HbSS), no history of stroke, normal blood velocities on routine screening with transcranial Doppler sonography, and no reported developmental delay. In addition, any prior neuroimaging performed as part of their standard of care had to have normal findings for inclusion in the study. The control group was composed of siblings or demographically matched peers of the prospective SCD group, who had either sickle cell trait or were healthy and had no history of serious illness, brain surgery, or developmental delay, to limit potential confounds. Physiologic variables that were expected to affect the BOLD response, specifically hemoglobin level, mean corpuscular volume, percentage of fetal hemoglobin, and percentage of sickle cell hemoglobin, were recorded for the patients with SCD. For both groups, the lower and upper age limits for this study were 10 and 21 years of age.
Neuropsychology
A number of neuropsychological measures were administered to each subject to determine whether significant differences were observed between the SCD group and the control group in cognitive ability. The measures included the following: measures of intelligence (Wechsler Abbreviated Scales of Intelligence); working memory (Wechsler Intelligence Scale for Children, Fourth Edition, Digit Span subtest); attention/executive functioning (Conners Continuous Performance Test, Second Edition; Delis-Kaplan Executive Function System; Tower of London, Second Edition, Drexel version; and the Behavioral Rating Inventory of Executive Functioning); and memory (Wide Range Assessment of Memory and Learning, Second Edition; and Children's Memory Scale). Scores are reported in standard scores (mean of 100 with a SD of 15), in which ranges that extend 0.6, 1.3, and 2 SDs from the mean are equivalent to the average, low average, and impaired ranges respectively.
Between-group differences were analyzed by using SPSS 22.0 statistical software (IBM, Armonk, New York) with an α level set to .05. Independent-samples t tests were conducted to compare the SCD and control groups across the neuropsychologic measures.
Image Acquisition
MR images from all participants were acquired on a 3T Tim Trio scanner (Siemens, Erlangen, Germany). Standard, noncontrast, clinically diagnostic sequences were performed as follows: T1 3D sagittal MPRAGE (TR/TE/TI = 2300/2.98/900 ms, 1.0 = mm isotropic resolution). 2D T2 and FLAIR images were acquired to screen for disease. MR angiography was performed to screen for large-vessel stenosis. The fMRI sequence used a block-design paradigm of a word stem task in which the participant was visually presented with a set of 3 letters and had to construct a word that starts with those 3 letters.22 Each word stem could be used to produce at least 3 words that would be within the vocabulary of the patients in this study. Each set of 3 letters was displayed for 3 seconds, and 10 sets were displayed in each block. The patients were instructed to press a button when they found a word that matched the word stem. The fMRI run consisted of 100 dynamic scans with the duration of each dynamic being 3 seconds. There were 5 activation blocks and 5 rest blocks, and the paradigm started with a rest block. During the rest intervals, a crosshair was displayed at the center of the screen and the subject was asked to focus on the crosshair. The sequence parameters for the fMRI sequence were the following: TR/TE = 3000/35 ms, FOV = 216 × 216 mm, matrix = 72 × 72. Parallel imaging with an acceleration factor of 2 was used in the phase-encoding (anteroposterior) direction.
Diagnostic Imaging Analysis
The clinical diagnostic sequences were reviewed by a board-certified pediatric neuroradiologist. The scans from both patients and volunteers were reviewed for the absence of general pathology; in case of infarcts, these were judged to have normal or abnormal findings. In the latter case, the lesions were then classified as either nonspecific white matter lesions if <3 mm in diameter and visible in 2 planes or focal discreet white matter lesions if >3 mm in 2 planes.23
fMRI Processing
fMRI processing of the data was performed by using the software routines in the FSL Software Library (http://www.fmrib.ox.ac.uk/fsl). For each subject, we performed the following steps: motion correction with the MCFLIRT tool of the FSL (https://fsl.fmrib.ox.ac.uk/fsl/fslwiki/MCFLIRT), brain extraction with the FSL Brain Extraction Tool (http://fsl.fmrib.ox.ac.uk/fsl/fslwiki/BET), spatial smoothing with a Gaussian kernel (full width at half maximum = 5 mm), and high-pass temporal filtering. A general linear model (GLM) was then used to generate statistical parametric maps of activation and deactivation for each subject by using the motion parameters as estimated by MCFLIRT for that patient as confounds in the FSL General Linear Model (GLM; http://fsl.fmrib.ox.ac.uk/fsl/fslwiki/GLM). The fMRI data were aligned to a skull-stripped anatomic volume acquired in the same imaging session by using the BBR registration option (https://fsl.fmrib.ox.ac.uk/fsl/fslwiki/FLIRT_BBR) and were subsequently mapped to the standard Montreal Neurological Institute space by using a 12 df linear registration. A second-level analysis was performed by using Flame1 (https://fsl.fmrib.ox.ac.uk/fsl/fslwiki/FEAT/UserGuide#Group_Statistics) to generate statistical parametric maps of the group activation, group deactivation, and areas of significant difference between the groups (controls > SCD).
To measure the mean z score in areas of activation and deactivation (DM), we thresholded the Z statistical maps corresponding to the group activation and deactivation to create binary ROIs. These ROIs were then projected back from the standard space to the subject space for each individual by using the inverse transform provided by FSL (https://fsl.fmrib.ox.ac.uk/fsl/fslwiki/FLIRT/UserGuide).
Results
Exclusion and Demographic Information
All participants in the current study identified themselves as African Americans. There were initially 17 subjects in the control group and 19 subjects in the SCD group. Three control subjects were excluded due to excessive motion (>3 mm) during the fMRI series, and 1 was excluded due to existing pathology. Four subjects with SCD were excluded due to existing pathology, and 2 were excluded due to excessive motion. Thus, 13 subjects were left in each group. The mean ages were 14.5 ± 3.1 years for the control group and 15.3 ± 2.3 years for the SCD group. The difference in age between the groups was not statistically significant. In the SCD group, 12 subjects were right-handed, and 1 was left-handed. In the control group, 9 were right-handed, 1 was left-handed, and the handedness was not recorded for the other 3 subjects. Nine of the 13 subjects with SCD were taking hydroxyurea to boost their levels of fetal hemoglobin.
Neuropsychology
Between-group analyses of neuropsychological measures revealed no differences in intelligence, with both groups performing in the average range (Wechsler Abbreviated Scales of Intelligence Full Scale Intelligence Quotient: SCD mean = 97.7, control mean = 106.0, P = .149). Differences observed between the 2 groups were found almost exclusively within the cognitive domain of executive functioning. The control group performed significantly higher than the SCD group on a measure of executive functioning that requires sequencing, planning, and inhibition (Delis-Kaplan Executive Function System Color Word Inference Test; SCD mean = 88.1, control mean = 101.9, P = .022). Additionally, the control group performed significantly higher on a measure of auditory attention and working memory (Wechsler Intelligence Scale for Children, Fourth Edition, Digit Span; SCD mean = 92.7, control mean = 107.3, P = .003).
Functional Imaging
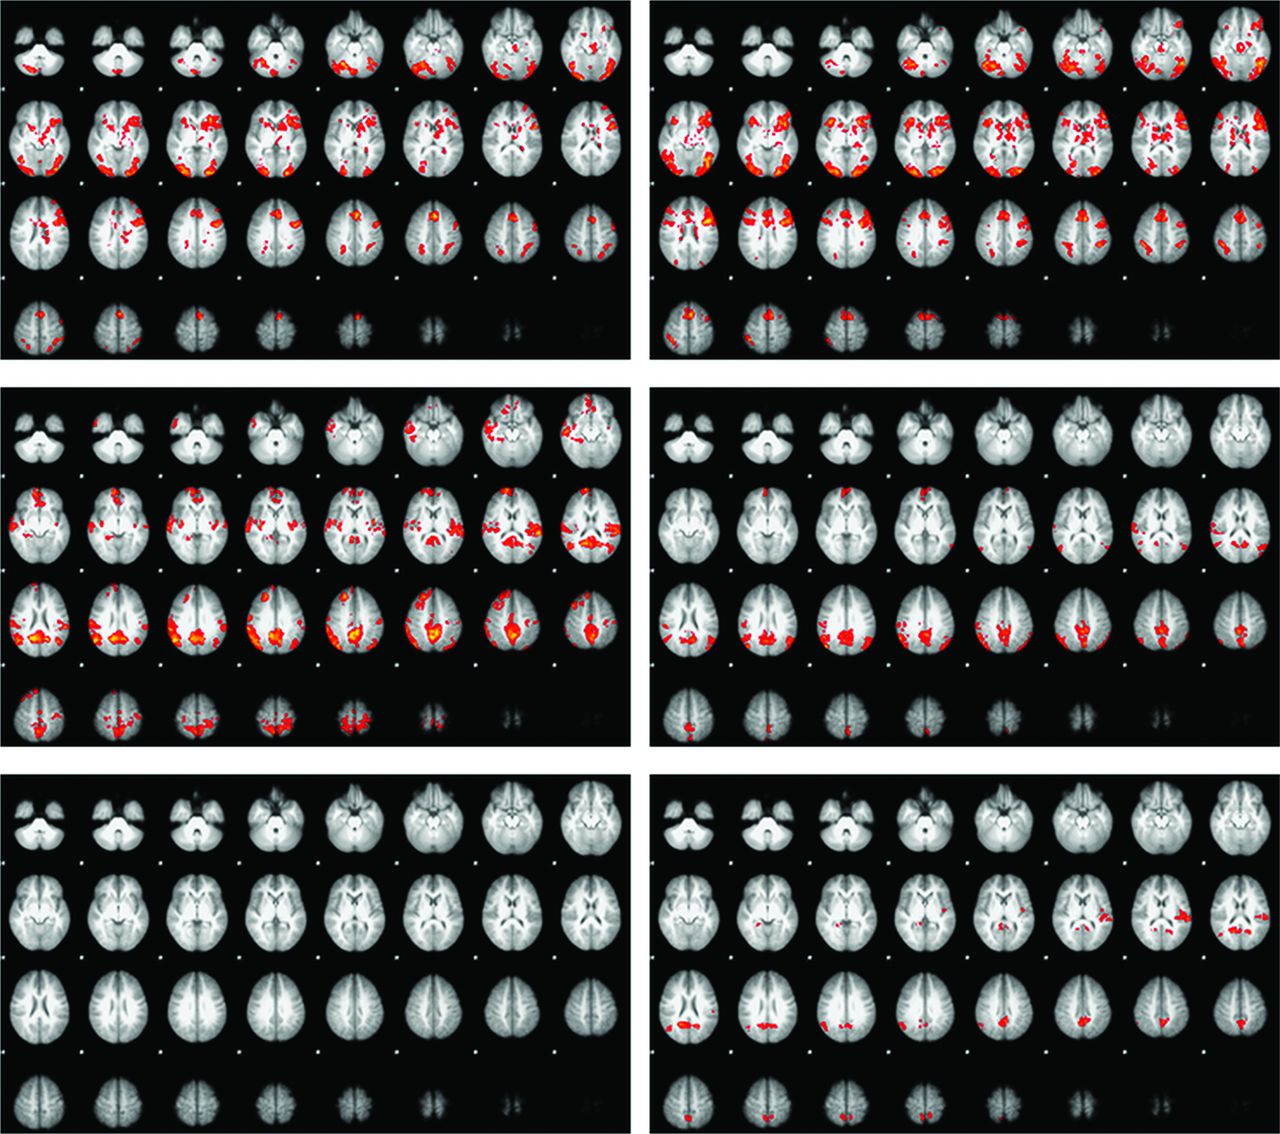
An initial review of the first-level fMRI results revealed 3 subjects with minimal activation but an intact, if attenuated, DM response. Due to the very different responses in these 3 subjects, they were removed from all subsequent analyses. For the controls, the 10 subjects having the best age match to the reduced sickle cell group were chosen so that each group would consist of 10 subjects. Table 1 summarizes the z scores for all activated and deactivated voxels, for both the complete (n = 13) group and a reduced group (n = 10), with the 3 outliers removed. For the activation, the regions seen for both groups were in good agreement with those previously described in the literature (Fig 1).22 Subjectively, the activation was somewhat more extensive in the SCD group, most notably in the right anterior temporal lobe. However, there were no areas of significant difference in the control > SCD contrast for activation. For the DM analysis, the classic DM regions (medial parietal cortex and medial prefrontal cortex), the auditory cortex bilaterally (left > right), and the angular gyrus bilaterally (right > left) were seen in the controls. The left auditory cortex was absent in the subjects with SCD, and the other areas were subjectively both weaker and less extensive in the SCD group. The control > SCD image for the DM showed areas of significant difference in the medial parietal cortex, the left auditory cortex, and the right angular gyrus (Fig 1).
Summary of the Z statistics for the total activated and deactivated (default mode) areasa

The activation (top row) and the default mode (middle row) responses to the word stem paradigm in the controls (left column) and subjects with SCD (right column). The lower row shows the control > SCD contrast for the activation (left) and DM (right) responses.
A GLM analysis was performed by using age and the physiologic variable as the dependent parameters in the GLM, covarying age, because CBF varies with age in both healthy subjects and those with sickle cell disease.24 The results are summarized in Table 2. All 4 variables (hemoglobin, percentage of fetal hemoglobin, percentage of sickle cell hemoglobin, and mean corpuscular volume) showed a statistically significant correlation with the z score (P < .05) for the activation, but none showed a significant correlation with the deactivation z score. However, with the exception of hemoglobin, the slopes of the GLM fit were very similar for both the activation and the deactivation.
The results for the GLM modeling of the interaction between the BOLD response as measured by the Z score and the physiologic variablesa
Discussion
Overall our results provide evidence for attenuated DM network activation in our patients with SCD compared with matched controls. In addition, results revealed decreased volumes of white matter and the globus pallidus in the patients with SCD compared with controls. The lack of differences in the task-based activation is not surprising given the neuropsychological testing, in which the 2 groups were equally matched for intelligence quotient and did not differ in verbal memory measures. In contrast, differences were specifically observed in the DM network activation, with the control group showing significantly greater activation of core DM nodes compared with patients with SCD. Research suggests that the DM network reflects intrinsic organization of a healthy functional organization system that primes the brain for efficiently responding to input from external stimuli.25 Thus, 1 plausible explanation for our findings is a disruption of the DM network in SCD, causing these patients to work less efficiently to perform a similar task, in this case a word stem task.
Additional results worthy of discussion are that the physiologic variables were significantly correlated with the activation, but not the deactivation z scores. Thus in patients with SCD, the activation response reflects the expected effects of variations in the vascular physiology (increases in hemoglobin, mean corpuscular volume, and the percentage of fetal hemoglobin, resulting in higher z scores while a higher percentage of sickle cell hemoglobin reduced the z score). For the 3 outliers who were excluded after the initial analysis, the physiologic variables were in the same range as in the other patients but did not show any significant correlation with the z score. We also investigated other possible reasons for the abnormal activation in these outliers. Of the 3 outliers, 1 was taking hydroxyurea and 2 were not. To investigate the possible effects of pain medications, we acquired the number of emergency department visits during the previous year that required the use of IV pain medications from a review of each subject's medical records. For all 13 subjects, the average number of visits was 1.6, while for the 3 excluded subjects, none of whom had had any such visits in the previous year, the average was 2.0. Thus, neither of these factors appear to explain the lack of activation in these subjects, and other factors, such as changes in cerebrovascular reactivity26 and/or oxygen extraction fraction,27 may be responsible for the weak activation and the poor correlation of the physiologic variables with the z scores for these subjects. Deriving the activation and DM responses from the same paradigm ensures that the physiologic effects of SCD are common to both responses. The left auditory cortex and the right angular gyrus, while not part of the classic DM network, did exhibit significant deactivation on the difference map (Fig 1). Other groups have previously shown that sensory areas are deactivated when they are not central to task performance,20,21 so that attention to a single sensory technique (the visually present letters) can result in decreased activity in cortical regions that process information from an unattended sensory technique (the auditory cortex). The deactivation of the auditory cortex has previously been shown to be bilateral; thus, the absence of activation in the left auditory cortex in the subjects with SCD is surprising. Our findings suggest the following: 1) a weaker correlation of the DM with the physiologic variables for subjects with SCD, 2) larger differences in the DM for the control > SCD contrast, and 3) stronger deactivation of the auditory cortex and angular gyrus in the controls. Each of the above may indicate that the deactivation of the DM and associated regions are impaired in the SCD group.
There are some limitations in this work. Many of the DM areas, particularly the medial parietal cortex, are associated with a high resting metabolism and have also been shown to have reduced cortical thickness26,28 and cerebrovascular reactivity26 in subjects with SCD. In this study, we were unable to detect any regions of significant cortical thinning; however, the group size used in the other articles was much larger than ours, and they restricted the age range to older than 12 years to minimize age-related effects.26,28 Applying the same criteria to our already small group size would have reduced the size of the already small control group from 13 to 9 subjects.
Conclusions
We found significantly decreased volumetric deactivation of the DM network and neuropsychological functioning in patients with SCD compared with controls. These results highlight the effectiveness of using advanced neuroimaging techniques to help inform our understanding of neurocognitive deficits in SCD. Our results lend support to the hypothesis that the deficits seen in executive functioning, which primarily relies on the medial parietal cortex and medial prefrontal cortex, in patients with SCD are shown to have deactivation differences within the DM network. Additionally, these deficits appear to be related to difficulties of patients with SCD in appropriately modulating intrinsic brain activity during a cognitive task. Overall, this study provides support for a more focused examination of the DM network and brain matter differences in patients with SCD.
Footnotes
This study was funded by an internal grant from the radiology department at Children's Healthcare of Atlanta.
Paper previously presented, in part, at: Annual Meeting of the American Society of Neuroradiology and the Foundation of the ASNR Symposium, May 21–26, 2016; Washington, DC.
References
- Received October 6, 2016.
- Accepted after revision February 6, 2017.
- © 2017 by American Journal of Neuroradiology


Jump to section
Related Articles
Cited By...
- No citing articles found.