
Abstract
BACKGROUND AND PURPOSE: 1H-MRS provides a noninvasive way to study fetal brain maturation at the biochemical level. The purpose of this study was to characterize in vivo metabolic maturation in the healthy fetal brain during the second and third trimester using 1H-MRS.
MATERIALS AND METHODS: Healthy pregnant volunteers between 18 and 40 weeks gestational age underwent single voxel 1H-MRS. MR spectra were retrospectively corrected for motion-induced artifacts and quantified using LCModel. Linear regression was used to examine the relationship between absolute metabolite concentrations and ratios of total NAA, Cr, and Cho to total Cho and total Cr and gestational age.
RESULTS: Two hundred four spectra were acquired from 129 pregnant women at mean gestational age of 30.63 ± 6 weeks. Total Cho remained relatively stable across the gestational age (r2 = 0.04, P = .01). Both total Cr (r2 = 0.60, P < .0001) as well as total NAA and total NAA to total Cho (r2 = 0.58, P < .0001) increased significantly between 18 and 40 weeks, whereas total NAA to total Cr exhibited a slower increase (r2 = 0.12, P < .0001). Total Cr to total Cho also increased (r2 = 0.53, P < .0001), whereas total Cho to total Cr decreased (r2 = 0.52, P < .0001) with gestational age. The cohort was also stratified into those that underwent MRS in the second and third trimesters and analyzed separately.
CONCLUSIONS: We characterized metabolic changes in the normal fetal brain during the second and third trimesters of pregnancy and derived normative metabolic indices. These reference values can be used to study metabolic maturation of the fetal brain in vivo.
ABBREVIATIONS:
- GA
- gestational age
- tCho
- total Cho (glycerol 3-phosphocholine + phosphocholine)
- tCr
- total Cr (phosphocreatine + Cr)
- tNAA
- total NAA (NAA + N-acetyl aspartylglutamate)
1H–MR spectroscopy provides a noninvasive method to study brain maturation at the biochemical level. Early metabolic changes observed by 1H-MRS may precede morphologic brain changes1 and overt clinical signs of disease,2 which makes it an invaluable tool for providing insights into the mechanisms of brain insult and antecedents of injury. The spectra obtained by 1H-MRS depict several metabolites dominated by a large water resonance. When this water signal is suppressed, the metabolites emerge at different resonant frequencies and are expressed as parts per million. Each metabolite reflects specific cellular and biochemical processes. N-acetylaspartate is considered a neuronal-axonal marker with a neuronal bioenergetic role3⇓–5 found in the brain and spinal cord, creatine is involved in energy metabolism through the Cr kinase reaction generating phosphocreatine, and, in turn, adenosine triphosphate,6 and choline containing compounds of glycerol 3-phosphocholine and phosphocholine which is present at high levels in glial cells7 as intermediaries in the synthesis of acetylcholine.8 Lactate, a by-product of anaerobic metabolism, is not normally present but may be detectable by 1H-MRS in certain pathologies.9⇓–11
The application of 1H-MRS in studying the fetal brain in vivo has been explored since the 1990s,12 and a number of reviews have been published.13⇓–15 However, there is a paucity of standardized 1H-MRS measurements and reference values for fetal brain metabolites from normal healthy pregnancies. Small sample sizes have also limited the wide application and diagnostic value of this approach in the fetus. The purpose of this article was to characterize prospectively the trajectory of in vivo metabolic brain maturation of the healthy fetus in the second and third trimesters, and to provide reliable reference values for the interpretation of single voxel 1H-MRS of the fetal brain.
Materials and Methods
Subjects
This Health Insurance Portability and Accountability Act compliant prospective study was approved by the institutional review board of Children's National Medical Center, and written informed consent was obtained by all the study participants. Healthy volunteers between 18 and 40 weeks of pregnancy were consecutively recruited from 2011 through 2014 in low-risk obstetric clinics. In 2012, the protocol was amended to include serial studies of the same subject. Inclusion criteria were normal fetal sonography studies and the absence of any maternal medical conditions that might interfere with normal fetal growth and development (eg, chronic hypertension, preeclampsia, intrauterine growth restriction, placental abnormalities, gestational diabetes, and a known history of congenital heart disease).16,17 Those with multiple gestations, evidence of congenital infection, documented prenatal chromosomal abnormalities, fetal sonography findings of dysmorphic features, dysgenetic brain lesions, or anomalies of other organ systems, and any maternal contraindication to MR (eg, mechanical heart valve, pacemaker, or any other ferromagnetic implants) were also excluded. No maternal or fetal sedation was used during the MR studies. Retrospectively, those with incidental findings or abnormalities documented in the MR imaging report by the pediatric neuroradiologist (G.V.) were also excluded from the study cohort.
MR Imaging and Spectroscopy Acquisition
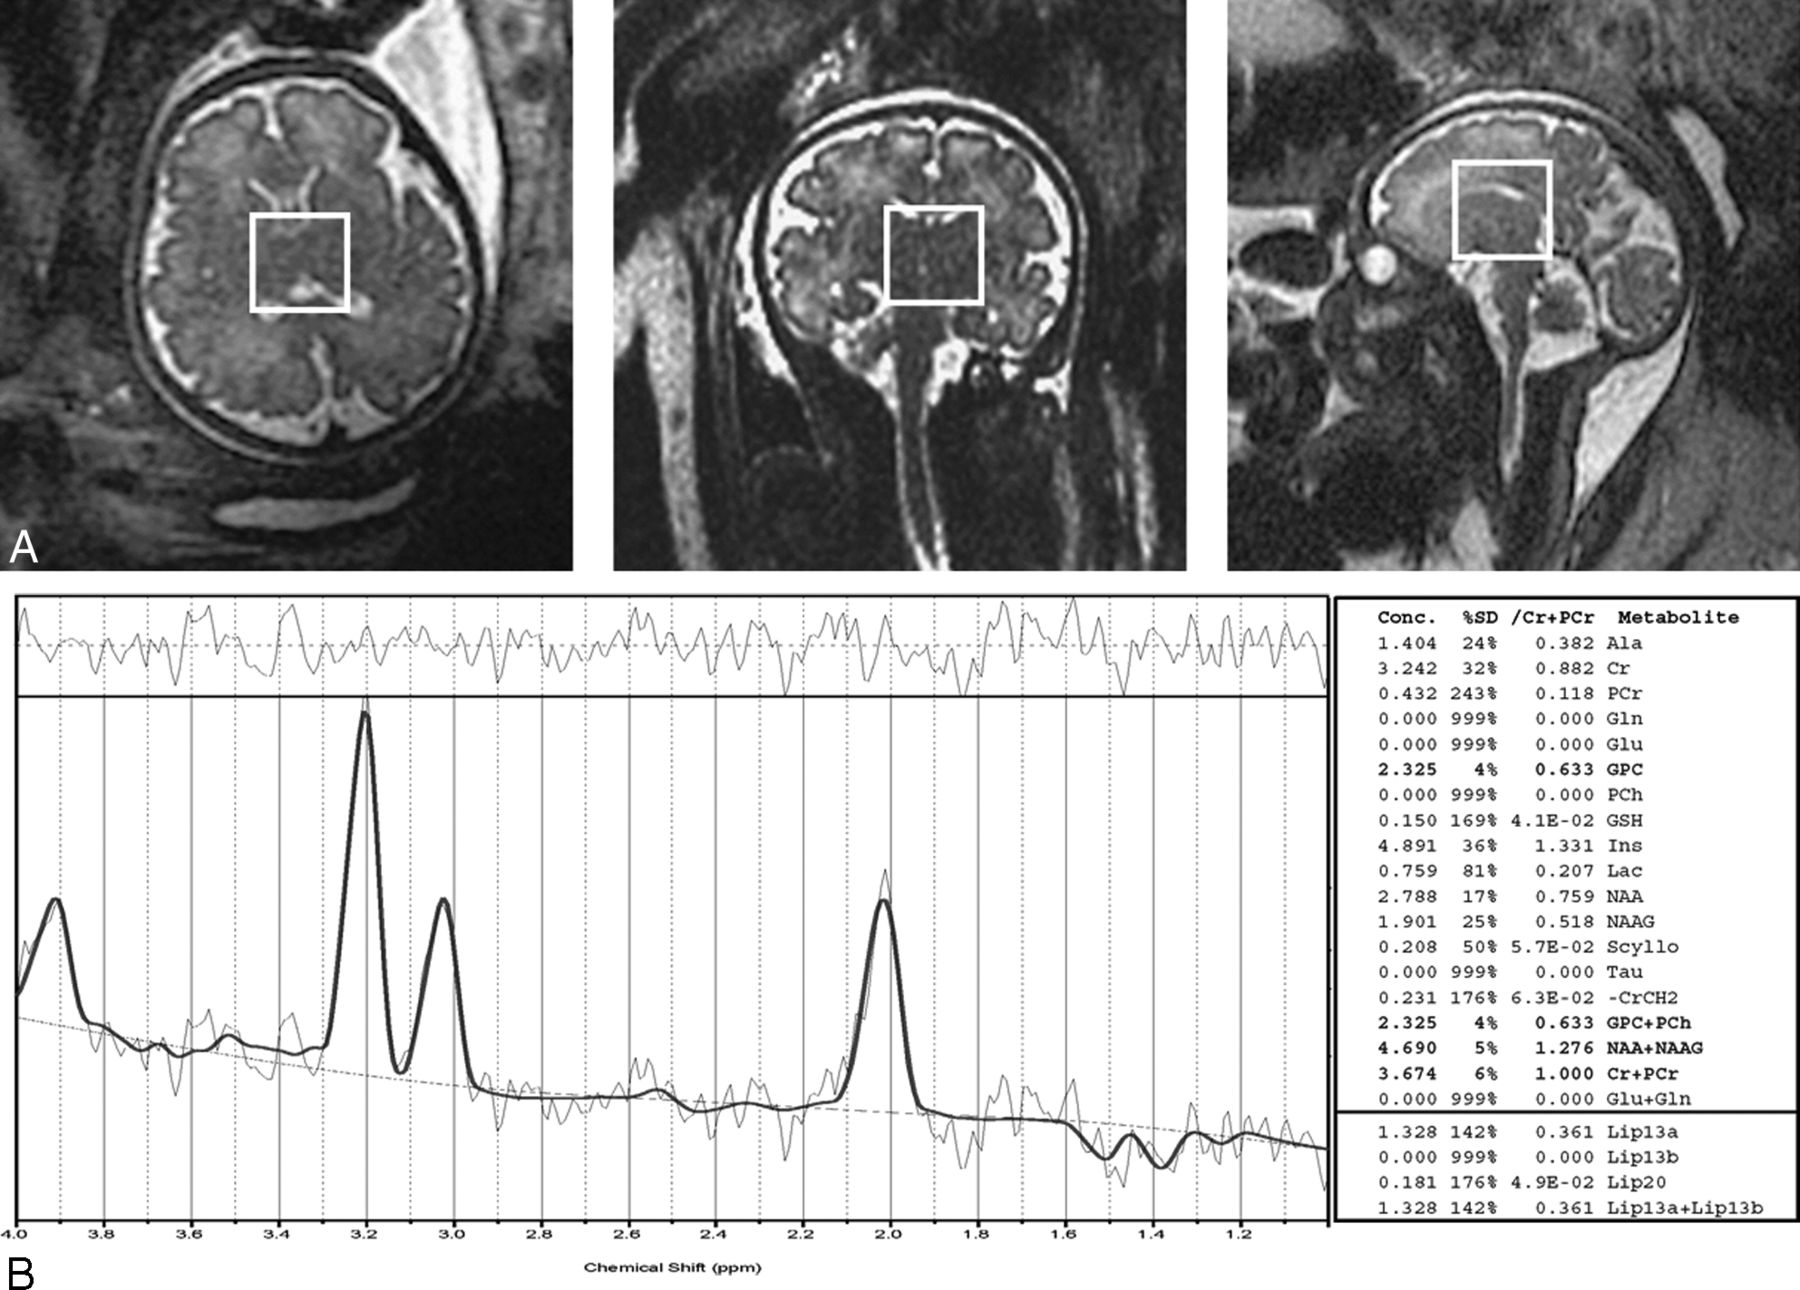
MR imaging and single voxel 1H-MRS data for all the subjects were acquired on a 1.5T MR scanner (Discovery MR450; GE Healthcare, Milwaukee, Wisconsin) using an 8-channel surface coil (GE Healthcare) as part of a comprehensive MR imaging protocol. Anatomic single-shot FSE T2WI with TR = 1100 milliseconds and TE = 160 milliseconds, field of view 320 × 320 mm2, 2-mm section thickness, and 40–60 sections for total brain coverage was acquired in all 3 orthogonal planes. The MR images were reviewed by a neuroradiologist to exclude structural brain abnormality. A single-voxel point-resolved spectroscopy sequence with chemical shift selective suppression was used with TR = 1500 milliseconds; TE = 144 milliseconds; 128–192 excitations that contained 2048 complex points that covered a spectral bandwidth of 2500 Hz, with the phase of all 3 radiofrequency excitation pulses alternating from 0° to 180°; 16 nonwater-suppressed excitations as reference data; and 6 outer volume suppression pulses around an isotropic voxel, either 25 × 25 × 25 or 30 × 30 × 30 mm3, depending on gestational age (GA) and brain size, with an acquisition time of 3:48 or 5:24 minutes, respectively. The voxel was placed in the middle of the brain posterior to the basal ganglia, encompassing the thalamus and hypothalamus, while avoiding the scalp and extracranial tissues and preventing contamination of the spectra by unwanted lipid signals (Fig 1), using the anatomic T2WI for guidance. Automatic prescanning and shimming procedures were performed, followed by fine adjustment of the center frequency, transmitter and receiver gains, and linear shims. Before the spectra acquisition, the water suppression level was verified to be >95%, and the line width at full width at half maximum to be ≤4 Hz, which indicated good quality shimming and high spectral resolution for water suppression to accurately resolve the adjacent Cho and Cr peaks at 3.19 ppm and 3.02 ppm, respectively. Mean transmit and receive gains (R1, R2) were 166 ± 6, 13 ± 1 and 29 ± 2, respectively, for all acquired spectra. During the course of the study, the stability and drift of the MR scanner center frequency, transmit gains, and receive gains (R1, R2) were monitored weekly with quality assurance scans of the “Braino” MR spectroscopy sphere phantom (GE Healthcare) using the single-voxel point-resolved spectroscopy sequence.

A, T2-weighted single-shot fast spin-echo MR imaging (TR/TE = 1100/160 milliseconds, 2-mm thickness) in all 3 orthogonal planes (axial, coronal, and sagittal), showing voxel placement (white rectangle) in a fetus of 35.87 weeks gestation. B, 1H-MRS acquired using a point-resolved spectroscopy sequence (TR/TE = 1500/144 milliseconds, voxel 30 × 30 × 30 mm) quantified using LCModel.
MR Spectroscopy Processing
Raw spectra as P-files were transferred to an off-line Linux workstation (The Linux Foundation, San Francisco, California) for correction of motion-induced artifacts due to fetal movement and maternal breathing during acquisition using a retrospective methodology described previously.18 Resulting spectra were then fitted to basis spectra using the LCModel software (http://www.lcmodel.com/)19 (to calculate metabolite concentrations in the chemical shift range of 4.0–1.0 ppm using the unsuppressed water signal as the internal reference).20 The MR visible water concentration21 in the voxel was calculated to be 50,013 mmol/L using the mean water content in the ex vivo cerebrum as 901 ± 11.48 g/M, in the range of 18–40 weeks of gestation,22 and the molar mass of water, which is approximately 18.02 g/M.23 This was set in the LCModel parameter “WCONC” rather than 35,880 mmol/L used as the default value for white matter, which underestimates the absolute metabolite concentrations.24,25 Based on the LCModel output, MR spectra with line width at full width at half maximum of >0.1 ppm (approximately 6 Hz) and/or SNR of <3 were excluded. Metabolite concentrations with a confidence level of the Cramer-Rao lower bounds26 of >20% were also excluded from the subsequent analysis. LCModel analysis was restricted to fit to the simulated basis spectra of glycerol 3-phosphocholine, phosphocholine, Cr, phosphocreatine, NAA, N-acetyl aspartylglutamate, and lactate. Due to the low signal and spectral resolution of TE = 144 milliseconds at 1.5T, the sums of the absolute concentrations total NAA (tNAA) = NAA + N-acetyl aspartylglutamate, total Cho (tCho) = glycerol 3-phosphocholine + phosphocholine, total Cr (tCr) = phosphocreatine + Cr, and lactate were used in the analysis because they represent more accurate estimates, as shown from the lower confidence level %SD of the Cramer-Rao lower bounds obtained. The –CrCH2 correction term simulated as a negative CrCH2 singlet approximately 3.94 ppm was used to correct for attenuation of the CrCH2 singlet due to water suppression and differential relaxation effects at the long TE.27 T1 and T2 relaxation corrections were not applied due to unavailable literature data for the fetal brain between 18 and 40 weeks of pregnancy and because T2 errors in each metabolite have little effect on the metabolite concentrations (approximately 2%).21 A summary of the quality statistics of the MR spectra acquired is shown in Table 1.
Quality statistics of MR spectra acquired: FWHM, SNR, and %SD Cramer-Rao lower bounds in the whole study cohorta
Statistical Analysis
Descriptive statistics, including means, standard deviations, and frequencies were used to characterize the study cohort. Linear regression analysis (least squares method) was used to fit a straight line with 95% confidence intervals (CIs) to the absolute metabolite concentrations and ratios as a function of GA.28⇓–30 The goodness of fit was assessed using the coefficient of determination (r2) and the standard deviation of the residuals. The slope of the linear regression was tested at P < .05 as indicative of significance. The intraclass correlation coefficient was used to assess scan-rescan measurement reliability within an ANOVA framework. The intraclass correlation coefficient represents concordance and evaluates the level of agreement between raters in measurements, in which 1 is perfect agreement and 0 is no agreement at all.31 The coefficient of variation, defined as the standard deviation of the mean difference between 2 measurements divided by the mean of all measurements was also used as a measure of dispersion.32 The coefficient of variation and intraclass correlation coefficient are most commonly used in 1H-MRS studies.33⇓–35 The analysis was performed using GraphPad Prism 6.05 software (GraphPad Software, San Diego, California). Results are presented as mean (SD) unless otherwise noted.
Results
A total of 204 MR spectra were acquired from 129 healthy pregnant women during their second and third trimester of pregnancy (mean GA, 30.63 ± 6 weeks). Seventy-one spectra (34.8%) were acquired during the second trimester and 133 (65.2%) during the third trimester. Five subjects' MR spectra (2.45%) were excluded from the analysis due to excessive maternal and fetal movement, lipid contamination, and/or low SNR that precluded any quantification of the metabolite concentrations and metabolite ratios. Three were in the second trimester (mean GA, 25.43 ± 1 week), and 2 were in the third trimester (mean GA, 34.21 ± 1 week). An additional 14 MR spectra of the 204 (6.86%) were also excluded from the analysis at the quantification stage because their metabolite concentrations had a >20% confidence level of the Cramer-Rao lower bounds.26 Twenty-five MR spectra (12.25%) were acquired twice during the examination when time permitted. Of those patients who had 2 MR spectra, the one MR spectrum with higher quality (ie, higher SNR, narrower line width at full width half maximum, and lower %SD of the Cramer-Rao lower bounds) was used in the analysis. An additional 7 randomly selected pregnant women had 7 MR spectra (3.43%) acquired (2 in the second trimester and 5 in the third trimester; mean GA, 31.27 ± 4 weeks) that were used for intrasession reproducibility. The remaining 153 MR spectra (75%) (mean GA, 31.3 ± 6 weeks) were included in the final analysis. These included 34 subjects who underwent 2 serial scans, one in the second trimester (mean GA, 25.6 ± 5 weeks) and one in the third trimester (mean GA, 35.0 ± 3 weeks). All the participants' MR images were reviewed by an experienced pediatric neuroradiologist (G.V.) and were found to have structurally normal brains. Postnatal MR studies were performed on 71% of neonates who returned for follow-up MR studies. All the neonates had a structurally normal brain after birth.
Metabolic Maturation during Second and Third Trimesters
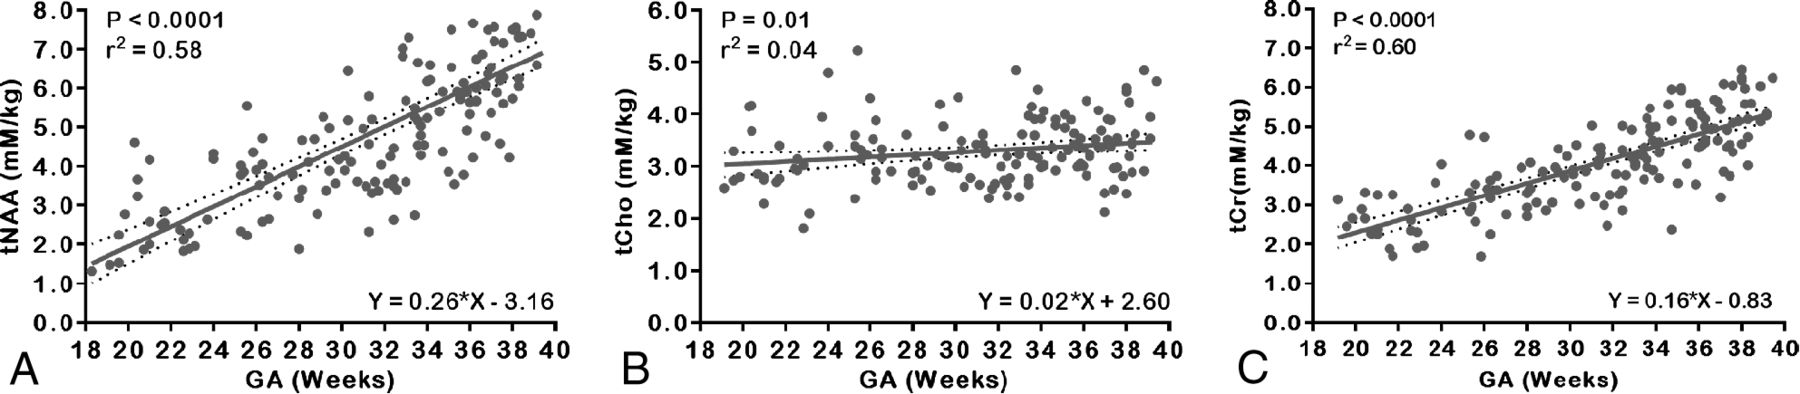
Metabolic profiles in the fetal brain changed significantly with advancing GA. Figure 2 depicts the main absolute metabolite concentrations detected in the fetal brain of the entire cohort across GA, with the best-fit straight line and corresponding 95% CIs. Absolute concentrations of each metabolite using the unsuppressed tissue water as an internal reference and corrected for cerebral water content were also calculated in mM/kg. The tNAA exhibited a significant increase (r2 = 0.58, P < .0001) with advancing GA from 18 to 40 weeks. The tCho increased linearly with GA and was relatively stable across gestation, (r2 = 0.04, P = .01) compared with tCr, which increased with GA (r2 = 0.60, P < .0001), which made tCho ideal as a denominator for the metabolite ratios.

Scatterplots of absolute metabolite concentrations relative to the water signal and linear regression straight line fits with mean (solid line) and 95% CIs (dotted lines). A, tNAA. B, tCho. C, tCr.
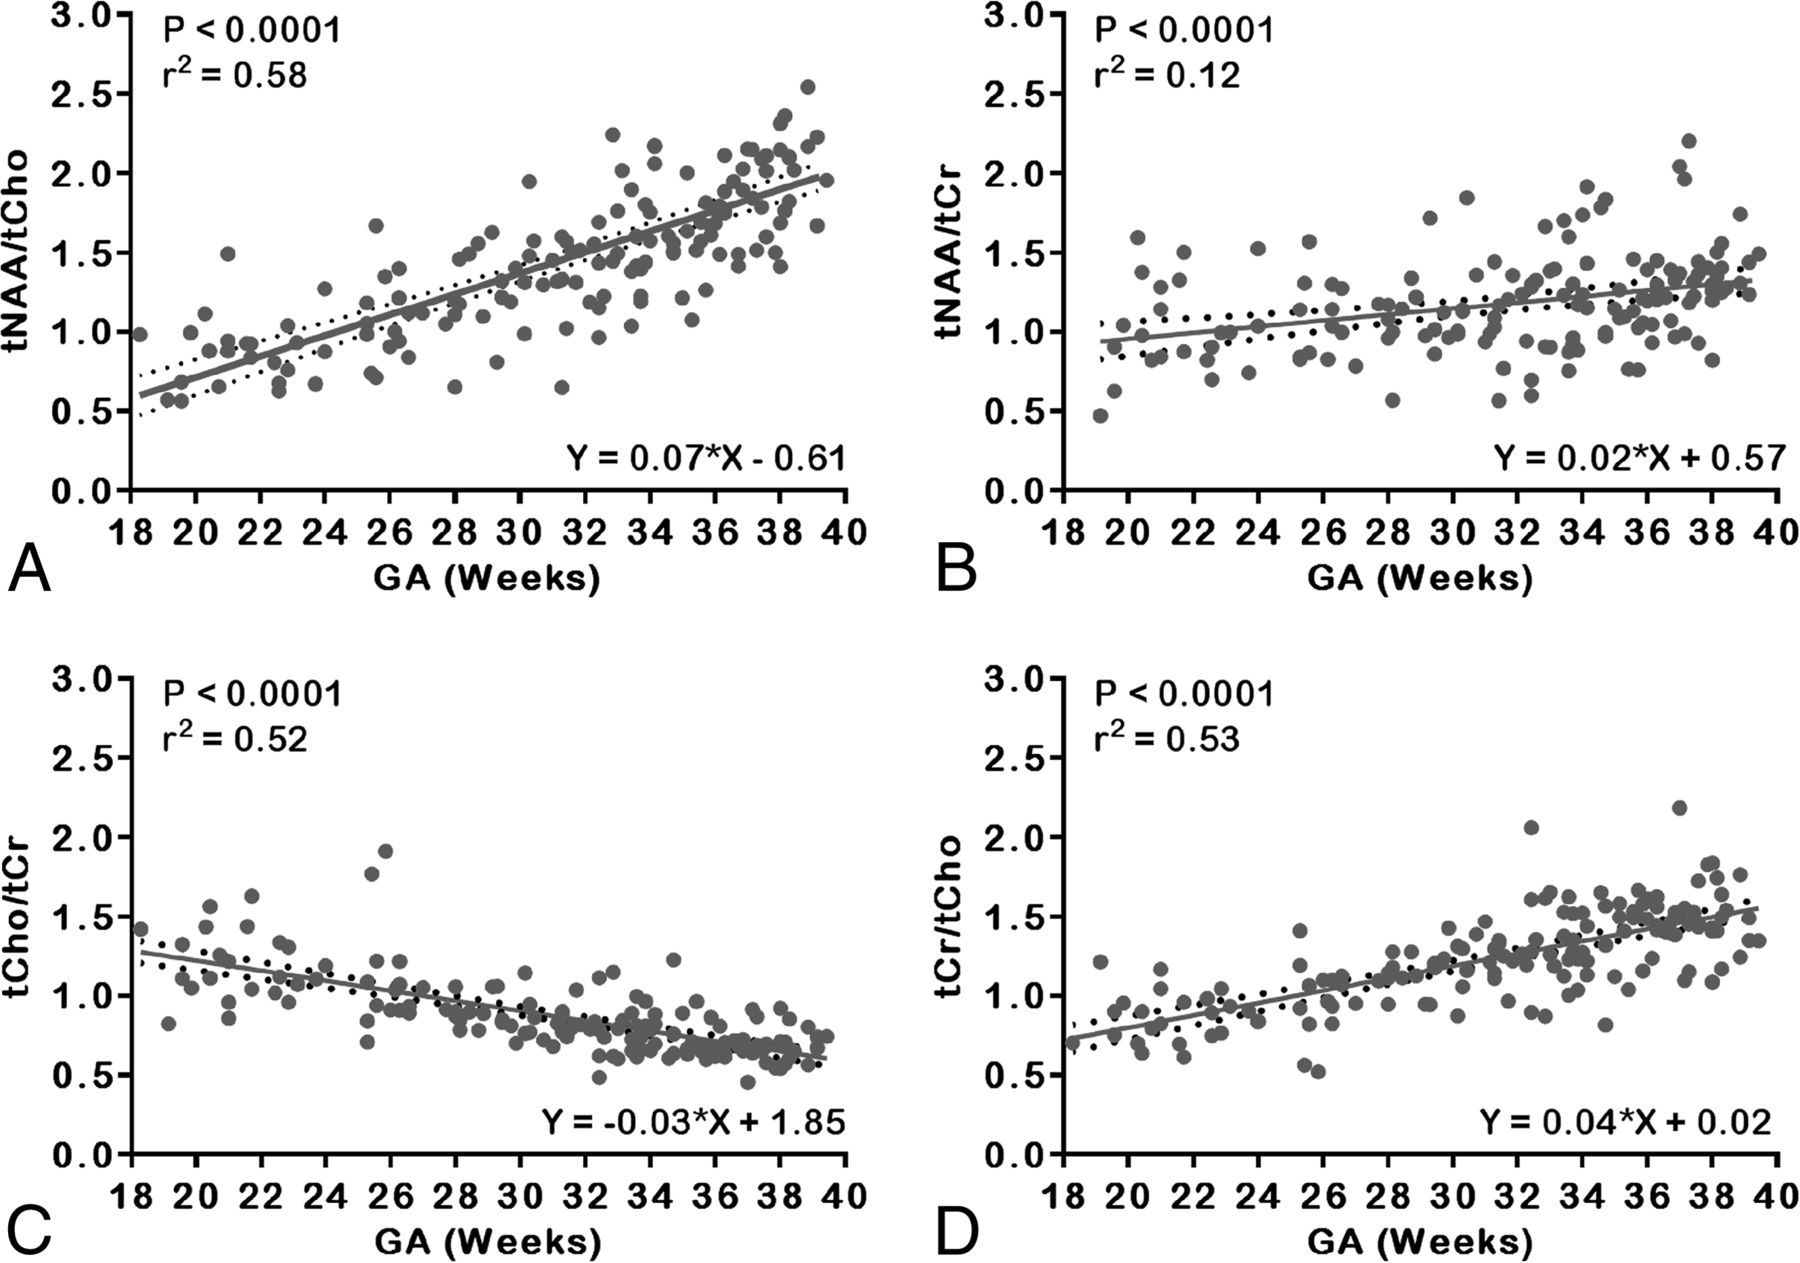
The tNAA to tCho [tNAA:tCho] also exhibited a significant increase with increasing GA (r2 = 0.58, P < .0001), whereas tNAA to tCr [tNAA:tCr] exhibited a slower yet significant increase (r2 = 0.12, P < .0001) from 18 to 40 weeks. Similarly, tCho:tCr and tCr:tCho showed a significant exponential increase with GA (r2 = 0.52, P < .0001; r2 = 0.53, P < .0001, respectively). Figure 3 depicts the main metabolite concentration ratios detected in the fetal brain of the entire cohort across GAs, with the best-fit line and corresponding 95% CIs.

Scatterplots of metabolite concentration ratios and linear regression straight line fits with mean (solid line) and 95% CIs (dotted lines). A, tNAA:tCho. B, tNAA:tCr. C, tCho:tCr. D, tCr:tCho.
Analysis was also performed by stratifying the cohort into 2 groups, that is, those patients who underwent MR studies in the second trimester (43/153 [28%]; mean GA, 23.62 ± 2.82 weeks) versus the third trimester of pregnancy (110/153 [72%]; mean GA, 34.31 ± 3 weeks) to compare metabolic profiles in each trimester alone. In the second trimester group, tCho and tNAA:tCr did not exhibit a significant increase with GA. Conversely tNAA, tNAA:tCho, tCr:tCho, and tCr exhibited a small but significant increase with GA (r2 = 0.17, P = .007; r2 = 0.12, P = .02; r2 = 0.10, P = .034; r2 = 0.20, P = .003, respectively), whereas tCho:tCr significantly decreased with increasing GA (r2 = 0.23, P = .0015). In the third trimester alone, tNAA exhibited the highest increase with GA (r2 = 0.41, P < .0001), whereas tNAA:tCr and tCho exhibited a small yet significant increase with GA (r2 = 0.06, P = .009). Both tNAA:tCho and tCr exhibited a significant increase with GA (r2 = 0.37, P < .0001; r2 = 0.39, P < .0001, respectively). Similarly, tCr:tCho increased significantly with GA (r2 = 0.20, P < .0001), whereas tCho:tCr decreased with GA (r2 = 0.20, P < .0001). The normative values for the absolute metabolite concentrations and their corresponding ratios per week of gestation for the study cohort are summarized in Table 2.
Normative mean absolute metabolite concentrations and ratios per GA in weeks for the whole cohorta
In a subset of 21 subjects, 4 in the second trimester (mean GA, 23.29 ± 3.5 weeks) and 17 in the third trimester (mean GA, 34.75 ± 2.6 weeks), there was quantifiable lactate in the LCModel fitted spectra with %SD confidence level of Cramer-Rao lower bounds of 16.14 ± 3.1, which was higher than the uncertainty of other metabolite concentrations. Absolute metabolite concentration of lactate was 4.36 ± 2.13 mmol/L/kg, which showed greater variability than the other metabolite concentrations. In all these subjects, none of their postnatal MR studies showed evidence of lactate or any structural brain abnormalities.
Reproducibility and Repeatability
Seven MR spectra (3.43%) acquired at random from 7 study participants (2 in the second trimester and 5 in the third trimester; mean GA, 31.27 ± 4 weeks) were used in intrasession reproducibility of the results. These were acquired an average of 20 minutes apart to test reproducibility and repeatability of voxel placement and subsequent absolute metabolite concentration quantification. Scan-rescan coefficient of variation was 6.15% for tNAA, 9.30% for tCho, and 5.43% for tCr. Intraclass correlation coefficient was highest for tCr, which showed high concordance with repeated measurements. The reproducibility statistics are shown in Table 3.
Summary of the reproducibility statisticsa
Discussion
In this study, we demonstrated that absolute metabolite concentrations and metabolite ratios using 1H-MRS can be successfully obtained from the in vivo fetal brain in >75% of cases. In so doing, we provided normative data at TE = 144 milliseconds for metabolic development of the fetal brain over the latter half of gestation in the largest cohort of healthy fetuses to date. We demonstrated that metabolite ratios in the normal fetal brain change with GA as energy demands and cellular maturation increases and cerebral structure evolves. We quantified the detection of the tNAA peak from 18 weeks onward; to our knowledge, this is the earliest detection of tNAA in vivo reported to date. Also to our knowledge, this is the first study to provide absolute metabolite concentrations corrected for water concentration of the fetal brain (cerebrum) and provided clinically relevant values in units of mM/kg. This represents a more accurate estimation of the absolute metabolite concentrations otherwise underestimated if this correction is not used.25 Inherent limitations with metabolite ratios and misconceptions that they self-correct for type of scanner, localization method differences, gain instabilities, regional susceptibility variations, and partial volume effects are addressed using absolute metabolite concentrations in addition to ratios.36
This is also the first study to report intrasession reproducibility and repeatability in fetal 1H-MRS. Although it is difficult to achieve high reproducibility due to the inherent fetal motion and voxel placement, our results compared favorably with similar studies in the liver34 and adult brain33,37 that used similar voxel sizes to acquire MR spectra.
Very few studies have explored fetal brain 1H-MRS in vivo. Most of these studies reported metabolite peak ratios or metabolite areas that are very different and might not be clinically significant from the absolute metabolite concentrations or ratios that LCModel quantifies. Heerchap and van den Berg12 first performed a feasibility study of 6 healthy third-trimester fetuses using long acquisition times (>10 minutes). Fenton et al38 reported metabolites in a small sample using a short breath-hold technique, but spectral quality remained poor. Subsequently, Kok et al39 studied 36 normal third trimester fetuses and described a significant increase in both NAA:Cr and NAA:Cho, whereas Cho:Cr decreased with increasing GA. Using maternal sedation, Girard et al28 performed clinically indicated studies in 58 fetuses in which fetal MR imaging studies were found to be structurally normal. However, they reported ratios of each metabolite to the total metabolite sum, which makes these data difficult to compare with other studies. Also, their long acquisition times (twice as long as our study) and their voxel placement in the centrum semiovale was different enough from ours to be able to make any meaningful comparisons. Most recently, Berger-Kulemann et al40 retrospectively evaluated, with a 55% success rate, 1H-MRS of 75 fetuses referred for MR imaging for suspected brain abnormalities.41 It is important to note that, unlike other studies, our inception cohort only included low-risk healthy pregnant volunteers, which constituted a truly representative normative sample. We also demonstrated a higher success in interpretable 1H-MRS in the absence of maternal sedation.
The increase in both tNAA:tCho and tNAA:tCr with advancing GA described in our study may be attributed to dendritic and synaptic development.5 The tCho peak observed in our MR spectra was composed of both phosphocholine and glycerol 3-phosphocholine. These compounds are involved in membrane synthesis and degradation.7 This tCho peak, however, only reflects a small part of the tissue level of Cho-containing compounds. More than 90% of the latter is phosphatidylcholine, a major constituent of the phospholipids that form myelin,42,43 which cannot be detected by 1H-MRS.44 The tCho exhibits a higher concentration during early life than in adulthood, which indicates that Cho-containing compounds are turned over more rapidly during early human development24,45 and decrease over the first 5 years of life.46,47 We also showed that tCho:tCr decreases with increasing GA, whereas tCho remains relatively stable until the beginning of myelination toward the end of the third trimester of pregnancy and early postnatal period.45,48 One study reported that absolute Cr levels remain stable during gestation, which may serve as a reliable reference (denominator) for quantifying changes in other metabolites.29 Analysis of our data indicated that tCho may be a more-appropriate reference metabolite for the developing fetal brain because it remains at relatively constant levels from 18 to 40 weeks of gestation, as shown by the tCho linear regression straight line plot and shown from the absolute metabolite concentrations quantified using the unsuppressed tissue water as an internal reference20 in Table 2. However, there is a small increase in tCho when considering the cohort in the third trimester alone, which likely indicated the start of myelination.
Lactate was observed in a small subset of our cohort. Berger-Kulemann et al40 found lactate in 2 of their 6 normal fetuses (33.3%), whereas Story et al30 described lactate in 3 healthy fetuses (7%) with normal deliveries and postnatal outcomes. The investigators postulate that lactate may be an important source of energy for the normally developing brain. Lactate is also normally present in CSF.49 The voxel used in this study contained heterogeneous brain tissue, including contamination by CSF, which led to the detection of lactate signal. Because our choice of TE (144 milliseconds) is specific to lactate, it is likely more frequently detected when present. Furthermore, the absolute metabolite concentration of lactate exhibited a greater variability than any of the other metabolites, which indicated that the fluctuating baseline might also be responsible for its detection. No lactate peak was identified in the postnatal 1H-MRS. Further studies are needed to investigate the presence and predictive value of lactate in the healthy fetus.
The choice of TE often depends on the metabolite of interest. In this study, we chose TE = 144 milliseconds because this has a better-defined baseline and less baseline distortion over TE = 35 milliseconds, which allowed for a more accurate quantification as indicated by lower %SD of the Cramer-Rao lower bounds. In addition, our normative fetal 1H-MRS studies were performed to be able to compare brain metabolites in a cohort of fetuses with complex congenital heart disease, in which we selected TE = 144 milliseconds to detect and differentiate lactate from lipids at 1.3 to 1.4 ppm by J-modulation/inversion of the lactate doublet peaks.
Strengths of our study included the largest known sample size of healthy normal fetal studies, the prospective design, and the successful acquisition and correction of motion-induced artifacts, which yielded high-quality spectra in >75% of the studies. Limitations included the fact that single voxel fetal brain 1H-MRS requires an additional anatomic scan for voxel placement and is usually relatively large to increase SNR. This is needed given the magnitude and frequency of fetal-maternal motion to ensure that it remains within the brain. However, the voxel usually contains white-gray matter and CSF.15 To overcome this limitation would require tissue segmentation to resolve tissue constituents from which the MR spectrum is acquired, which is currently not possible in utero.39
This study demonstrated the feasibility of obtaining noninvasive metabolic information from the fetal brain with a high success rate and good reproducibility using 1H-MRS. Normative reference values of absolute metabolite concentrations and ratios in the fetal brain in the second and third trimesters of pregnancy are provided for the largest sample to date. This is also the first study to retrospectively correct the acquired MR spectra for motion-induced artifacts before quantification, which yielded high-quality spectra. These data will aid clinicians in interpreting 1H-MRS of the fetal brain, complementing structural MR imaging, and allowing detection of early deviation from these norms in the compromised fetus. In the future, detection of such deviation from normal metabolic development may allow interventions that minimize irreversible brain injury.
Acknowledgments
The authors thank the clinical research coordinators, the MR technologists, and the volunteers and their families for participating in this study.
Footnotes
Disclosures: Iordanis Evangelou—RELATED: Grant: Canadian Institutes of Health Research (MOP-81116)*; UNRELATED: Board Membership: ImPossible MR, LLC; Consultancy: GE Healthcare Coils, MR Instruments; Employment: ImPossible MR, LLC; Grants/Grants Pending: Veterans Affairs, Department of Defense,* Chronic Effects of Neurotrauma Consortium (CENC0039P); Stock/Stock Options: ImPossible MR, LLC. Ralph Noeske—UNRELATED: Employment: GE Healthcare. *Money paid to the institution.
This study was funded by the Canadian Institutes of Health Research: MOP-81116 (C. Limperopoulos).
Paper previously presented in part at: Annual Meeting of the Pediatric Academic Societies, May 4–7, 2013; Washington, DC.
Indicates open access to non-subscribers at www.ajnr.org
References
- Received April 27, 2015.
- Accepted after revision June 21, 2015.
- © 2016 by American Journal of Neuroradiology


