
Abstract
BACKGROUND AND PURPOSE: DWI with conventional single-shot EPI of the pituitary gland is hampered by strong susceptibility artifacts. Our purpose was to evaluate the feasibility of intravoxel incoherent motion assessment by using DWI based on TSE of the normal anterior pituitary lobe.
MATERIALS AND METHODS: The intravoxel incoherent motion parameters, including the true diffusion coefficient (D), the perfusion fraction (f), and the pseudo-diffusion coefficient (D*), were obtained with TSE-DWI in 5 brain regions (the pons, the WM and GM of the vermis, and the genu and splenium of the corpus callosum) in 8 healthy volunteers, and their agreement with those obtained with EPI-DWI was evaluated by using the intraclass correlation coefficient. The 3 intravoxel incoherent motion parameters in the anterior pituitary lobe were compared with those in the brain regions by using the Dunnett test.
RESULTS: The agreement between TSE-DWI and EPI-DWI was moderate (intraclass correlation coefficient = 0.571) for D, substantial (0.699) for f', but fair (0.405) for D*. D in the anterior pituitary lobe was significantly higher than in the 5 brain regions (P < .001). The f in the anterior pituitary lobe was significantly higher than in the 5 brain regions (P < .001), except for the vermian GM. The pituitary D* was not significantly different from that in the 5 brain regions.
CONCLUSIONS: Our results demonstrated the feasibility of intravoxel incoherent motion assessment of the normal anterior pituitary lobe by using TSE-DWI. High D and f values in the anterior pituitary lobe were thought to reflect its microstructural and perfusion characteristics.
ABBREVIATIONS:
- D
- true diffusion coefficient
- D*
- pseudo-diffusion coefficient
- f
- perfusion fraction
- ICC
- intraclass correlation coefficient
- IVIM
- intravoxel incoherent motion
Intravoxel incoherent motion (IVIM) imaging is an advanced DWI technique that allows a separate quantitative evaluation of all the microscopic random motion that contributes to DWI, which is essentially represented by molecular diffusion and blood microcirculation (perfusion).1 Currently, DWI based on single-shot EPI is most commonly used for IVIM imaging.2,3 However, EPI-DWI is associated with strong susceptibility artifacts, which cause image degradation in the skull base,4 making it difficult, if not impossible, to accurately measure the IVIM parameters in the anterior pituitary lobe. DWI based on TSE has been reported to mitigate such problems in the skull base.5 To our knowledge, perfusion of the normal pituitary gland has not yet been evaluated by imaging modalities. Therefore, the purpose of this study was to evaluate the feasibility of IVIM assessment based on TSE-DWI in the normal pituitary gland.
Materials and Methods
The study was conducted with approval of the Kagoshima University Hospital review boards. Written informed consent was obtained from each participant. First, we performed an in vitro experiment on a phantom for validation of TSE-DWI sequences. Second, the IVIM measurement by using TSE-DWI was validated in the in vivo human brain by comparing it with conventional EPI-DWI. Finally, IVIM parameters in the anterior pituitary lobe were measured and compared with those in the brain parenchyma.
MR Imaging Parameters
All MR imaging was performed by using a 3T system (Ingenia; Philips Healthcare, Best, the Netherlands) and a 15-channel receiver head coil. The imaging parameters for the TSE-DWI were as follows: TR/TE = 3000/52 ms; flip angle = 90°; echo-train length = 60; sensitivity encoding factor = none; FOV = 180 mm; acquisition matrix = 100 × 100 (reconstructed into 112 × 112); voxel size = 1.8 × 1.8 × 3.0 mm3 (1.6 × 1.6 × 3.0 mm3 after reconstruction); NEX = 6. The motion-probing gradient was applied in 3 orthogonal directions. For the human studies, peripheral pulse gating was used to reduce possible signal variability due to CSF pulsation, resulting in a TR ranging from 2400 to 3000 ms and an imaging time from 8 minutes 52 seconds to 11 minutes 6 seconds. We used 13 different b-values (0, 10, 20, 30, 50, 80, 100, 200, 300, 400, 600, 800, and 1000 s/mm2). The imaging parameters for the EPI-DWI were as follows: TR/TE = 3000/56 ms; flip angle = 90°; EPI factor = 61; sensitivity encoding factor = 2; FOV = 180 mm; NEX = 3. The imaging matrix and the motion-probing gradient settings, including the b-values, were the same as those for TSE-DWI. The imaging time was 5 minutes 39 seconds. T1-weighted spin-echo images with fat suppression were also obtained for anatomic reference (TR/TE = 500/6.9 ms; imaging matrix = 240 × 226).
Phantom Study
A plastic bottle with a 10-cm diameter filled with Gd-DTPA-doped (0.3-mmol/L) water at 22°C was used for the in vitro experiment. Images were obtained at a 3-mm-thick midsagittal plane by using TSE-DWI and EPI-DWI with the 13 b-values (0, 10, 20, 30, 50, 80, 100, 200, 300, 400, 600, 800, and 1000 s/mm2). A board-certified radiologist (K.K., with 17 years of experience) measured the signal intensity at different b-values within a manually drawn, circular ROI with an area of 92 mm2 on a PACS workstation.
Human Studies
Volunteers were eligible for study inclusion if they met the following conditions: 1) They were at least 20 years of age to, at most, 40 years of age, 2) were not pregnant, 3) had no neurologic diseases, 4) had no endocrine diseases, 5) had no history of head injury, and 6) had no contraindications to MR imaging (eg, noncompatible biometallic implants or claustrophobia). IVIM imaging was performed by using both TSE-DWI and EPI-DWI sequences on a 3-mm-thick midsagittal plane, including the pituitary gland.
Visual Assessment of Image Quality
The isotropic diffusion-weighted images (b = 1000 s/mm2) from TSE-DWI and EPI-DWI were reviewed by a radiologist (K.K.), and the visibility of the pituitary gland was rated as either good (visible with minimal degradation), acceptable (visible with acceptable degradation), poor (visible with serious degradation), or undetectable, with the corresponding T1-weighted image as a reference.
IVIM Data Analysis
The IVIM analysis was performed by using a standard 2-compartment diffusion model with a capillary perfusion component and a nonvascular compartment.1 Signal decay was estimated by using the following biexponential equation:
 where D and D* are the true diffusion coefficient and the pseudo-diffusion coefficient, respectively; SI and SI0 are the signal intensity at a given b-value and at b = 0 s/mm2, respectively; and f is the volume fraction within a voxel of water flowing in perfusion capillaries. The pseudo-diffusion coefficient D* represents the incoherent molecular translation of water within flowing blood when that blood flow changes capillary segments several times during the TE and thereby mimics the random walk of the diffusion process.1 The signal decay was fitted in a step on a voxel-by-voxel basis to create each parameter map of D, f, and D* by using an Interactive Data Language-based software (Philips Research Integrated Development Environment; Philips Healthcare).
Quantitative Analysis
Two independent radiologists (K.K. and M.N., with 17 and 11 years of experience, respectively) manually drew 5 ROIs (range, 31.0–222 mm2; Fig 1) in the pons, the WM and GM regions of the vermis, and the genu and splenium of the corpus callosum. The ROIs were first drawn on the D map derived from the TSE-DWI and then were copied automatically onto the corresponding f and D* maps. The same ROIs were also copied to the parametric maps from EPI-DWI, but subsequent manual adjustments of their positions were needed because of image distortion. For TSE-DWI, the ROI was also placed in the anterior pituitary lobe (range, 20.7–31.0 mm2; Fig 1) by using the corresponding T1-weighted image as a reference.

Sagittal fat-suppressed T1-weighted image (A), TSE-DWI (b = 1000 s/mm2) (B), and EPI-DWI (b = 1000 s/mm2) (C) of a healthy volunteer. The normal pituitary gland is clearly visualized with minimal image degradation on TSE-DWI (B), while it is not identifiable on EPI-DWI (C). Five ROIs are placed in the pons, the WM and GM regions of the vermis, and the genu and splenium of the corpus callosum (B and C). On TSE-DWI, an additional ROI is placed in the anterior pituitary lobe (B).
Statistical Analysis
The signal decay (relative signal intensity to the baseline) according to the increasing b-values in the phantom was compared between TSE-DWI and EPI-DWI by using the intraclass correlation coefficient (ICC). The intermodality agreement of the 3 IVIM parameters (D, f, and D*) between TSE-DWI and EPI-DWI within the 5 ROIs in the brain parenchyma was evaluated by using the ICC and Bland-Altman plot. The interobserver agreement of the IVIM measurements was evaluated with respect to the 5 ROIs for EPI-DWI and 6 ROIs (including the pituitary gland) for TSE-DWI by using the ICC and Bland-Altman plot. The IVIM parameters in the anterior pituitary lobe were compared with those in the 5 ROIs in the brain parenchyma by using the Dunnett test. For the human studies, the measured values from the 2 observers were averaged to represent each ROI. Statistical analyses were performed by using commercially available software packages (GraphPad Prism 6, Version 6.07; GraphPad Software, San Diego, California; and MedCalc statistical software, Version 15.10.0; MedCalc Software, Mariakerke, Belgium). P values < .05 were considered significant.
Results
Phantom Study
The phantom experiment revealed almost perfect accordance in the signal decay between TSE-DWI and EPI-DWI (ICC = 1.0).
Human Studies
Study Participants.
According to the inclusion criteria, 8 healthy, young adult volunteers (2 men and 6 women; age range, 22–35 years; median age, 28 years) participated in the study.
Visual Assessment.
In all subjects, the pituitary gland was clearly visualized with a minimal degree of distortion on the isotropic TSE-DWI and was rated as good. On the other hand, the pituitary gland was undetectable due to severe susceptibility artifacts with EPI-DWI in all subjects (Fig 1).
Intermodality Agreement.
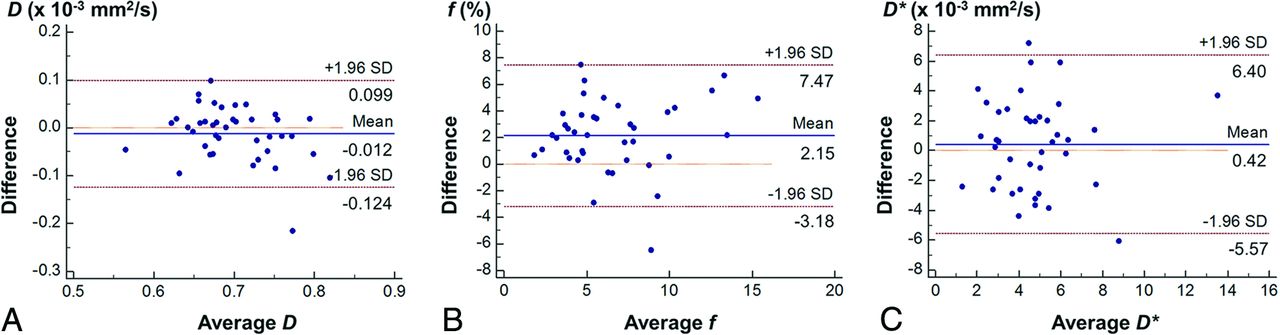
The intermodality agreement for the IVIM parameters was moderate (ICC = 0.571) for D, substantial (ICC = 0.699) for f, and fair (ICC = 0.405) for D*. The Bland-Altman analysis showed that the 95% limits of agreement between the 2 methods were −0.124, 0.099 × 10⁻³ mm2/s for D; −3.18%, 7.47% for f; and −5.57, 6.40 × 10⁻³ mm2/s for D* (Fig 2). The f was slightly overestimated in TSE-DWI compared with EPI-DWI. No obvious systematic bias was shown for the other 2 parameters.

Bland-Altman plots of D (A), f (B), and D* (C) assessing the intermodality agreement between TSE-DWI and EPI-DWI.
Interobserver Agreement.
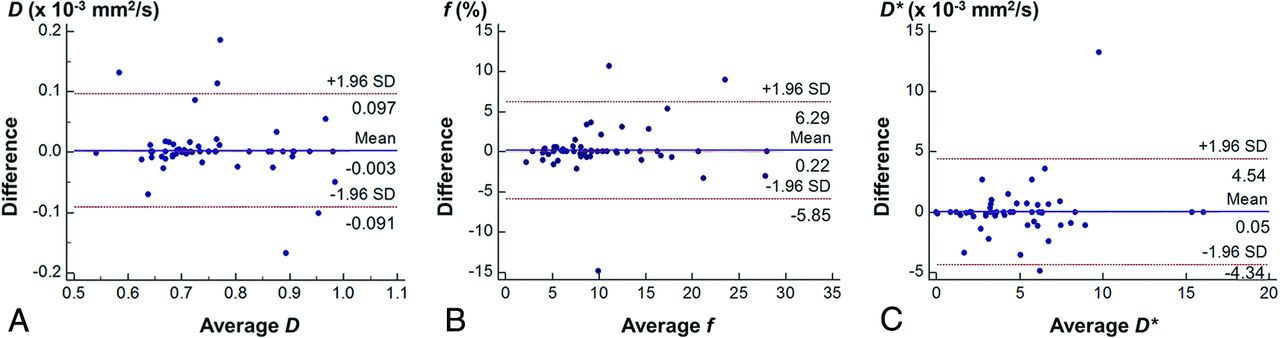
Our evaluation of the interobserver agreement for the IVIM parameters showed almost perfect agreement for D (ICC = 0.907) and f (ICC = 0.872) and substantial agreement (ICC = 0.786) for D*. The Bland-Altman analysis showed that the 95% limits of agreement between the 2 observers were −0.091, 0.097 × 10⁻³ mm2/s for D; −5.85%, 6.29% for f; and −4.34, 4.45 × 10⁻³ mm2/s for D* (Fig 3). No obvious systematic bias was shown for any parameter. The evaluation of interobserver agreement for EPI-DWI resulted in almost perfect agreement for each IVIM parameter: ICC = 0.876, 0.907, and 0.853 for D, f, and D*, respectively. The Bland-Altman analysis showed no obvious systematic bias in any parameter, and the 95% limits of interobserver agreement were −0.092, 0.098 × 10⁻³ mm2/s; −3.92%, 4.10%; and −4.23, 3.62 × 10⁻³ mm2/s for D, f, and D*, respectively.

Bland-Altman plots of D (A), f (B), and D* (C) obtained with TSE-DWI, assessing the interobserver agreement.
IVIM Parameters in the Anterior Pituitary Lobe.
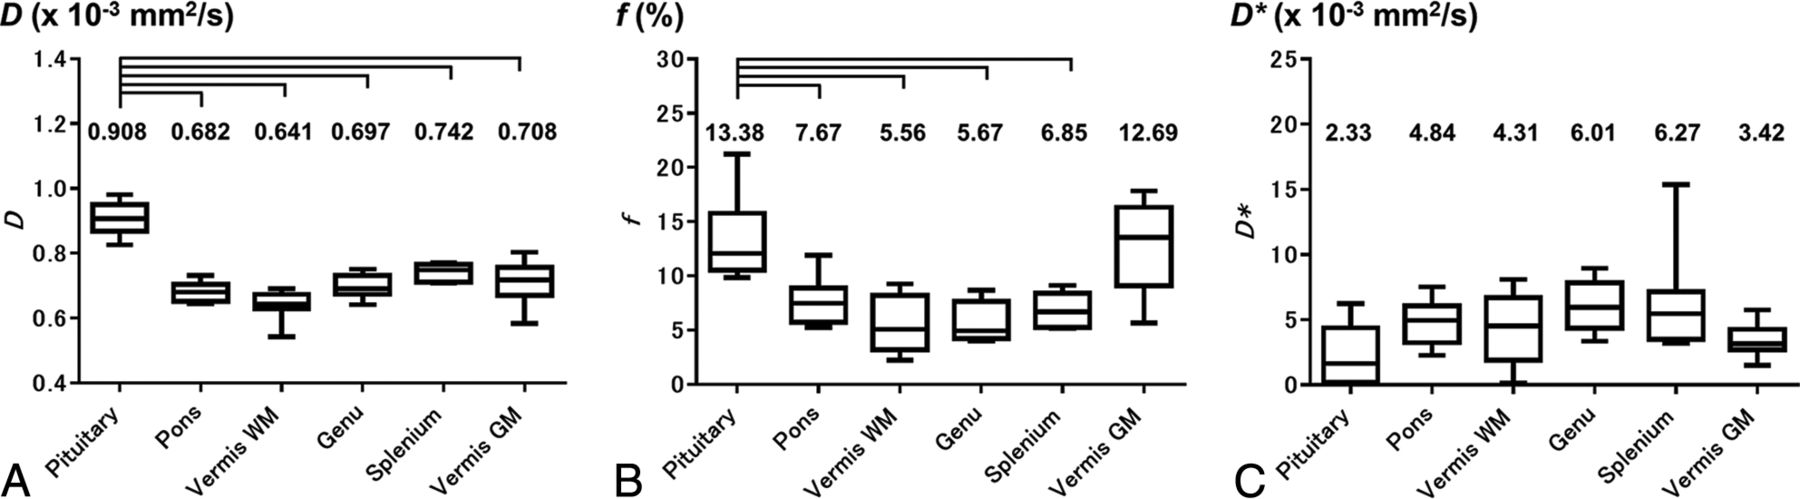
The mean D in the normal anterior pituitary lobe was 0.908 ± 0.050 × 10⁻³ mm2/s, which was significantly higher than that in the pons (0.682 ± 0.030 × 10⁻³ mm2/s); the vermian WM (0.641 ± 0.045 × 10⁻³ mm2/s) and GM (0.708 ± 0.067 × 10⁻³ mm2/s); and the genu (0.697 ± 0.036 × 10⁻³ mm2/s) and splenium (0.742 ± 0.027 × 10⁻³ mm2/s) of the corpus callosum (all comparisons, P < .001). The mean f in the normal anterior pituitary lobe was 13.38% ± 3.85%, which was significantly higher than that in the pons (7.67% ± 2.14%), the vermian WM (5.56% ± 2.63%), and the genu (5.67% ± 1.84%) and splenium (6.85% ± 1.58%) of the corpus callosum (P < .001), while it was not significantly different from that in the vermian GM (12.69% ± 4.21%). The mean D* in the normal anterior pituitary lobe (2.33 ± 2.29 × 10⁻³ mm2/s) was not significantly different from that in the pons (4.84 ± 1.74 × 10⁻³ mm2/s), the vermian WM (4.31 ± 2.85× 10⁻³ mm2/s) and GM (3.42 ± 1.29× 10⁻³ mm2/s), and the genu (6.01 ± 1.93 × 10⁻³ mm2/s) and splenium (6.27 ± 3.98 × 10⁻³ mm2/s) of the corpus callosum (Fig 4). The D and f maps of a representative subject are shown in Fig 5.

IVIM parameters in the anterior pituitary lobe compared with those in 5 brain regions (pons, GM and WM of vermis, and genu and splenium of corpus callosum): D (A), f (B), D* (C). Brackets indicate a significant difference (P < .001).

Representative example of TSE-DWI (b =1000 s/mm2) of the pituitary gland (A) and corresponding maps of D (B) and f (C).
Discussion
As we expected, the normal pituitary gland was clearly visualized with minimal degradation with TSE-DWI, while severe susceptibility artifacts were noted in conventional EPI-DWI. Due to distortion and signal loss, quantitative evaluation of the pituitary gland was extremely difficult with EPI-DWI. Thus, previous studies with EPI-DWI have been mainly limited to pituitary macroadenomas, apoplexy, abscesses, or other parasellar lesions.6⇓⇓–9 To overcome image degradation, other researchers have applied non-EPI-DWI, such as single-shot fast spin-echo,10 line scan,11 and periodically rotated overlapping parallel lines with enhanced reconstruction DWI for sellar and parasellar lesions.12 However, none of these studies aimed at evaluation or IVIM analysis of the normal pituitary gland. Recently, Hiwatashi et al13 evaluated the ADC of the normal anterior pituitary lobe by 3D turbo field echo with diffusion-sensitized driven-equilibrium preparation, a novel high-resolution 3D, non-EPI-DWI technique. They validated the ADC measurement with diffusion-sensitized driven-equilibrium preparation by comparing it with conventional EPI-DWI. To our knowledge, theirs is the only report to demonstrate the feasibility of quantitative diffusion measurement of the normal pituitary gland. However, IVIM of the normal pituitary gland has never been evaluated.
To date, IVIM has been used mainly for assessment in non-central nervous system organs. For example, it has been used to evaluate liver cirrhosis, assess the vascularity of abdominal tumors, and detect early responses to anticancer therapy.14,15 Applications for intracranial and head and neck diseases have also been increasingly reported.3,16 In these studies, an EPI-based DWI sequence was almost invariably used. However, as mentioned above, EPI-DWI can have susceptibility artifacts in the skull base and head-and-neck regions. Sakamoto et al17 reported IVIM imaging, based on a non-EPI-DWI technique, HASTE-DWI, in head-and-neck tumors. In their study, however, validation of their imaging technique was not attempted. In our study, IVIM assessment based on TSE-DWI was compared with that based on conventional EPI-DWI, and it was shown that TSE-DWI can provide a D and f that are similar to those based on EPI-DWI. On the other hand, limited agreement was noted for D*. This may be due to the high variability in the D* measurement, as shown in previous reports.14
Moreover, our results demonstrated acceptable interobserver reproducibility in IVIM measurements with TSE-DWI.
Our results show that D in the normal anterior pituitary lobe was significantly higher than that in the pons, the GM and WM vermis, and the corpus callosum. This finding is consistent with the report by Hiwatashi et al13 that the ADC in the anterior pituitary lobe was significantly higher than that in the pons and the vermis; though unlike D, the ADC represented both the true diffusion and the capillary perfusion. As they speculated, lack of myelination may contribute to the higher D value in comparison with that in the brain parenchyma.13 Our results also show that the f in the anterior pituitary lobe was significantly higher than that in the pons, the vermian WM, and the genu and splenium of the corpus callosum, while it was comparable with that in the vermian GM. Theoretically, f is considered proportional to cerebral blood volume.18 Measurement of perfusion parameters in the anterior pituitary lobe has never been reported, to our knowledge; thus, there are no previous imaging results to use as a reference. Nevertheless, this finding is consistent with previously documented high-histologic vascular density.19 Future studies based on noninvasive perfusion methods, such as dynamic contrast-enhanced perfusion MR imaging, are necessary to further confirm our findings. No significant difference was shown in D* between the anterior pituitary lobe and the brain parenchyma. This may be attributable to the known high variability in the D* measurement.20
Our results suggest that IVIM is applicable to pituitary lesions such as pituitary adenomas. Currently, MR imaging evaluation of pituitary lesions requires contrast-enhanced imaging, typically dynamic contrast-enhanced studies.21 IVIM based on TSE-DWI may serve as an alternative imaging method to characterize pituitary lesions for patients with impaired renal function or allergic reactions to contrast agents. Moreover, perfusion assessment of the anterior pituitary lobe could be relevant to functional pituitary diseases. A previous article suggested that pituitary hormone deficiency is closely related to perfusion abnormalities in the adenohypophysis.22
This study has several limitations. Our TSE-DWI IVIM sequence had limited spatial resolution. In most previous studies on brain IVIM imaging, a high number of b-values (typically >10) were used to ensure the accuracy and reproducibility of the measurement.2,3 We decided to use 13 b-values to remain conservative in terms of b-value settings in this feasibility study. In a given imaging time, this choice resulted in low spatial resolution, in which the number of voxels covering the anterior pituitary lobe was limited (8–12 voxels). Recent studies have proposed simplified IVIM techniques with reduced numbers of b-values and acceptable measurement precision.23 Introduction of such methods would allow pituitary IVIM imaging with higher spatial resolution. Our subjects were limited to a small number of healthy young adults with relatively large pituitary glands for this feasibility study. For imaging smaller pituitary glands in elderly individuals and for small pituitary lesions, we may need to improve the spatial resolution. Because we used healthy volunteers, we could not show histologic evidence for IVIM parametric differences between the pituitary gland and brain parenchyma.
Conclusions
Our results demonstrated the feasibility of IVIM parameters, specifically D and f, of the normal anterior pituitary lobe by using the TSE-DWI technique. D in the anterior pituitary lobe was significantly higher than that in the brain parenchyma, while f was comparable with that in the cerebellar GM. These findings likely reflect the structural and perfusion characteristics of the anterior pituitary lobe at the microscopic level.
References
- Received April 5, 2016.
- Accepted after revision July 16, 2016.
- © 2016 by American Journal of Neuroradiology


Jump to section
Related Articles
Cited By...
- No citing articles found.