
Abstract
BACKGROUND AND PURPOSE: Accurately and efficiently modeling the transport of angiographic contrast currently offers the best method of verifying computational fluid dynamics simulations and, with it, progress toward the lofty goal of prediction of aneurysm treatment outcome a priori. This study specifically examines the influence of estimated flow rate and contrast properties on such in silico predictions of aneurysm contrast residence and decay.
MATERIALS AND METHODS: Four experimental sidewall aneurysms were created in swine, with aneurysm contrast flow patterns and decay rates observed under angiography. A simplified computational fluid dynamics model of the experimental aneurysm was constructed from 3D angiography and contrast residence predicted a priori. The relative influence of a number of estimated model parameters (contrast viscosity, contrast density, and blood flow rate) on contrast residence was then investigated with further simulations.
RESULTS: Contrast infiltration and washout pattern were accurately predicted by the a priori computational fluid dynamics model; however, the contrast decay rate was underestimated by ∼25%. This error was attributed to the estimated parent vessel flow rate alone, and the effects of contrast viscosity and density on the decay rate were found to be inconsequential. A linear correlation between the parent vessel flow rate and the corresponding contrast decay rate was observed.
CONCLUSIONS: In experimental sidewall aneurysms, contrast fluid properties (viscosity and density) were shown to have a negligible effect on variation in the modeled contrast decay rate. A strong linear correlation was observed between parent vessel flow rate and contrast decay over a physiologically reasonable range of flow rates.
ABBREVIATIONS:
- CFD
- computational fluid dynamics
- Q
- flow rate (mL/min)
- Re
- Reynolds number
The complex hemodynamic environment in and around a cerebral aneurysm has been linked to the initiation, development, and possible rupture of the lesion.1⇓–3 Observing angiographic contrast in the dome of an aneurysm remains the primary means a clinician uses to obtain a high-resolution and real-time assessment of both the quantity and quality of aneurysmal blood flow. These in vivo observations may be complemented by computational fluid dynamics (CFD) simulations, which elucidate properties that cannot be measured clinically, such as wall shear stress, and provide a predictive capacity and the possibility of virtual treatment planning.4,5
The role of CFD in the field of neuroradiology is controversial and has become the focus of much fruitful discussion.6⇓–8 A key point in this discussion is the need to bring the disciplines closer by combining the merits of computational and bench testing with those of animal models and clinical cases, to move toward a sophisticated model of intracranial aneurysm as a disease.9,10 Angiographic contrast transport is the only property common to both simulated hemodynamic measures and the complex biochemical environment that may be observed clinically. Hence, the need for accurately modeling contrast in silico is clear: CFD simulations may begin to be verified with the clinical criterion standard, and the quantification of aneurysm contrast/blood residence times has the potential to provide a direct link to models of intracranial aneurysm remodelling and thrombus formation.11⇓–13
Implementations of such virtual contrast models, which approximate contrast as a dye-like scalar, are relatively simple.11,14⇓–16 Although these simulations produce physically meaningful contrast washout behavior, inaccuracies remain that are attributed to not explicitly modeling contrast properties (density and viscosity) or variations in patient-specific vessel flow rates.14,15,17 Some models in the literature have shown very accurate replication of contrast infiltration and washout curves by directly matching properties estimated from angiography a posteriori (heart rate, flow rate, contrast bolus profile, and so forth).15 However, the clinical usefulness and predictive strength of such a result are limited.
This study was instead conducted by using a generalist approach; only the aneurysm and parent vessel 3D geometry were extracted from angiography with all other simulation parameters estimated. A range of parameters were modeled, including the parent vessel flow rate and both the viscosity and density of the angiographic contrast medium, with the relative influence of each parameter on contrast decay quantified. The surgically created aneurysm model, with known dimensions, allowed any variation in results due to angiographic reconstruction to be controlled for, unlike in previous studies.11,14⇓–16 Such an approach makes advances toward accurate a priori prediction of contrast washout, requiring only a 3D reconstruction of the aneurysm in question, which may be obtained from any imaging technique.
Materials and Methods
Experimental Setup
Experimental aneurysms were created in a porcine animal model by using 2 female Large White pigs of 60–65 kg and adopting the method described by German and Black.18 Each sidewall aneurysm was formed surgically by vein graft by using the jugular vein cut at 45°, forming an anastomosis on the common carotid artery with continuous 8/0 stitching. One aneurysm was formed on each common carotid artery in both animals, with a total of 4 experimental aneurysms of near-identical size and shape. The common carotid artery was observed to have a diameter of approximately 4 mm in both animals, and the resulting sidewall aneurysms had a 5-mm diameter, 15-mm length, and 7-mm neck diameter. After creation, the aneurysms healed for 3 weeks to allow any local swelling to dissipate and for endothelialization at the anastomosis site to stabilize. Both animals were administered dual antiplatelet therapy following the surgical procedure.
Three weeks postcreation, each animal was catheterized via the femoral artery, and angiography was performed on an Innova 4100 system (GE Healthcare; Milwaukee, Wisconsin). 3D rotational angiography was used to accurately reconstruct the vessel and aneurysm geometry, while 2D angiography was used to verify the patency of each aneurysm and observe angiographic contrast washout in the aneurysm dome. A single series of 2D DSA acquisitions in the coronal plane was made for each of the 4 experimental aneurysms. Additionally, sagittal plane imaging was performed to verify complete and uniform contrast filling in each aneurysm. The 3D rotational runs were performed at a rotation speed of 20° per second with a 20-mL contrast injection delivered at 2 mL/s, and the 2D runs were conducted at 7.5 frames per second with a 10-mL contrast injection delivered at 7.5 mL/s. In all imaging, the catheter tip was located ∼100 mm (25 vessel diameters) proximal to the aneurysm, and good contrast mixing was observed across the entire vessel lumen.
Ethics approval was obtained from the Oxford institutional ethics committee. Both animals were subsequently implanted with a flow-diverter device and formed part of a larger unrelated study, which is not reported in this article.
Postprocessing
DICOM postprocessing was completed in OsiriX Imaging Software, Version 7.5.1 (http://www.osirix-viewer.com), where 3D geometries were segmented and the resulting vascular surfaces were exported as STereoLithograph files. Good correspondence was seen among a number of metrics (vessel diameter, aneurysm diameter, aneurysm neck diameter, and aneurysm length) measured at both the surgical creation and on the 3D reconstruction created from angiography 3 weeks postcreation. Visually, the flow patterns among the 4 experimental aneurysms appeared identical, with contrast entering the aneurysm neck distally and circulating around the whole aneurysm dome, forming 1 large vortex.
The 2D DICOM images were exported and segmented in Matlab (MathWorks, Natick, Massachusetts). A segmentation window isolating the aneurysm dome from the parent vessel was created manually for each experimental aneurysm, and the mean gray-scale value in the aneurysm dome was calculated for each DICOM in the time-series.
Experimental Calibration
To verify the direct correspondence between pixel gray-scale value and contrast concentration, we performed a brief calibration experiment. A number of 10-mL syringes were filled with a mixture of saline and contrast medium in varying concentrations (0%–50% contrast by volume) and were imaged by using a standard neck/cerebral DSA protocol. After we subtracted background values, the mean gray-scale value of each syringe was found to vary linearly with contrast concentration.
CFD Simulations
Given the similarity in vessel size, aneurysm size, and aneurysm flow pattern among the 4 experimental aneurysms and in the interest of increasing computational efficiency, the 3D geometry of only 1 aneurysm was selected for the computational study. The aneurysm geometry was imported into CFD-VisCART (ESI Group, Paris, France) and meshed; unstructured meshing was completed with a minimum mesh density of 4000 elements/mm3, resulting in a total mesh size of 4,290,000 elements.
Contrast was modeled computationally as an independent scalar quantity introduced at the simulation inlet and transported in the bulk flow, similar to dye particles. Although this method is a major simplification of what is, in reality, a 2-fluid mixing problem, the reduction in both computational cost and the complexity required to characterize true 2-fluid flow are considerable. The modeled contrast does not alter the simulated blood density or viscosity and has a diffusivity in blood of 1.0 × 10⁻⁷ mm2/s, an order of magnitude estimate based on the diffusivity of tracer particles in blood.19 A uniform contrast bolus was prescribed at the geometry inlet with a duration of 1 cardiac cycle. Thus, the total contrast transport seen virtually can be considered analogous to the experimental transport averaged over the cardiac cycle.
The computational mesh was imported into the multiphysics suite CFD-ACE+ (ESI Group). Blood flow was modeled as an incompressible fluid with unsteady 3D Navier-Stokes governing equations, with second-order interpolations in space and time, a time-step of 0.01 second, a rigid arterial wall, a fluid density of 1000 kg/m3, and a dynamic viscosity of 0.004 Pa × s. We adopted a Newtonian fluid model, assuming that non-Newtonian flow effects are small in both the aneurysm dome and arteries with a diameter of >0.5 mm.20,21 We ignored gravitational effects, assuming that the experimental aneurysms remained located, as created, in the approximate horizontal (coronal) plane.
The transient simulation was run with a time-varying inflow based on the profile of flow in the human ICA, derived from a 1D model of the vasculature, as depicted in Fig 1.22 Because an accurate profile of flow in a porcine common carotid artery was not available to the authors, we concluded that the similarity in flow rate, artery diameter, and distance from the heart between the porcine common carotid artery and the human ICA made this assumption reasonable. This assumption is interrogated further in the discussion that follows. A radially symmetric inlet velocity profile was prescribed at the inlet and scaled to give a mean flow rate of 230 mL/min.

Parent vessel flow rate profiles based on the human ICA.
The simulation was run on thirty-two 2.93-GHz cores, with each time-step converging to 5 orders of magnitude residual reduction in around 50–100 iterations in a typical solution time of 30 minutes per time-step. The contrast bolus of 0.8-second duration was introduced after 2 full cardiac cycles (1.60 seconds real time) to reduce the influence of initial transient flow effects. The simulation was run for a further 4 cardiac cycles after the contrast bolus was first introduced, giving a total simulation time of 6 cardiac cycles (4.80 seconds real time). The absolute value of contrast residing in the aneurysm dome of the simulated geometry was then exported at every fourth time-step.
Virtual angiography was generated by aligning the simulation geometry into the same plane as that seen experimentally before the simulated contrast concentration distribution was then discretized into a 100 × 150 grid of pixels (approximately matching the experimental imaging resolution of 0.2 × 0.2 mm).
Accounting for Contrast Properties
A second set of simulations was conducted to quantify the influence of contrast properties. In the absence of a true 2-fluid model, flow effects arising from the local gradient in viscosity and density between blood and contrast could not be modeled explicitly. Instead, we ran simulations, assuming a working fluid equivalent to a perfect 50:50 mixture of blood and contrast, which was transported though the geometry for the entire simulation (ie, before, during, and after the virtual contrast bolus was introduced).
In an attempt to quantify the overall influence of contrast properties, 2 media were chosen that represented the greatest overall change in fluid properties. Specifically, contrast media with the highest and lowest ratios of density to viscosity were chosen (as summarized in Table 1), which correspondingly increase and decrease the simulation Reynolds number (Re) to the greatest degree.
Contrast media properties
The density, viscosity, and equivalent change in inlet Reynolds number for the simulations incorporating the properties of each contrast agent (assuming a 50:50 mix of contrast and blood) are summarized in Table 2. For comparison, the equivalent mixture of blood and the contrast agent used experimentally (iohexol, Omnipaque 240; GE Healthcare, Piscataway, New Jersey) would result in an effective increase in the Re of 23%. Both simulations (high Re and low Re) were run with the same parameters and postprocessed in the same manner as described in the previous section.
Contrast-blood mixture properties
Accounting for Parent Vessel Flow Rate
Approximating the average and instantaneous parent vessel flow rate is an additional source of error in simulated contrast washout behavior that is often reported in the literature. To quantify this variation, we conducted a third and final set of CFD simulations with altered mean parent vessel flow rates corresponding to a 50% increase (345 mL/min) and 50% decrease (115 mL/min) compared with the mean human ICA rate (230 mL/min) used in previous simulations. The overall shape of the flow profile in time was unaltered and was only scaled to achieve an altered flow rate, as indicated in Fig 1.
The 50% increased flow rate was chosen as an approximation to the flow rate of a human common carotid artery, which could also be considered an upper estimate of the flow rate in the experimental porcine common carotid artery. The 50% decreased flow rate was selected as an order-of-magnitude estimate based on previous experiments conducted by the authors, which quantified flow rate reduction in a vessel cross-section partially occluded by a catheter lumen. Hence, it was assumed that the range of mean flow rates considered (115–345 mL/min) encompassed that likely to be seen experimentally. Both simulations with altered flow rate (Q) (low Q and high Q) were run with solver settings and postprocessing procedures identical to simulations discussed previously.
Inferring Experimental Flow Rate
Finally, by tracking the contrast-front transport in consecutive DICOM images, we calculated an estimate of the true experimental parent vessel flow rate, assuming a Poiseuille velocity profile. The velocity of the contrast-front was recorded for 2 consecutive 0.133-second intervals in each experimental aneurysm, which resulted in 8 separate estimates of the instantaneous parent vessel flow rate.
Results
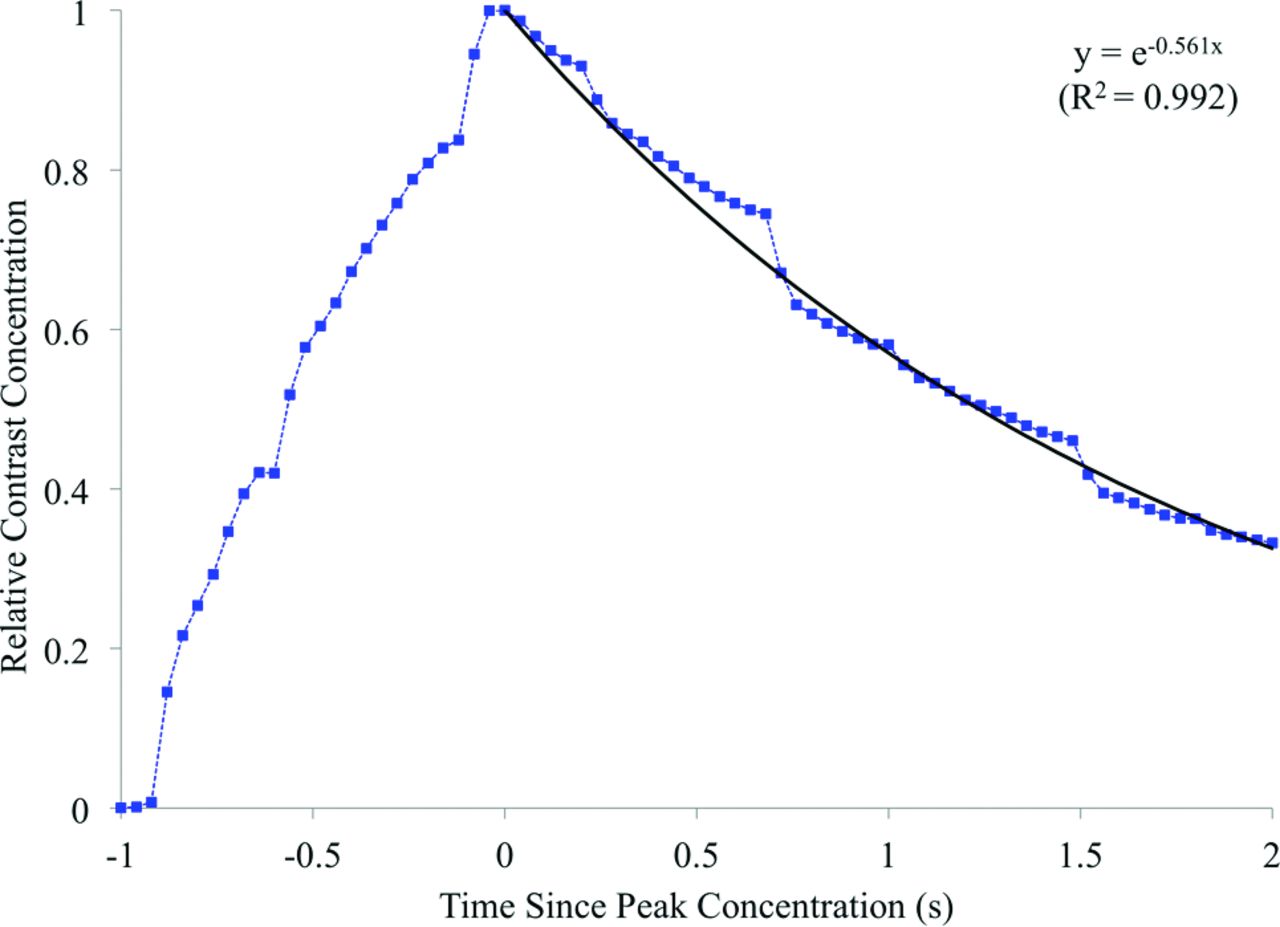
Contrast concentration, averaged over the aneurysm dome, for each experimental aneurysm is summarized in Fig 2. The contrast curves are aligned to peak relative contrast concentration, at t = 0 seconds. Assuming a capacitor-based model of contrast residence, we fitted an exponential decay curve to the decay portion of the experimental data with a decay constant of 0.758 second−1. Simulated contrast residence is shown in Fig 3, with a corresponding exponential curve fitted and a decay constant of 0.561 second−1. Experimental and virtual angiography is shown in Fig 4, where the same convention of aligning the peak contrast concentration to 0.0 seconds is adopted.

Experimental contrast residence curves for all 4 experimental aneurysms and the fitted exponential decay curve.

Simulated contrast residence curve and the fitted exponential decay curve.

Experimental (upper) and virtual (lower) DSA. Images are separated by 0.40-second intervals and aligned at 0.0 seconds to peak aneurysm contrast concentration.
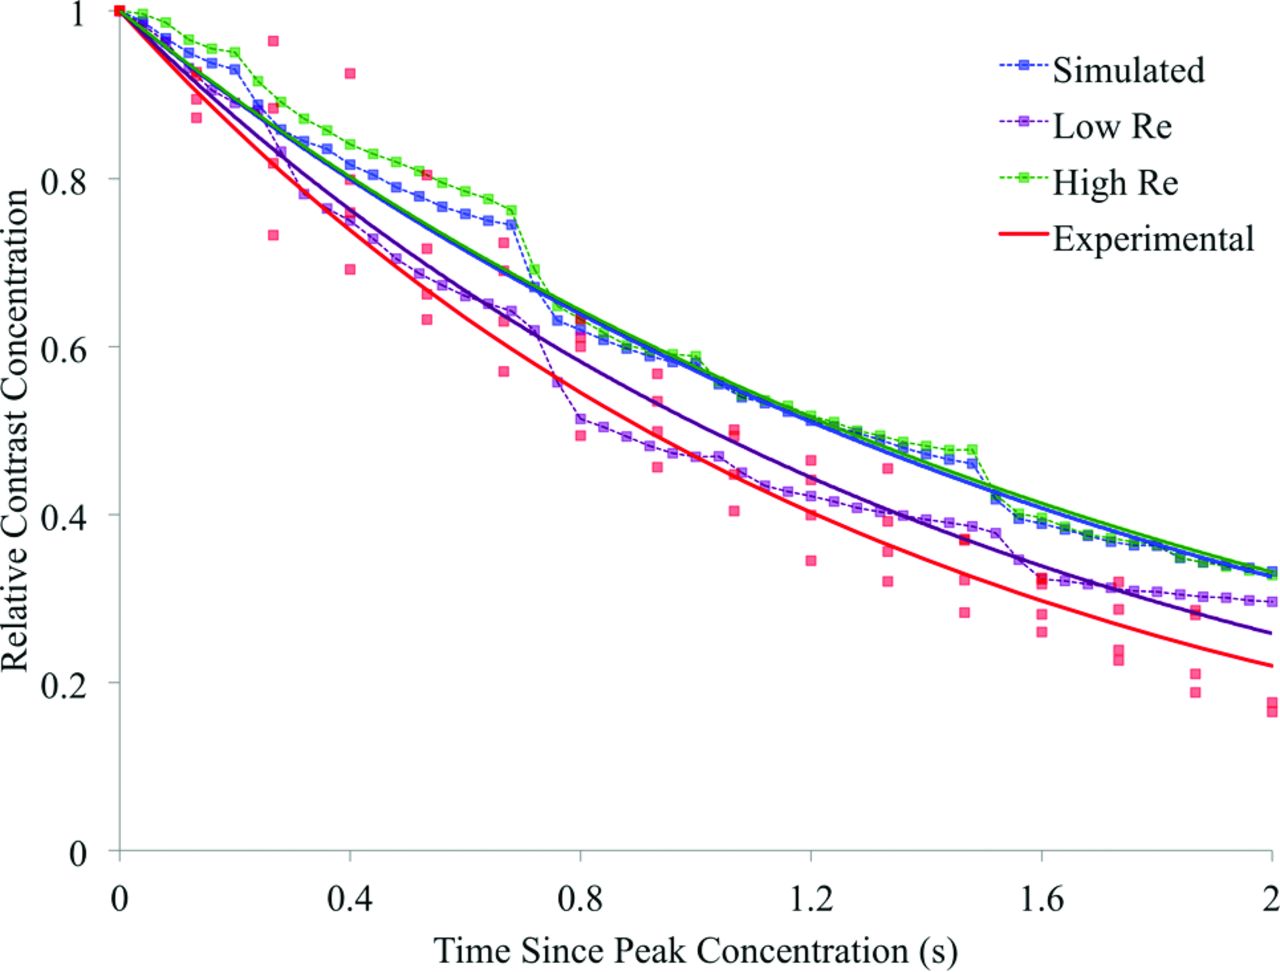
The contrast decay curves for the simulations conducted at altered Reynolds numbers and parent vessel flow rates are displayed in Figs 5 and 6, respectively. These decay curves are plotted alongside both the initial simulated contrast concentration and the experimental results. The corresponding exponential decay constants for the experimental results and each of the 5 simulations are summarized in Table 3. In Fig 7, the exponential decay constants of the simulations conducted at the initial, high, and low flow rates are plotted against mean flow rate, with a linear trend line fitted, assuming direct proportionality.

Simulated and experimental contrast decay incorporating variation in simulated contrast density and viscosity.

Simulated and experimental contrast decay incorporating variation in the simulated parent vessel flow rate.
Summary of experimental and simulated contrast decay constants

Simulated contrast decay constant and mean parent vessel flow rate.
Finally, the 8 instantaneous parent vessel flow rates that were extracted from the experimental angiography are found to correspond to a mean parent vessel flow rate of 296 mL/min with a range of 202–516 mL/min.
Discussion
The global contrast transport in the experimental aneurysm dome is well-described by the exponential decay model proposed in Fig 2, with little variation seen across all 4 experimental aneurysms. In agreement with the observations of others in the literature, the modeling of contrast agent in this study as an independent scalar transported in simulated fluid flow accurately replicates the behavior seen experimentally.14⇓–16
The overall contrast infiltration and washout patterns are similar for the experimental and simulated cases (Figs 2 and 3), but the simulated contrast decay constant is 26% lower than the experimental value. As such, after 2.0 seconds, approximately 25% of the total contrast volume remains in the aneurysm in the experimental case, but 35% of the simulated contrast remains. This underestimation of the simulated contrast decay constant (0.560 second−1) is beyond the range of scatter seen in the experimental data, where curves fitted to individual experimental aneurysm decay traces show decay constants of 0.68–0.859 second−1. The physical distribution of contrast within the aneurysm dome is well-predicted by the simulation, with similar areas of infiltration, circulation, and washout visible in the experimental and simulated angiography of Fig 4. However, the lower rate of contrast decay in the simulated case results in increased aneurysm contrast residence and a noticeably darker angiogram.
The range in simulated contrast decay constant seen over the high Re and low Re simulations is small and of the order of the scatter seen in the experimental data in Fig 5. Additionally, the range of decay constants across the 2 simulations (0.552–0.677 second−1) does not encompass the experimental value (0.758 second−1). Such a result suggests that the differences between blood and contrast fluid properties alone are unlikely to account for the discrepancy in the predicted contrast decay rate seen in the original simulation (Fig 3). This assumption is further reinforced by the highly asymmetric spread of the high Re and low Re curves in Fig 5, with no discernable difference between the initial and high Re simulations and the experimental contrast agent used, corresponding to a slight increase (23%) in the simulation Reynolds number.
As indicated in both Fig 6 and Table 3, the range in decay constant seen for the high Q and low Q simulations is both more substantial than the range seen in Fig 5 and encompasses the decay seen experimentally. Hence, a discrepancy between the experimental flow rate and the flow rate assumed a priori in the original CFD simulation is the most likely cause of the poor experimental contrast decay rate prediction.
The spread of the high Q and low Q simulation decay curves about the original simulation in Fig 6 is relatively symmetric, unlike the previous simulations of Fig 5. However, the high Q contrast curve is not as well-approximated to an exponential decay as the other simulation results; this outcome is likely due to the low degree of flow recirculation observed in the simulation, where flow streamlines traced the perimeter of the aneurysm dome before immediately exiting.
From the decay curves in Fig 6, it appears that a simulation adopting a parent vessel flow rate between the mean human ICA rate of the original simulation and the mean human common carotid artery rate of the high Q case would result in a contrast decay curve similar to that obtained experimentally. When the simulation flow rate and contrast decay rate for the high Q, low Q, and original simulations are plotted in Fig 7, a linear and directly proportional trend line may be fitted to the data. Thus, if one assumes this linear relationship between the decay and flow rates and an experimental cardiac profile similar to that in the human ICA/common carotid artery, a simulated mean parent vessel flow rate of approximately 290 mL/min would mimic the contrast decay rate of the in vivo model (0.758 second−1). Such a mean flow rate is both reasonable and only 2% lower than the mean flow rate of 296 mL/min that was estimated from experimental angiography.
Study Limitations
As previously discussed, the simplified contrast model implemented does not explicitly model the mixing of 2 fluids; hence, local gradients of contrast and blood fluid properties are not captured. However, given the rapid and fairly complete degree of blood and contrast mixing seen experimentally and the fundamental design of the contrast medium being highly diffusive, such a phenomenon is likely insignificant.
The experimental 2D DSA frame rate of 7.5 frames per second was chosen to approximately match the temporal resolution frequently used in the clinical setting. Although some flow effects may not be fully resolved temporally at such a frame rate, the relatively smooth curves and lack of any aliasing in Fig 2 suggest that the global aneurysm flow effects are adequately resolved. Additionally, the flow features observed in the simulated results (with an effective frame rate of 100 frames per second) did not show any high-frequency variations.
Over the range of flow rates considered (115–345 mL/min), there appears to be a simple linear relation between the parent vessel flow rate and aneurysm contrast decay rate. However, it is unclear whether a similar relationship would hold for other aneurysm geometries under similar flow rates. More generally, this study focused only on a sidewall aneurysm model, so any conclusions are unlikely to hold true in the drastically different flow environment of bifurcation aneurysms.
Finally, this study only focused on the global contrast concentration within the aneurysm dome. Local variation in contrast concentration, both in and out of the 2D DSA plane, was not quantified for simplicity and brevity, but a strong qualitative similarity was seen between experimental and simulated local contrast concentration patterns. The use of 4D angiographic technology in any future study would allow the time-varying 3D distribution of contrast in the aneurysm dome to be fully captured and the effect of contrast and flow properties on contrast distributions to be interrogated more completely.
Conclusions
Good correspondence was seen between a CFD contrast transport model and experimental results. Aneurysm flow patterns and contrast decay mechanisms were accurately predicted by simulation and may have the potential to offer clinical insight in treatment planning.
Modeled contrast fluid properties (viscosity and density) were shown to have a negligible effect on the aneurysm contrast decay rate, compared with assuming properties identical to a Newtonian blood model. Mismatch between the experimental and simulated contrast decay rate was attributed to an initial underestimate of the simulated parent vessel flow rate, later verified by angiography. This influence of patient-specific vessel flow rates remains a major challenge to a priori prediction of aneurysm contrast residence and treatment outcomes.
ACKNOWLEDGMENTS
All authors would like to thank Dr M. Megahed of the ESI Group for allowing the use of the CFD-ACE suite.
Footnotes
Disclosures: Thomas Peach, Yiannis Ventikos, Zhong You—RELATED: Grant: Wellcome Trust/Engineering and Physical Sciences Research Council (grant WT 088877/Z/09Z).* James Byrne—RELATED: Grant: Wellcome Trust (grant WT 088877/Z/09Z);* Support for Travel to Meetings for the Study or Other Purposes: Wellcome Trust (grant WT 088877/Z/09Z). *Money paid to the institution.
This study was funded by a grant from the Wellcome Trust (WT 088877/Z/09Z).
Indicates open access to non-subscribers at www.ajnr.org
References
- Received January 13, 2016.
- Accepted after revision June 2, 2016.
- © 2016 by American Journal of Neuroradiology


Jump to section
Related Articles
Cited By...
- No citing articles found.