
Abstract
BACKGROUND AND PURPOSE: The usefulness of pharmacokinetic parameters for glioma grading has been reported based on the perfusion data from parts of entire-tumor volumes. However, the perfusion values may not reflect the entire-tumor characteristics. Our aim was to investigate the feasibility of glioma grading by using histogram analyses of pharmacokinetic parameters including the volume transfer constant, extravascular extracellular space volume per unit volume of tissue, and blood plasma volume per unit volume of tissue from T1-weighted dynamic contrast-enhanced perfusion MR imaging.
MATERIALS AND METHODS: Twenty-eight patients (14 men, 14 women; mean age, 49.75 years; age range, 25–72 years) with histopathologically confirmed gliomas (World Health Organization grade II, n = 7; grade III, n = 8; grade IV, n = 13) were examined before surgery or biopsy with conventional MR imaging and T1-weighted dynamic contrast-enhanced perfusion MR imaging at 3T. Volume transfer constant, extravascular extracellular space volume per unit volume of tissue, and blood plasma volume per unit volume of tissue were calculated from the entire-tumor volume. Histogram analyses from these parameters were correlated with glioma grades. The parameters with the best percentile from cumulative histograms were identified by analysis of the area under the curve of the receiver operating characteristic analysis and were compared by using multivariable stepwise logistic regression analysis for distinguishing high- from low-grade gliomas.
RESULTS: All parametric values increased with increasing glioma grade. There were significant differences among the 3 grades in all parameters (P < .01). For the differentiation of high- and low-grade gliomas, the highest area under the curve values were found at the 98th percentile of the volume transfer constant (area under the curve, 0.912; cutoff value, 0.277), the 90th percentile of extravascular extracellular space volume per unit volume of tissue (area under the curve, 0.939; cutoff value, 19.70), and the 84th percentile of blood plasma volume per unit volume of tissue (area under the curve, 0.769; cutoff value, 11.71). The 98th percentile volume transfer constant value was the only variable that could be used to independently differentiate high- and low-grade gliomas in multivariable stepwise logistic regression analysis.
CONCLUSIONS: Histogram analysis of pharmacokinetic parameters from whole-tumor volume data can be a useful method for glioma grading. The 98th percentile value of the volume transfer constant was the most significant measure.
ABBREVIATIONS:
- AUC
- area under the curve
- DCE
- dynamic contrast-enhanced
- Ktrans
- volume transfer constant
- ROC
- receiver operating characteristic analysis
- Ve
- extravascular extracellular space volume per unit volume of tissue
- Vp
- blood plasma volume per unit volume of tissue
The growth of tumors beyond a certain size depends on the development of a vascular supply that meets the metabolic requirements of the neoplastic tissue.1⇓⇓–4 Newly developed vascular networks of tumors show increased tortuosity, lack of maturity, and increased permeability to macromolecules due to the presence of large endothelial cell gaps.5,6 In particular, high-grade gliomas are associated with a higher proportion of immature and hyperpermeable vessels.7,8
Angiogenesis and the microvascular system of gliomas have recently been the focus of grading before treatment and for evaluating posttherapy status with perfusion MR imaging. With contrast media, the dynamic change of signal intensity can be measured and converted into an analysis of perfusion changes. From the signal-time curves, many pharmacokinetic parameters can be extracted for the characterization of gliomas. Cerebral blood volume and cerebral blood flow, vascular permeability, and extravascular extracellular volume have been proposed as representative parameters derived from T1-weighted dynamic contrast-enhanced (DCE) perfusion-weighted imaging in the differentiation of glioma grades.8⇓⇓⇓⇓⇓⇓⇓–16 More recently, many reports based on T1-weighted DCE-PWI MR imaging have introduced volume transfer constant Ktrans, extravascular extracellular space volume per unit volume of tissue (Ve), and blood plasma volume per unit volume of tissue (Vp) as feasible parameters for glioma grading.8,10,17,18 Ktrans and Ve are pharmacokinetic parameters well-known for reflecting permeability. Ktrans is the volume transfer constant between the plasma and extravascular extracellular space. Ve is the extravascular extracellular space per unit volume of tissue and is known as leakage space.19,20 Vp is defined as the blood plasma volume per unit volume of tissue, which may be a marker of angiogenic activity in a tumor.13 However, previous studies collected the perfusion data from parts of entire-tumor volumes. Therefore, the presented values may not have reflected the entire tumor characteristics.
In this study, we obtained the pharmacokinetic parameters from the entire-tumor volume by using T1-weighted DCE MR images. We hypothesized that a histogram-based analysis of the pharmacokinetic parameters from the entire-tumor volume would be helpful for glioma grading because high-grade gliomas have a wide spectrum of histologic features, ranging from grade II to IV; this wide spectrum may account for sampling biases. The purposes of this study were to investigate the feasibility of using a histogram analysis of pharmacokinetic parameters, including Ktrans, Ve, and Vp, for glioma grading and to explore the diagnostic performance of the histogram analysis of these parameters.
Materials and Methods
This retrospective study was approved by our institutional review board. Patient informed consent was waived.
Patients
Between January 2010 and October 2012, fifty patients with initial DCE MR imaging at our institution (Seoul National University Hospital) were diagnosed with astrocytic tumors on the basis of the World Health Organization classification for tumors of the central nervous system. This study included 28 patients with the following inclusion criteria: 1) MR imaging was performed with a 3T scanner before treatment or biopsy; and 2) grade II, III, and IV gliomas were diagnosed. There were 14 male and 14 female patients enrolled (mean age, 49.75 years; age range, 25–72 years). In the enrolled patients, there were 28 gliomas (grade II, 7 gliomas; grade III, 8 gliomas; grade IV, 13 gliomas). Grade II gliomas were classified as low-grade, and grades III and IV were classified as high-grade.
MR Imaging Protocol
The MR imaging protocol consisted of conventional MR imaging and DCE MR imaging by using a 3T scanner with a 32-channel head coil (Magnetom Verio; Siemens, Erlangen, Germany). Conventional MR imaging included the following: T1-weighted imaging, such as transverse spin-echo imaging, before and after contrast enhancement; multiplanar reconstructed transverse, coronal imaging with a sagittal 3D magnetization-prepared rapid acquisition of gradient echo sequence, before and after contrast enhancement; transverse fluid-attenuated inversion recovery; and transverse T2-weighted imaging with turbo spin-echo sequences. Contrast-enhanced T1WI was performed after the intravenous administration of gadobutrol (Gadovist; Bayer Schering Pharma, Berlin, Germany), at a dose of 0.1 mmol/kg of body weight. Transverse spin-echo T1WI was performed with the following parameters: TR, 558 ms; TE, 9.8 ms; flip angle, 70°; matrix, 384 × 187; FOV, 175 × 220 mm; section thickness, 5 mm; and NEX, 1. We obtained the 3D-MPRAGE sequences by using the following parameters: TR, 1500 ms; TE, 1.9 ms; flip angle, 9°; matrix, 256 × 232; FOV, 220 × 250; section thickness, 1 mm; and NEX, 1. The parameters in axial FLAIR imaging were the following: TR, 9000 ms; TE, 97 ms; TI, 2500 ms; flip angle, 130°; matrix, 384 × 348; FOV, 199 × 220; and section thickness, 5 mm. The parameters of the transverse T2WI were as follows: TR, 5160 ms; TE, 91 ms; flip angle, 124°-130°; matrix, 640 × 510–580; FOV, 175–199 × 220; section thickness, 5 mm; and NEX, 3.
DCE MR imaging was performed with 3D gradient-echo T1WI after the intravenous administration of gadobutrol (0.1 mmol/kg of body weight) at a rate of 4 mL/s by using a power injector (Spectris MR injector; MedRad, Indianola, Pennsylvania). A 30-mL bolus injection of saline followed at the same injection rate. For each section, 40 images were acquired at intervals equal to the TR. The parameters were as follows: TR, 2.8 ms; TE, 1.0 ms; flip angle, 10°; matrix, 192 × 192; section thickness, 3 mm; FOV, 240 × 240 mm; voxel size, 1.25 × 1.25 × 3 mm3; pixel bandwidth, 789 Hz; total acquisition time, 1 minute 30 seconds.
Image Analysis
DCE MR images were processed by using the MR perfusion analysis method (nordicICE; Nordic Neuro Lab, Bergen, Norway), in which FLAIR or T2WI was used for structural imaging. On the basis of the 2-compartment pharmacokinetic model proposed by Tofts and Kermode,21 we used the perfusion analysis method to calculate pharmacokinetic parameters, including Ktrans, Ve, and Vp.21 Deconvolution with the arterial input function was performed in the pharmacokinetic model. For each tumor, the arterial input function was determined in intracranial tumor-supplying arteries near the tumor. Perfusion analysis was able to generate an arterial input function curve and a concentration-time curve of the tumor for each tumor-supplying artery in a region of interest. Two neuroradiologists (S.C.J. and S.H.C.) manually defined the ROIs by consensus. They chose an appropriate arterial input function curve to show the ideal relationship between the input function curve and the concentration-time curve. The arterial input function curves had higher values than the concentration-time curves and showed rapid wash-in and slow washout patterns, whereas the concentration-time curves showed a steady increase in the wash-in slope. The baseline T1 value was fixed at 1000 ms in this study.22
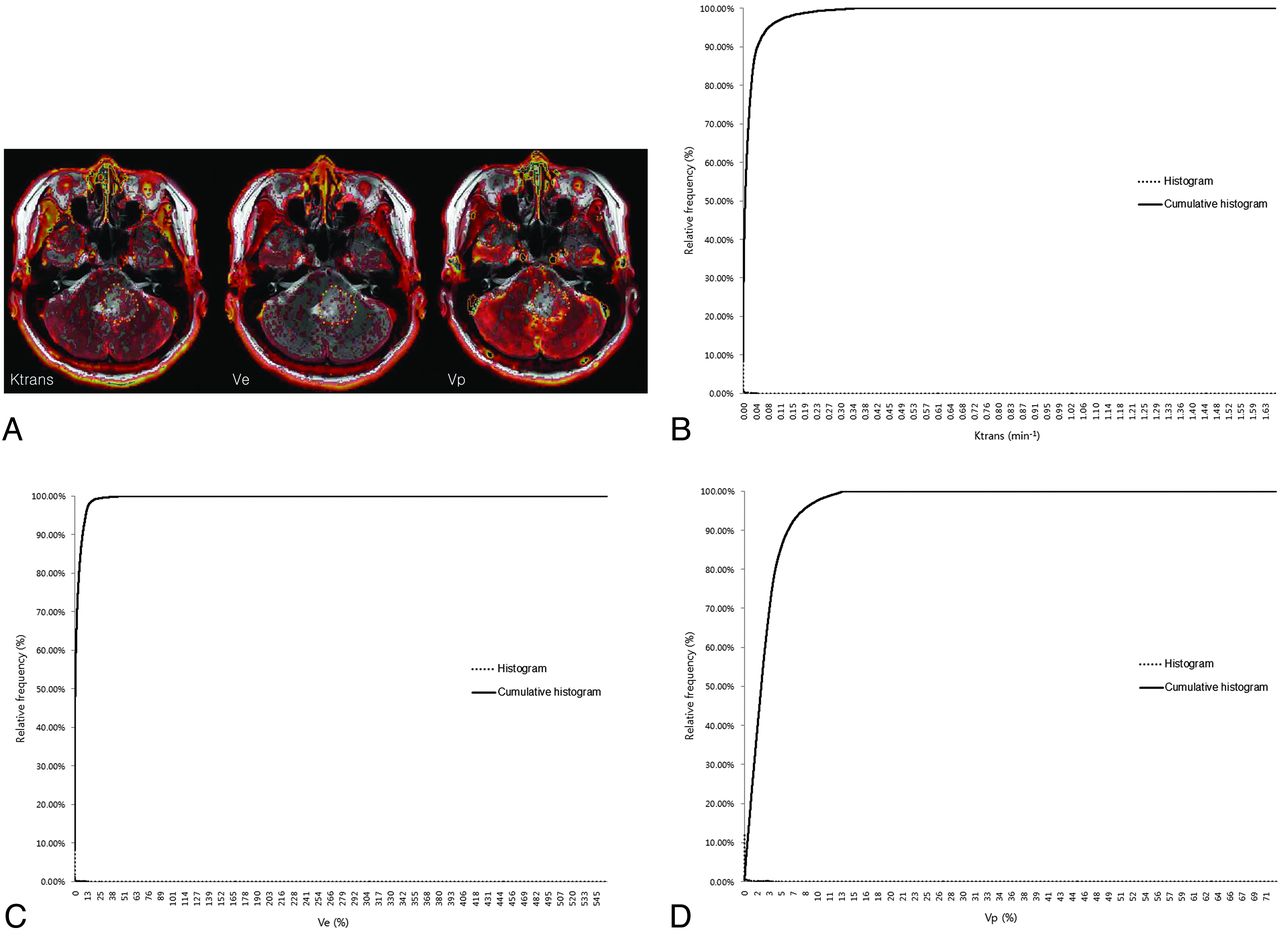
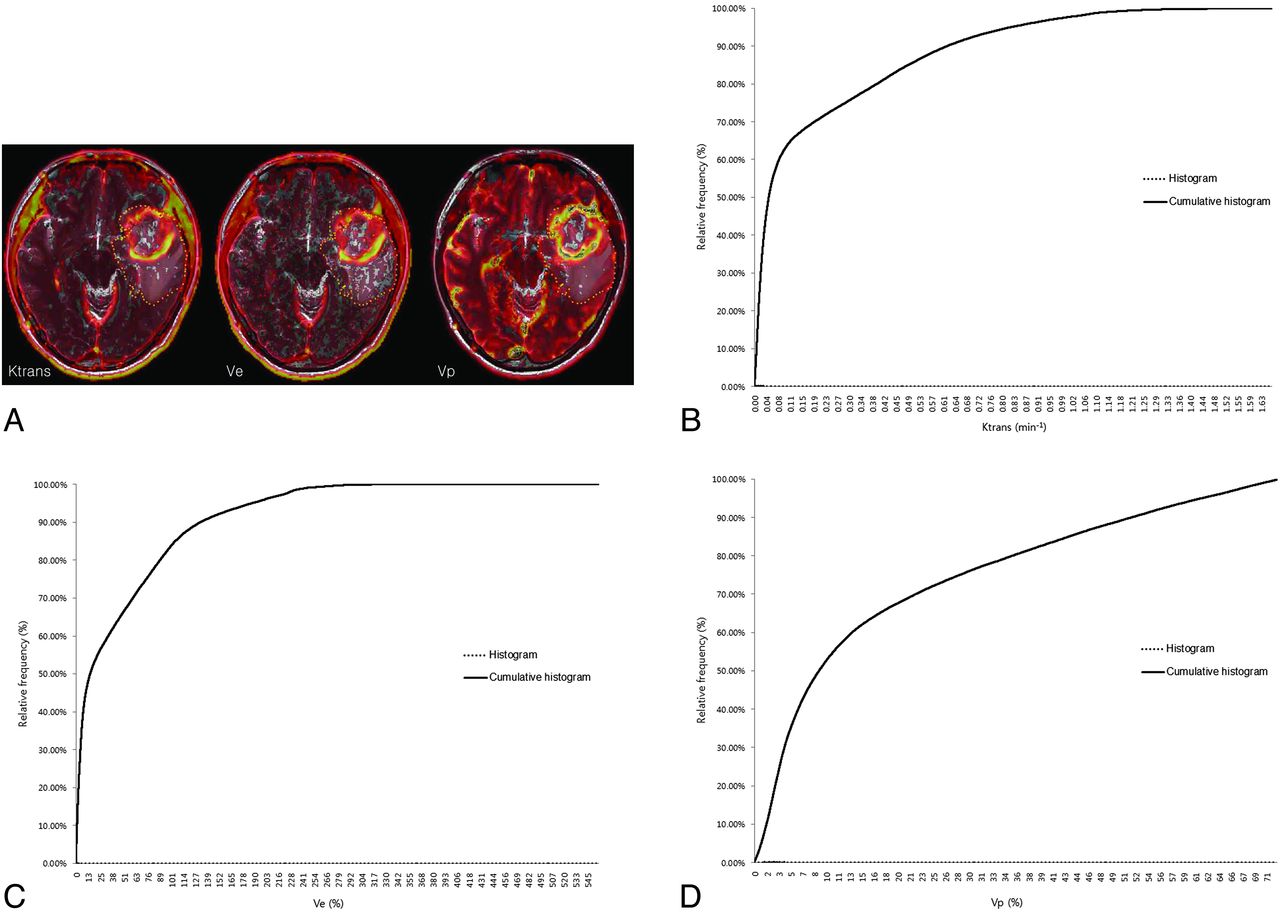
Pharmacokinetic parameters, including Ktrans, Ve, and Vp, were measured from each region of interest by a neuroradiologist (S.C.J.). The perfusion analysis method was used to calculate the pharmacokinetic parameters and to present these parameters as parametric maps. The coregistration between the structural images and parametric maps (color overlay) was accomplished automatically by using mutual information based on an algorithm that facilitated the search for an optimal rigid transformation aligning the 2 datasets.23⇓–25 The 2 reviewers defined the margins of the tumors on each axial plane by consensus, manually outlining the margins on the T2WI or FLAIR image by using the perfusion analysis workstation. The outline of the tumor region of interest was defined excluding the cystic or necrotic regions and intralesional macrovessels (Figs 1A, 2A, and 3A). On a pixel-by-pixel basis, all values of the parameters were calculated from an outline (region of interest) on an axial plane. The overall values for each tumor were obtained by summing the values from every plane. Finally, the total parametric values from the entire-tumor volume were acquired and recorded for each tumor.

ROIs manually defined on axial T2WI coregistered with parametric maps in a 43-year-old woman with a grade II glioma (A) and the histogram and cumulative histogram from the entire-tumor volume (B–D) are presented.

ROIs manually defined on axial T2WI coregistered with parametric maps in a 61-year-old man with a grade III glioma (B) and the histogram and cumulative histogram from the entire-tumor volume (B–D) are presented.

ROIs manually defined on axial T2WI coregistered with parametric maps in a 37-year-old woman with a grade IV glioma (C) and the histogram and cumulative histogram from the entire-tumor volume (B–D) are presented.
Statistical Analysis
Commercially available software (MedCalc for Windows, Version 11.1.1.0; MedCalc Software, Mariakerke, Belgium) was used for the analysis. The Kolmogorov-Smirnov test was used to determine whether values were normally distributed. For all statistical analyses, a 2-tailed P value < .05 was considered indicative of a statistically significant difference.
The mean and SD of the parametric values were calculated for each parameter. The values were compared according to the grade by using the unpaired t test.
The histograms were plotted with the parametric values on the x-axis, with a bin size of 1 × 10⁻⁴ min−1 for Ktrans, 1 × 10⁻² for Ve, and 1 × 10⁻² for Vp. The relative frequency was plotted on the y-axis of the histograms as a percentage of the total tumor volume, calculated by dividing the frequency in each bin by the total number of pixels.26 The ranges of the bins were chosen as 0–1.66 in Ktrans, 0–5.5765 in Ve, and 0–0.7201 in Vp because 1.66, 5.5765, and 0.7201 were the highest values for each parameter, respectively. The cumulative histograms were built from the aforementioned histograms. The relative cumulative frequency on the y-axis was expressed as a percentage summating the relative frequency from the first bin to a specified bin, and the parametric values were plotted on the x-axis (Figs 1B–D, 2B–D, and 3B–D).
A corresponding parametric value to a specific one from the 50th percentile (C50) to the 100th percentile (C100) was calculated in each tumor and parameter. Receiver operating characteristic (ROC) curves were generated to determine the optimum cutoff percentile for distinguishing high-grade from low-grade gliomas and differentiating grade III and IV tumors. The area under the curve (AUC), obtained from ROC analysis according to a specific percentile from C50 to C100, was analyzed. The percentiles with the highest AUC and the cutoff values with the best diagnostic performances (highest sensitivity and specificity) were presented in each parameter. The parameters with the best percentile values were compared by using a multivariable stepwise logistic regression model to determine the best predictors for differentiating high- and low-grade gliomas.27
Results
Mean Ktrans, Ve, and Vp values are presented according to the tumor grade in Table 1. The pharmacokinetic parameters increased with increasing glioma grade. There were significant differences among the grades for all parameters (P < .01).
The pharmacokinetic parameters in each grade of gliomaa
Histogram Analysis
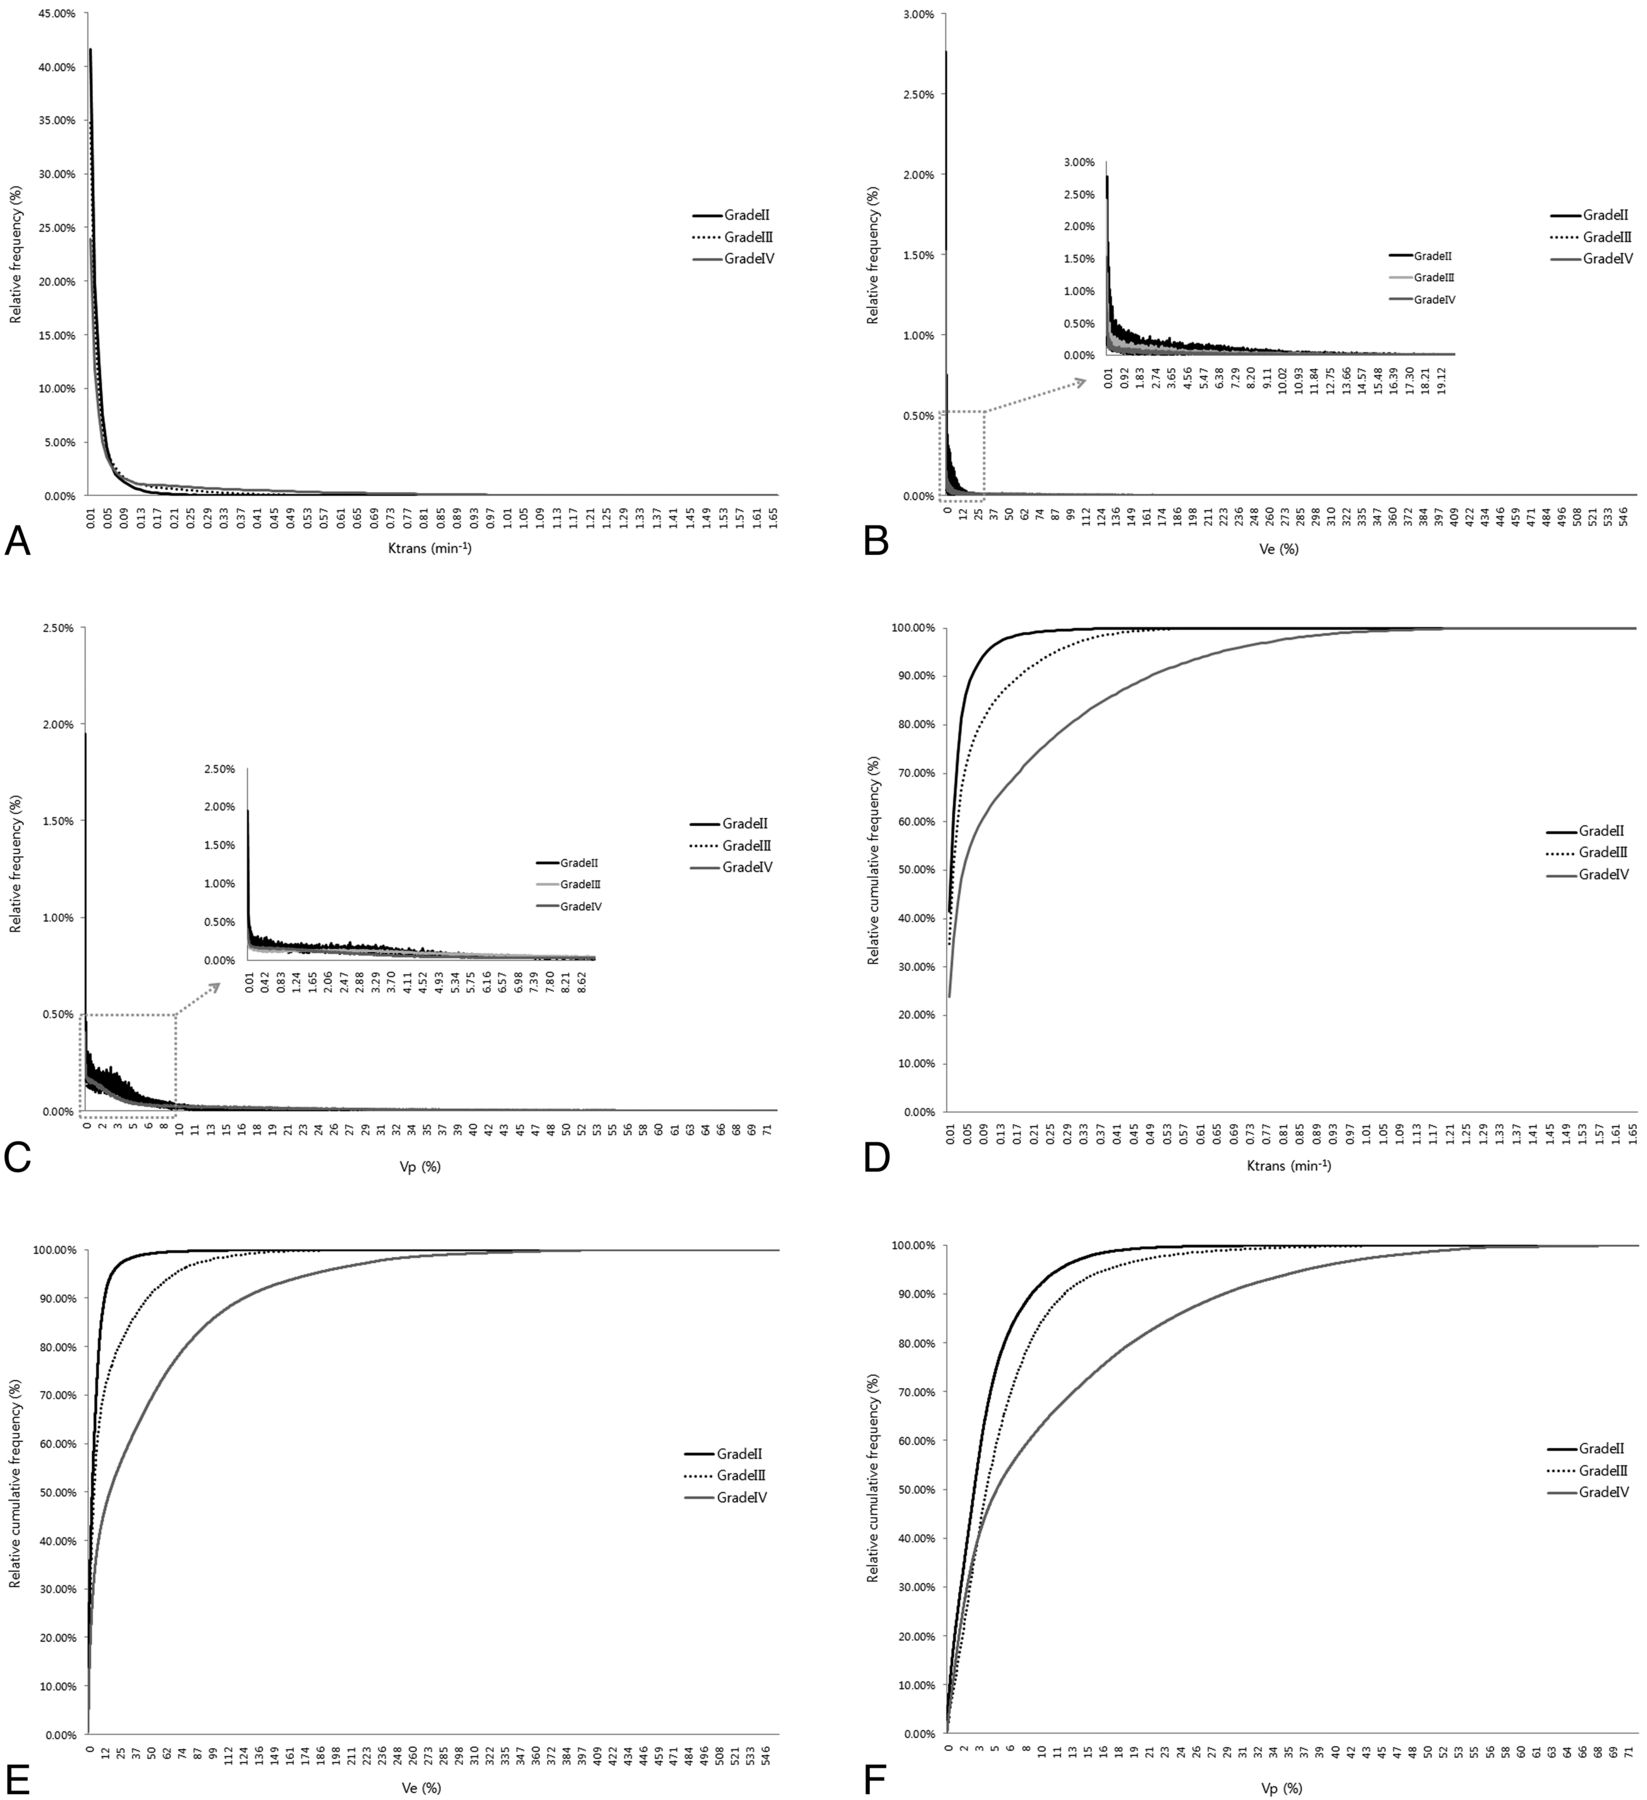
The histograms and cumulative histograms from the entire-tumor volume showed that low-grade gliomas presented a higher relative frequency at low parametric values and a lower relative frequency at high parametric values compared with high-grade gliomas in all parameters. These characteristics resulted in substantial divergence according to grades in the cumulative histogram (Fig 4).

A histogram and cumulative histogram were derived from the total parametric values of all masses (n = 28) according to each grade. A–F, The histogram and cumulative histogram show that lower grade gliomas present a higher relative frequency at low parametric values and a lower relative frequency at high parametric values compared with higher grade gliomas for all of the parameters. C and F, However, in the Vp histogram, the relative frequency of grade IV gliomas is higher than that of grade III gliomas at a number of low values.
Optimal Cutoff Values of Ktrans, Ve, and Vp for the Differentiation of High- and Low-Grade Gliomas
Between the C50 (median value) and C99 values from the cumulative Ktrans, Ve, and Vp histograms, the Ktrans of C98, Ve of C90, and Vp of C84 exhibited the highest AUCs—0.912, 0.939, and 0.769—for differentiating high- from low-grade gliomas.
We applied each cutoff value of Ktrans, Vp, and Ve for the differentiation of high- and low-grade gliomas, so that tumors with values greater than or equal to the cutoff values were regarded as high-grade gliomas. In terms of Ktrans, the cutoff value of C98 was 0.277 minute−1 and showed a sensitivity of 76.19% (16 of 21 high-grade gliomas) and a specificity of 100% (7 of 7 low-grade gliomas). The Ve cutoff value at C90 was 19.70% and had a sensitivity and a specificity of 85.7% (18 of 21 high-grade gliomas) and 100% (7 of 7 low-grade gliomas), respectively. We found that the Vp cutoff value at C84 was 11.71% and showed a sensitivity of 61.9% (13 of 21 high-grade gliomas) and a specificity of 100% (7 of 7 low-grade gliomas) (Table 2).
ROC results of the percentiles with the best AUC for glioma grading
Optimal Cutoff Values of Ktrans, Ve, and Vp for Differentiation of Grade II and III Gliomas
Between the C50 and C99 values from the cumulative Ktrans, Vp, and Ve histograms, only Ve showed a significant parameter (P < .05) for differentiating grade III from grade II gliomas and the Ve C90 exhibited the highest AUCs: 0.839. The Ve C90 cutoff value was 19.7% with a sensitivity of 62.5% (5 of 8 grade III gliomas) and a specificity of 100% (7 of 7 grade III gliomas). We applied each cutoff so that tumors with values equal to or greater than the cutoff values were regarded as grade III gliomas.
Optimal Cutoff Values of Ktrans, Ve, and Vp for the Differentiation of Grade III and IV Gliomas
Between the C50 and C99 values from the cumulative Ktrans, Vp, and Ve histograms, the Ktrans C97, Ve C66, and Vp C92 exhibited the highest AUCs for differentiating grade IV from grade III gliomas: 0.971, 0.885, and 0.798, respectively. The Ktrans C97 cutoff value was 0.412 minute−1 with a sensitivity of 92.31% (12 of 13 grade IV gliomas) and a specificity of 100% (8 of 8 grade III gliomas). The Ve C66 cutoff value was 8.37% with a sensitivity of 92.31% (12 of 13 grade IV gliomas) and a specificity of 75% (6 of 8 grade III gliomas). We found that the Vp C92 cutoff value was 19.33% and showed a sensitivity of 76.92% (10 of 13 grade IV gliomas) and a specificity of 87.50% (7 of 8 grade III gliomas). We applied each cutoff so that tumors with values equal to or greater than the cutoff values were regarded as grade IV gliomas.
Multivariable Stepwise Logistic Regression Analysis
The AUCs corresponding to profiles with the highest diagnostic accuracy showed significant differences between low- and high-grade gliomas (P < .05). However, multivariable stepwise logistic regression analysis showed that the Ktrans C98 value was the most significant variable, with a parameter estimate of 16.64 and a standard error of 8.17 (P < .05). Ktrans C97 was the most significant variable with a parameter estimate of 17.96 and a standard error of 8.38 in differentiating grade IV from grade III gliomas, but there was no significant variable in differentiating grade III from grade II gliomas (P < .05).
Discussion
Histogram analysis of pharmacokinetic parameters including Ktrans, Ve, and Vp obtained from the entire-tumor volume based on T1-weighted DCE perfusion MR imaging was useful for glioma grading. The best percentiles for differentiating high- and low-grade gliomas, in terms of the highest area under the curve of the receiver operating characteristic curves, were Ktrans C98, Ve C90, and Vp C84. Ktrans C98 was the most significant parameter for distinguishing high- from low-grade gliomas.
A number of studies on glioma grading by using pharmacokinetic parameters from DCE MR imaging—in particular, Ktrans, Ve, and Vp—have been published.8,10⇓⇓–13,15,18,28 Using ROC curve analyses, Jia et al8 showed that Ktrans and Ve were significantly lower in low-grade gliomas than in high-grade gliomas, with cutoff values of Ktrans and Ve of 0.035 minutes−1 and 0.13, respectively. Awasthi et al10 presented a discriminant function for differentiating low- and high-grade gliomas and a correlation with immunohistochemical markers by using relative CBV, elimination rate of contrast agent or Kep, and Ve derived from DCE MR imaging. Zhang et al29 concluded that Ktrans was the most sensitive and specific parameter among the 5 available parameters (Ktrans, Kep, rate constant of contrast agent reflux to plasma or Kel, Ve, and Vp) in distinguishing high-grade from low-grade gliomas on the basis of DCE MR imaging. These studies calculated parameters in portions of the entire-tumor volumes. The ROIs included smaller portions of the tumor margins on each section and were mostly used to show the highest parametric values.8,10,29 In comparison, we collected and analyzed whole-pixel values from the entire-tumor volume. In addition, we evaluated the parameters on the basis of T2WI or FLAIR, whereas previous studies used contrast- enhanced T1WI. T2-weighted high-signal-intensity lesions, excluding definite cystic or necrotic regions around gliomas, were generally considered to be tumor-involved lesions. We believe that the methods used in the present study could reflect whole-tumor characteristics.
The previous studies presented the parametric values with cutoff values to differentiate low- and high-grade gliomas. The presented values in the previous studies were not consistent with one another. The inconsistency in parametric values may be caused by different MR imaging protocols, pharmacokinetic models, or perfusion-analysis software. However, histogram analysis from the entire-tumor volume could be an alternative method for grading gliomas. The percentiles, which were generated from relative rankings based on the analyzed parametric values from the analysis, directly apply to other clinical or research settings.
Baseline T1 was fixed at 1000 ms in this study, whereas an estimate for the baseline T1 has been generally derived from a fitting process by using the precontrast T1 field-echo signal at multiple flip angles.20,30,31 The estimation of the baseline T1 is very sensitive to noise that is present in multiple flip angle and DCE images, and this sensitivity results in the broadening of the baseline T1. The fixed baseline T1 can contribute to obtaining more consistent results and can protect dynamic data from incorrect scale factors or patient movements during DCE data collection. In addition, the effort to estimate the actual baseline T1 could be reduced. If one assumed that the purpose of the DCE analysis is to determine the relative vascular change, the analysis by using the fixed baseline T1 may be sufficient to draw correct conclusions, even though the fixed baseline T1 is not physiologic.22 However, these characteristics may result in Ve values of >100% in our study.
Although there were a number of methodologic differences, the results from this study were in agreement with those in previous studies. The parametric values increased as the grades increased, and Ktrans was the most significant parameter in glioma grading.
This study had a number of limitations. A retrospective analysis was performed, and a small number of patients were enrolled. In particular, only 7 cases of low-grade glioma were included because of their low incidence. Second, although the determination of the arterial input function was performed in terms of the best optical shape and in relation to the concentration-time curve of the tumor, it might be insufficient for objective and reproducible selection. Third, the drawing of the regions of interest was performed manually on T2WI or FLAIR images. Because infiltrative tumors show particularly poor margins, differentiating the tumor from the surrounding normal brain tissue may not be easy, and this difficulty may result in low reproducibility. However, the volume of data from the entire-tumor volume was high enough that small erroneous data were not thought to cause severe bias. Fourth, we assumed that significant differences in parameters among the glioma grades would be identified in higher percentiles over the range C50 to C100. This assumption was based on the characteristic vascular system of gliomas (ie, higher grade gliomas have more permeability and abundant vascularity). Although the AUC curves also supported the validity of the assumption, the analysis was not completely free from limitations. Fifth, multicolinearity was detected in the multivariable stepwise logistic regression analysis because the variables were highly correlated with one another. The percentiles were extracted from one parameter, and the parameters were originally dependent on one another. Sixth, fixed-baseline T1 was used for the calculation of contrast concentration in tissue, even though it was not physiologic. Finally, the histogram analysis of the data from the entire-tumor volume could present entire profiles of glioma grades on the basis of the calculated parameters, but this may not be practical in terms of time effectiveness for application to real clinical settings.
Conclusions
Histogram analysis of the pharmacokinetic parameters Ktrans, Ve, and Vp obtained from the entire-tumor volume data can be useful for grading gliomas. Ktrans C98 was the most significant parameter. We expect our results to contribute to perfusion analyses in diverse clinical and research settings.
Footnotes
Disclosures: Seung Hong Choi—RELATED: Grant: This study was supported by a grant from the National R&D Program for Cancer Control, Ministry of Health and Welfare, Republic of Korea (1120300); the Korea Healthcare Technology R&D Projects, Ministry for Health, Welfare and Family Affairs (A112028 and HI13C0015); and the Research Center Program of the Institute for Basic Science in Korea.* *Money paid to the institution.
This study was supported by a grant from the National R&D Program for Cancer Control, Ministry of Health and Welfare, Republic of Korea (1120300); the Korea Healthcare Technology R&D Projects, Ministry for Health, Welfare and Family Affairs (A112028 and HI13C0015); and the Research Center Program of the Institute for Basic Science in Korea.
Indicates open access to non-subscribers at www.ajnr.org
References
- Received July 11, 2013.
- Accepted after revision October 21, 2013.
- © 2014 by American Journal of Neuroradiology


Jump to section
Related Articles
Cited By...
- Structural and practical identifiability of contrast transport models for DCE-MRI
- Comparison of Dynamic Contrast-Enhancement Parameters between Gadobutrol and Gadoterate Meglumine in Posttreatment Glioma: A Prospective Intraindividual Study
- Dynamic Contrast-Enhanced MR Imaging of Nonenhancing T2 High-Signal-Intensity Lesions in Baseline and Posttreatment Glioblastoma: Temporal Change and Prognostic Value
- Prognostic Predictions for Patients with Glioblastoma after Standard Treatment: Application of Contrast Leakage Information from DSC-MRI within Nonenhancing FLAIR High-Signal-Intensity Lesions
- Diagnostic Accuracy of T1-Weighted Dynamic Contrast-Enhanced-MRI and DWI-ADC for Differentiation of Glioblastoma and Primary CNS Lymphoma
- The Added Prognostic Value of Preoperative Dynamic Contrast-Enhanced MRI Histogram Analysis in Patients with Glioblastoma: Analysis of Overall and Progression-Free Survival
- T1-Weighted Dynamic Contrast-Enhanced MRI as a Noninvasive Biomarker of Epidermal Growth Factor Receptor vIII Status
- Comparison of the Diagnostic Accuracy of DSC- and Dynamic Contrast-Enhanced MRI in the Preoperative Grading of Astrocytomas
- Pixel-by-Pixel Comparison of Volume Transfer Constant and Estimates of Cerebral Blood Volume from Dynamic Contrast-Enhanced and Dynamic Susceptibility Contrast-Enhanced MR Imaging in High-Grade Gliomas
- Role of MRI in Primary Brain Tumor Evaluation