
Abstract
BACKGROUND AND PURPOSE: Differentiation of glioblastomas and solitary brain metastases is an important clinical problem because the treatment strategy can differ significantly. The purpose of this study was to investigate the potential added value of DTI metrics in differentiating glioblastomas from brain metastases.
MATERIALS AND METHODS: One hundred twenty-eight patients with glioblastomas and 93 with brain metastases were retrospectively identified. Fractional anisotropy and mean diffusivity values were measured from the enhancing and peritumoral regions of the tumor. Two experienced neuroradiologists independently rated all cases by using conventional MR imaging and DTI. The diagnostic performances of the 2 raters and a DTI-based model were assessed individually and combined.
RESULTS: The fractional anisotropy values from the enhancing region of glioblastomas were significantly higher than those of brain metastases (P < .01). There was no difference in mean diffusivity between the 2 tumor types. A classification model based on fractional anisotropy and mean diffusivity from the enhancing regions differentiated glioblastomas from brain metastases with an area under the receiver operating characteristic curve of 0.86, close to those obtained by 2 neuroradiologists using routine clinical images and DTI parameter maps (area under the curve = 0.90 and 0.85). The areas under the curve of the 2 radiologists were further improved to 0.96 and 0.93 by the addition of the DTI classification model.
CONCLUSIONS: Classification models based on fractional anisotropy and mean diffusivity from the enhancing regions of the tumor can improve diagnostic performance in differentiating glioblastomas from brain metastases.
ABBREVIATIONS:
- AUC
- area under the curve
- ER
- enhancing region
- FA
- fractional anisotropy
- IPR
- immediate peritumoral region
- LRM
- logistic regression model
- MD
- mean diffusivity
Differentiation of glioblastomas and solitary brain metastases is an important clinical problem because the treatment strategy can significantly differ depending on the tumor type.1,2 In some cases, clinical history and/or multiplicity of enhancing brain lesions makes the diagnosis of brain metastases relatively straightforward. However, a solitary brain metastasis on MR imaging can have a nonspecific appearance. Similarly confounding the issue is the fact that glioblastomas can also occasionally present as multiple enhancing lesions. Moreover, although a glioblastoma typically presents as a solitary mass, a solitary brain metastasis may be the first manifestation of disease in approximately 30% of patients with systemic cancer.3 Hence, accurate distinction between glioblastomas and brain metastases can be challenging, often necessitating an invasive surgical biopsy for a definitive diagnosis.
DTI has been used to differentiate glioblastomas from brain metastases, but with conflicting results. Some reports have suggested that mean diffusivity (MD)4⇓–6 is helpful for the differentiation, while others indicated the limited use of MD in the differentiation of neoplasms.7⇓–9 Wang et al10 and Reiche et al11 reported lower fractional anisotropy (FA) from the enhancing regions (ERs) of glioblastomas compared with brain metastases. In contrast, another study reported that glioblastomas have higher FA in the enhancing regions than metastases.12 The potential reasons for these conflicting results may include differences in analysis methods, particularly in defining the region of interest, as well as the relatively small size of cohorts used in individual studies (n = 24–66).4,5,7,10,13 Hence, a primary objective of this study was to investigate the DTI characteristics of glioblastomas and brain metastases in a substantially larger cohort of patients, in order to determine whether they may have diagnostic utility.
Restricted water diffusion in solid tumors has been reported by many groups.7,14⇓⇓–17 It is generally assumed that a solid tumor does not have any microstructural orientation by itself and its growth induces structural disorder in the tissue, which leads to decreased FA.18 However, although the association between FA and tumor cellularity has been studied, the relationship remains unclear because both positive12,14,19 and negative16 correlations have been reported. Our previous study12 showing higher FA in glioblastomas than in brain metastases also found a negative linear trend between FA and MD in glioblastomas, which was not seen in metastases, perhaps indicating a tumor-dependent relationship between these 2 parameters. While promising results with DTI have been published in the diagnosis of brain tumors, to date, its clinical value in improving the diagnostic accuracy of radiologists has not been evaluated.
Hence, the objectives of the present study were to investigate the potential of DTI in differentiation of glioblastomas from solitary brain metastases in a relatively large cohort of 221 patients and to compare its diagnostic accuracy in comparison with that of 2 experienced neuroradiologists.
Materials and Methods
Patients
Patients with solitary enhancing lesions (n = 221), based on contrast-enhanced T1-weighted images, were retrospectively recruited from our institutional data base between June 2006 and February 2012. Patients with nonenhancing or multiple enhancing tumors or a clinical history of any prior therapy to the brain were not included. The study was approved by the institutional review board and was compliant with the Health Insurance Portability and Accountability Act.
Histopathologic diagnosis of the tumor was available for all patients through surgical resection or biopsy. The final diagnoses included 128 glioblastomas (78 men, 50 women; age, 60.5 ± 12.3 years; range, 24–90 years) and 93 brain metastases (46 men, 47 women; age, 58.8 ± 11.6 years; range, 44–88 years). Of the 93 metastases, the primary sites for cancer included lung (n = 56), breast (n = 16), skin (n = 8), colon (n = 3), renal (n = 2), neck (n = 1), arm (n = 1), parotid (n = 1), esophagus (n = 2), thyroid (n = 1), peritoneum (n = 1), and endometrium (n = 1).
Data Acquisition
MR imaging studies were performed on a Tim Trio 3T whole-body scanner (Siemens, Erlangen, Germany) by using a 12-channel phased-array head coil. Routine MR imaging pulse sequences included axial T1-weighted 3D MPRAGE (TR/TE/TI = 1760/3.1/950 ms, matrix size = 192 × 256, section thickness = 1 mm) and axial FLAIR (TR/TE/TI = 9420/141/2500 ms, section thickness = 3 mm). DTI data were acquired by using a single-shot spin-echo EPI sequence with parallel imaging by using generalized autocalibrating partially parallel acquisition and an acceleration factor of 2. The DTI data from 55 patients (40 glioblastomas, 15 metastases) were acquired by using 12 diffusion-weighting directions (TR/TE = 4900/83 ms, NEX = 6); and in the remaining 166 patients, DTI data were acquired with 30 directions (TR/TE = 5000/86 ms, NEX = 3). Other sequence parameters were as follows: FOV = 22 × 22 cm2, b=0, 1000 s/mm2, section thickness = 3 mm, total scanning time = 8 minutes. All our 12- and 30-direction DTI data were acquired by using the same imaging parameters with the same scanning times at the same scanner. On the basis of previous studies,20⇓–22 we assume that there is no significant difference in mean or median MD and FA values from the 12- and 30-direction DTI datasets, particularly when FA is mostly <0.3 as in the solid tumors included in this study21 and we combined the data from all the patients in this study.
Image Processing
The diffusion-weighted images were coregistered to the non-diffusion-weighted (b=0) images by using the methods described in another work.12 The corrected raw images were combined to estimate rotationally invariant DTI parameter maps, including FA and MD, by using in-house software.12,23,24
The DTI parameter maps and FLAIR images were then coregistered to contrast-enhanced T1-weighted images. A semiautomatic segmentation approach was used to subdivide each lesion into 3 regions: enhancing region, immediate peritumoral region (IPR), and distant peritumoral region by using contrast-enhanced T1 and FLAIR images.12 ER was the region with enhancement higher than the mean +3 SDs of the signal intensity from the WM. IPR was chosen as a 4-mm-wide band around the enhancing region. The remaining region of FLAIR abnormality, outside of the IPR, was the distant peritumoral region.12,23,25 The median FA and MD values were measured from the 3 regions. Data analysis tools, including image coregistration and segmentation, were implemented by using IDL (Exelis Visual Information Solutions, Boulder, Colorado).
Data Analysis
A Mann-Whitney U test was used for the difference in the median MD and FA values between glioblastomas and brain metastases from the 3 regions. A P value < .05 was considered significant. Linear regression analysis was used to investigate the association between 2 continuous measures, FA and MD. A multivariate logistic regression analysis was used to determine the best classification model of DTI parameters, namely the logistic regression model (LRM). Bootstrapping validation was applied to estimate the accuracy of the LRM. Specifically, 70% of the full dataset was randomly selected with replacement and was used as an independent validation set; this process was repeated 500 times.26 Means and SDs of the area under the receiver operating characteristic curves (AUCs) were computed. The cutoff lines for separating glioblastomas from metastases were determined by maximizing the sum of specificity and sensitivity (ie, Youden index).
Two neuroradiologists with 10 and 9 years of experience independently reviewed the cases on the basis of contrast-enhanced T1, FLAIR, DWI, FA, and MD maps. The radiologists were asked to rate their level of confidence for each case, whether the tumor was metastasis or glioblastoma. A rating was classified into 5 scales based on the following 5 confidence levels: level 1, 90% metastasis; level 2, 70% metastasis; level 3, 50%; level 4, 70% glioblastoma; and level 5, 90% glioblastoma. The diagnostic performances of the 2 raters and LRM were evaluated by using the receiver operating characteristic analysis curves. The AUCs were compared by using the method of DeLong et al.27 The weighted κ was used to assess the interobserver agreement between the 2 raters and LRM. All data analysis was conducted by using the Statistical Package for the Social Sciences for Windows, Version 15.0 (IBM, Armonk, New York). R software (Version 2.15.0; http://www.r-project.org) was used for the bootstrapping validation.
Results
Comparison of Imaging Parameters
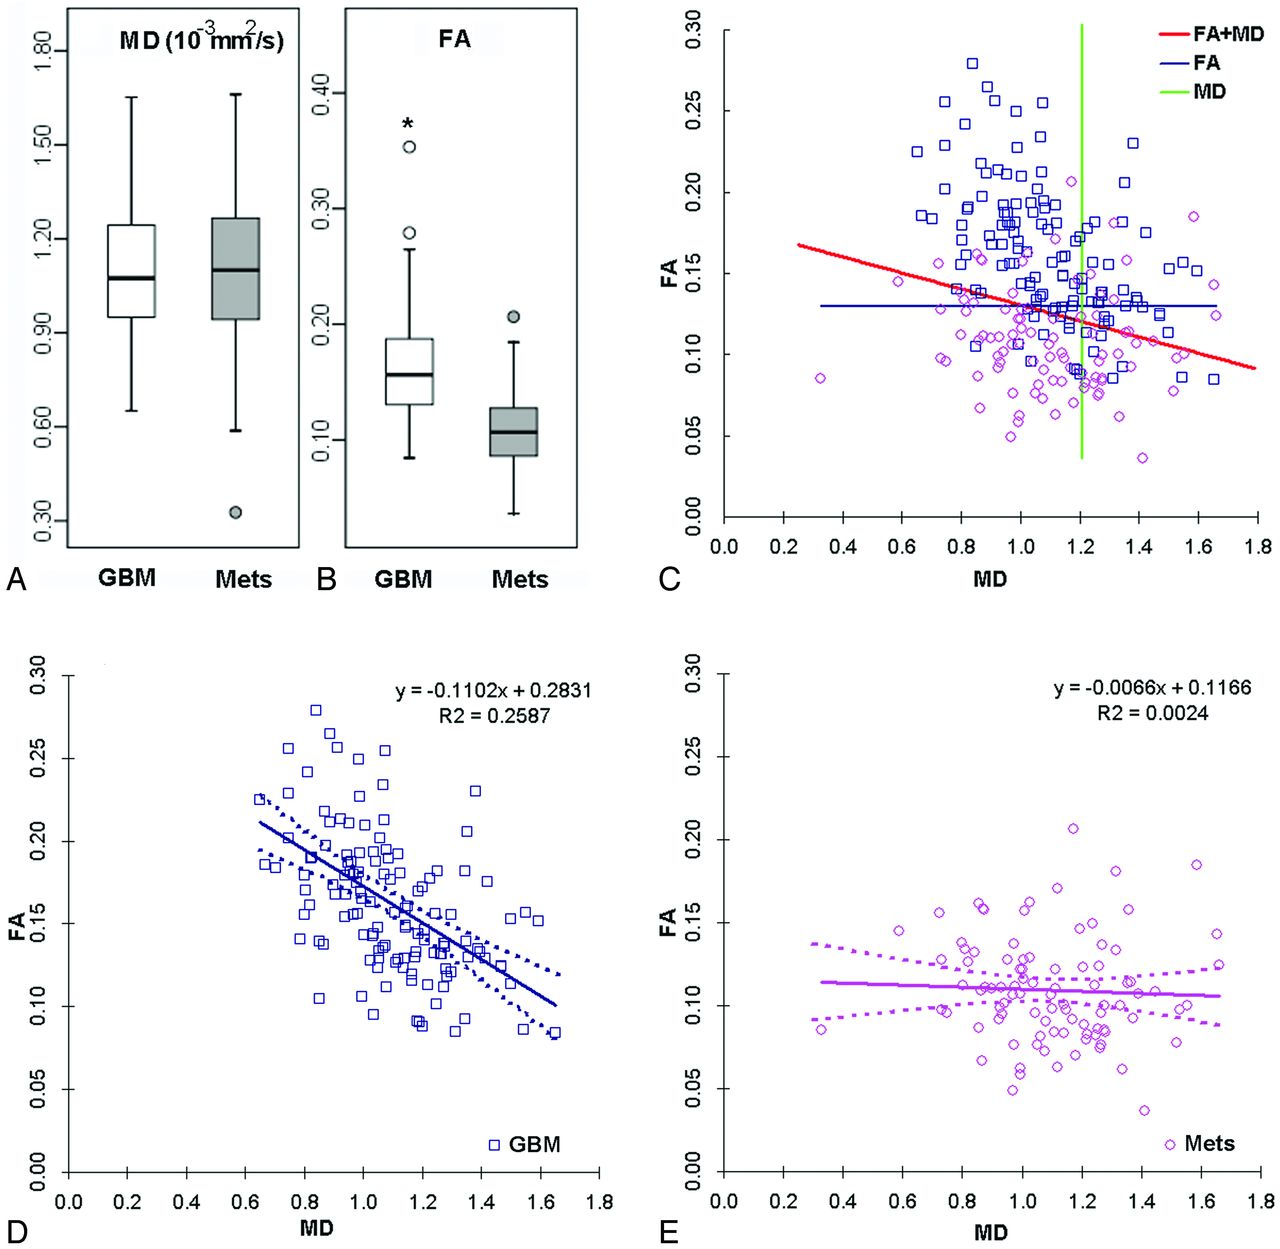
Representative MR images of patients with glioblastoma and metastasis are shown in Fig 1. The MD maps in both cases showed similar levels of restricted diffusion in the enhancing parts. In contrast, the FA maps showed that the glioblastoma had higher FA than the brain metastasis. The high FA rim extended to the immediate peritumoral regions in glioblastomas. Similar observation was made with most cases as summarized by the boxplots shown in Fig 2A, -B. The median FA value of glioblastomas from the ER and IPR was significantly higher than that of brain metastases (P < .01). There was no significant difference in the median values of MD from all the regions. None of the parameters showed significant differences from the distant peritumoral regions.

Comparison of imaging features between glioblastomas (A–C) and brain metastases (D–F). Both show ring enhancement and extensive edema on axial contrast-enhanced T1-weighted images (A and D) and restricted diffusion of the enhancing part on MD maps (B and E). However, for the FA map, the glioblastoma case demonstrates high FA values from the enhancing region. The high FA starts from the enhancing region and extends to the immediate peritumoral region, making an FA rim.

Boxplot of FA and MD from the enhancing region in glioblastomas (white) and brain metastases (gray) (A and B). The outliers are represented by circles. Asterisks indicate significant differences (P < .01). A scatterplot of FA and MD from the enhancing region of glioblastomas (blue square) and brain metastases (purple circle) (C) is shown. The green line represents the cutoff line of MD; the blue line, the cutoff line of FA; and the red line, the cutoff line of the combined model of FA and MD, which can successfully separate the glioblastomas and brain metastases. FA and MD regression lines for glioblastomas (D), FA and MD regression lines for brain metastases (E), and the dotted line indicate 95% confidence intervals. There is a negative correlation of FA and MD in glioblastomas (R = 0.51, P < .05).
Diffusion Tensor Logistic Regression Model
FA from the ER and IPR and MD from the ER were evaluated for their diagnostic performance by using receiver operating characteristic analysis (Table). The single best predictor for the discrimination is FA from the ER with a sensitivity of 0.80, a specificity of 0.76, and an AUC of 0.84. The logistic regression analysis indicated that the best model included FA and MD from the ER as follows:
 where β0 = −7.79, β1 = 2.14, and β2 = 43.30. This model was validated by using the bootstrapping procedure described above (repeated 500 times) with a mean AUC of 0.86 and SD of 0.03.
Diagnostic performance of 2 raters and the logistic regression model of DTI parameters for all the cases
The scatterplots of FA and MD from the ER in Fig 2C demonstrate how LRM can have a higher AUC than FA alone, though MD itself is a poor predictor (AUC = 0.50). The cutoff line of LRM shown in Fig 2C was slanted and positioned between the linear regression lines for glioblastomas and brain metastases, shown separately in Fig 2D, -E, respectively. The linear negative regression between FA and MD in the glioblastoma group was significant (R2 = 0.26, P < .05).
Comparison between Diffusion Tensor and Raters
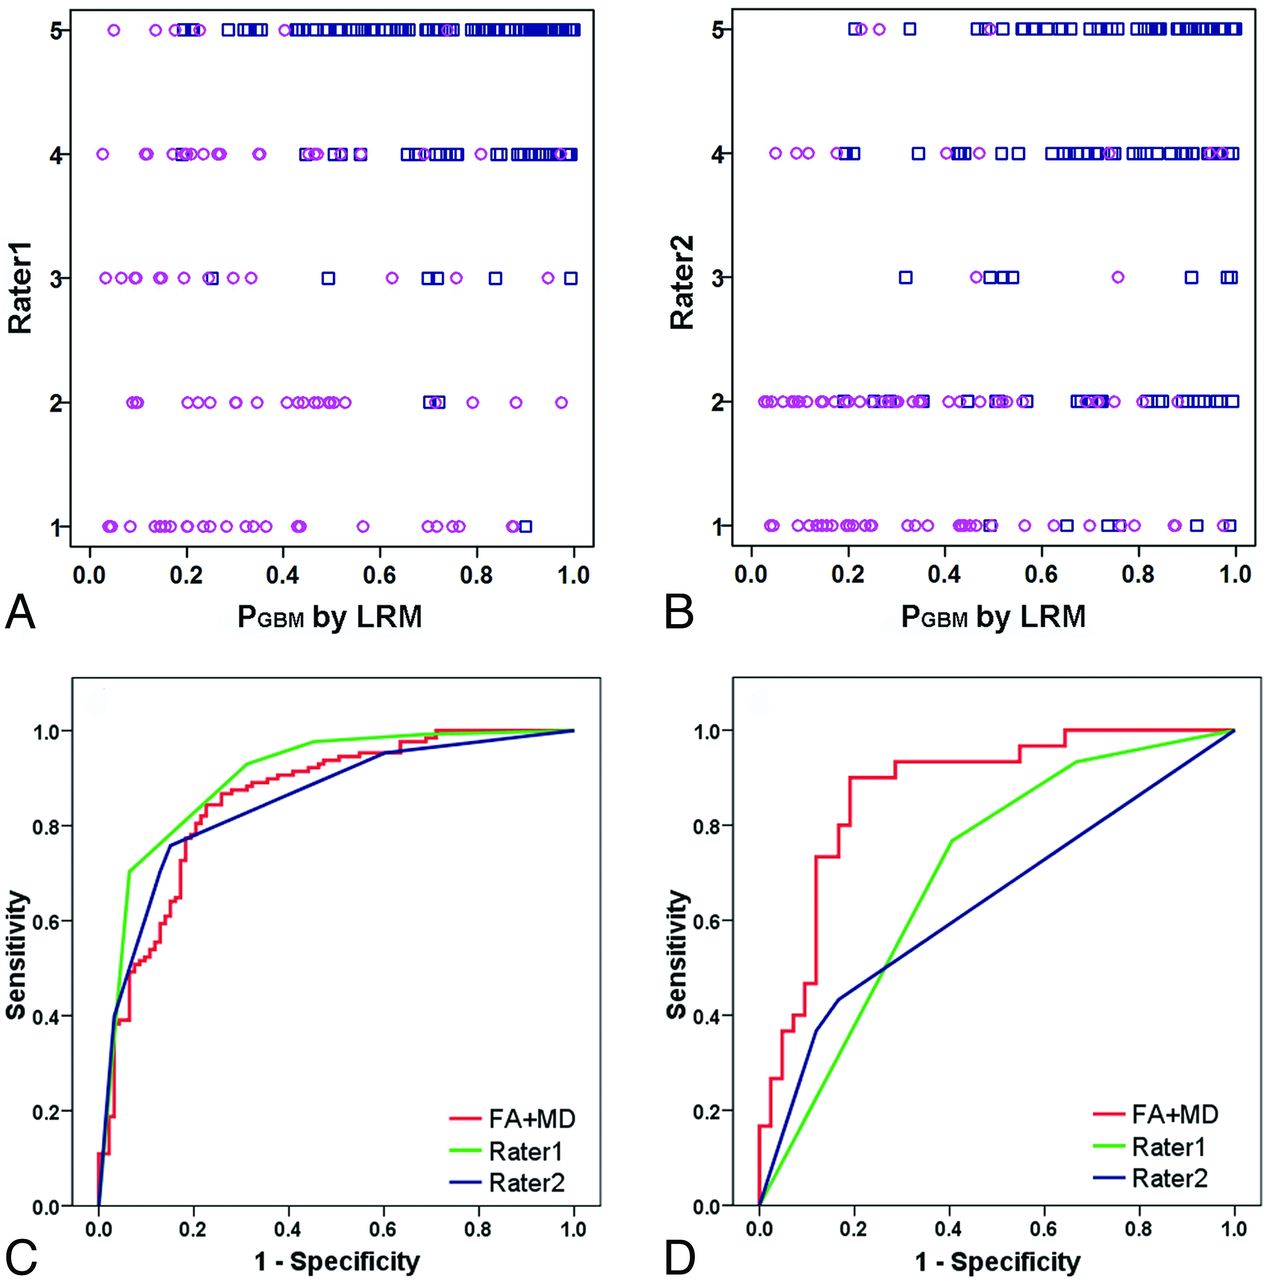
The results of diagnostic reading by 2 expert neuroradiologists by using the 5-point rating scale and LRM output are presented as scatterplots in Fig 3A, -B. If one assumes that the LRM output is equivalent to the reader confidence level, confidence level 1 of the raters (90% metastasis) corresponds to 0–0.2 of the LRM output; confidence level 2, to 0.2–0.4 of the LRM output; and so forth. The weighted κ values between the 2 raters, rater 1 and LRM, and rater 2 and LRM, were 0.63, 0.40. 0.43, respectively, indicating moderate agreement. The receiver operating characteristic analysis curves in Fig 3C demonstrate that the diagnostic performances of the 2 raters and LRM are similar; the AUC values were 0.90, 0.85, and 0.86, for rater 1, rater 2, and LRM, respectively. There was a significant difference between the AUCs of rater 1 and rater 2 (P = .03).

Scatterplot of 2 raters and the logistic regression model for glioblastomas (blue square) and brain metastases (purple circles) (A and B). Approximately half of cases were with low confidence levels (levels 2–4 for the raters and 0.2–0.8 for the LRM). PGBM represents the probability, predicted by the model, for glioblastoma (GBM). Receiver operative characteristic curve analysis from 2 raters and the LRM for the whole cases (C) and challenging cases for the raters with confidence level of 2–4 (D) are shown. The performance of the LRM is close to that of both raters. For challenging cases, the performance of the LRM remains at about the same level as those for all cases.
Figure 3A, -B indicates that approximately half of the cases had low confidence levels (levels 2–4 for the raters and 0.2–0.8 for the LRM): 43% for rater 1, 56% for rater 2, and 50% for the LRM. Fig 3D shows the receiver operating characteristic analysis curves only for the cases with confidence levels between 2 and 4 by both raters (n = 72). The AUC of the LRM (0.87) for these challenging cases was higher than those of rater 1 (0.70) and rater 2 (0.64), suggesting that the LRM can be helpful in improving the classification of the cases with low rater confidence levels.
DTI and Rater Combined Classifier
Figure 4 illustrates the improvement in the diagnostic accuracy of each rater by combining with the LRM. A logistic regression model was generated by using LRM output and rater 1:
 where β0 = −9.54, β1 = 1.70, and β2 = 6.25. The scatterplot in Fig 4A demonstrates that most of the glioblastomas are above the diagonal line and most of the brain metastases are below the diagonal line. LRM plus rater 1 had an AUC of 0.96 compared with 0.9 by rater 1 alone. We tested the model by using rater 2. Figure 4B, -D shows that the combined model with LRM plus rater 1 can also improve the results of rater 2. The AUC was 0.93, compared with 0.85 by rater 2 alone. The combined model significantly improved the AUC of both rater 1 (P < .001) and rater 2 (P < .001). This model can be applied to all raters.

The diagnostic performance of rater 1 improves by combining the DTI logistic regression model (A and C). Most of the glioblastomas (blue squares) are above the diagonal line, and most of the brain metastases (purple circles) are below the diagonal line. PGBM represents the probability, predicted by the model, for glioblastoma (GBM). AUC improves from 0.90 to 0.960 for rater 1. The combined model with LRM plus rater 1 can also improve the results of rater 2 (B and D). AUC improves from 0.85 to 0.93 for rater 2.
A summary of diagnostic performance of individual readers and combined schemes of DTI parameters, including sensitivity, specificity, positive predictive value, negative predictive value, and AUC, is shown in the Table.
Discussion
In this study, the diagnostic performance of DTI based on FA and MD was compared with those of 2 experienced neuroradiologists. Our results demonstrated that the diagnostic accuracy of the classifier was as good as those of experienced neuroradiologists and that LRM could be used to further improve the diagnostic performance of the readers. Our previous studies in a smaller sample population (n = 63) have shown that FA and MD from the enhancing part are very useful for differentiating glioblastomas from brain metastases.12,23 Results from the present study with a substantially larger sample size (n = 221) confirmed that FA and MD from the enhancing part can be used to generate a robust model for the classification between glioblastomas and brain metastases.
Our study demonstrated that FA from the enhancing regions of glioblastomas was significantly higher than that of brain metastases. Toh et al28,29 reported similar findings and interpreted them as the influence of gliosis surrounding the glioblastomas. We speculate that the high FA in glioblastomas may be due to the orientation of overproduced extracellular matrix.30,31 The extracellular space and matrix play an important role in tumor growth and infiltration. Glioblastoma cells produce large amounts of tumor-specific extracellular matrix components, which serve as a substrate for adhesion and subsequent migration of the cells through the enlarged extracellular space.30 These molecules accumulate and are oriented in extracellular matrix,32 resulting in high anisotropy. Our previous study in meningiomas demonstrated high FA and planar anisotropy coefficient in fibroblastic meningiomas compared with other subtypes.26 These findings can be explained by the presence of a large amount of collagen in fibroblastic subtypes.25,33 It has been reported that the structure and orientation of extracellular matrix affect the anisotropy, but not the mean diffusivity34; these results are consistent with ours. On the other hand, in brain metastases, neoplasm cells grow into the brain parenchyma in an expansive, noninfiltrating pattern. In contrast to glioblastoma, degradation of the extracellular matrix begins the process of metastasis.35,36
We did not observe a significant difference in MD values from the enhancing region between glioblastomas and metastases, indicating a limited sensitivity and specificity of this parameter in tumor differentiation. However, MD was still an important parameter for LRM because FA in glioblastomas varied depending on MD, but did not in metastases. If one assumes that MD reflects cellularity, our findings from in vivo data substantiate previous reports on the positive correlation between FA and tumor cellularity.12,14,19 Furthermore, our study shows, for the first time, that such association between FA and MD is found only in glioblastomas, but not in brain metastases. The underlying mechanism for such discrepancy between these 2 types of tumors is not fully understood, but it may help in improving the diagnostic accuracy as demonstrated in this study.
In this study, the AUC values are similar between the raters (0.90 and 0.85) and LRM (0.86). This result indicates that the 2 raters and LRM had differences in their confidence levels for individual cases, but overall the performance of LRM was close to that of both raters. Furthermore, with the use of the DTI classification model, the diagnostic performance of each radiologist improved noticeably, with high sensitivity, specificity, positive predictive values, and negative predictive values. The AUC increased from 0.90 to 0.96 for rater 1 and from 0.85 to 0.93 for rater 2. The model is easy to use in clinical practice. Specifically, the readers first interpreted the case on the basis of the 5-scale confidence levels. Then they put the FA and MD values from the enhancing part into equation 1 and calculated the probability. Finally they used equation 2 to get the final interpretation. Alternatively, on the basis of the promising results of the current study, the LRM output can be provided to the radiologists as complementary information to consider when reading the case. A future study is warranted to test whether the availability of the LRM output can improve the diagnostic performance of radiologists with different levels of experience. We also evaluated challenging cases for the readers with lower confidence levels. The AUC remained at about the same level as that in all the cases. This finding was in accordance with several previous studies5,12,17 and indicates that the model is very helpful for readers, even for experienced radiologists.
A potential limitation of our study is its retrospective design. To further validate our results, a prospective study with similar or larger cohort size is warranted. Water diffusivity is affected by many factors including cellularity, extracellular volume, viscosity, and membrane permeability. The mean diffusivity and directionality changes measured by DTI are the sum of all the microstructural changes. Hence, a thorough pathologic investigation would be necessary to elucidate the underlying tissue structure responsible for higher FA in glioblastomas and the association with MD. In this retrospective study, image-guided biopsy was not available. Future study with pathologic validation is required. Furthermore, we may further improve the DTI-based model by using histogram analysis of FA and MD values in voxels. Future study is warranted to fully use the vast voxelwise information collected through DTI for better diagnosis.
Conclusions
The classification model based on FA and MD from the enhancing region is a robust one for differentiating glioblastomas from brain metastases. The model performed as well as experienced neuroradiologists. The diagnostic performance of radiologists in differentiating glioblastomas from brain metastases can be improved by adding a DTI classification model.
Footnotes
Disclosures: Harish Poptani—UNRELATED: Consultancy: American College of Radiology Image Metrix, Grants/Grants Pending: National Institutes of Health.* Donald M. O'Rourke—UNRELATED: Expert Testimony: neurosurgery medicolegal expert review, Grants/Grants Pending: Celldex Therapeutics,* Philanthropy,* Patents (planned, pending or issued): US Patents, University of Pennsylvania.* Ronald L. Wolf—UNRELATED: Other: ACRIN “tie-breaker” reads for glioblastoma study, Comments: unrelated to publication. *Money paid to the institution.
Paper previously presented in part at: Annual Meetings of the International Society for Magnetic Resonance in Medicine, May 5–11, 2012; Melbourne, Victoria, Australia; and April 20–26, 2013; Salt Lake City, Utah.
REFERENCES
- Received July 8, 2013.
- Accepted after revision September 13, 2013.
- © 2014 by American Journal of Neuroradiology


Jump to section
Related Articles
Cited By...
- Mesoscopic Assessment of Microstructure in Glioblastomas and Metastases by Merging Advanced Diffusion Imaging with Immunohistopathology
- Diffusion-Weighted Imaging and Diffusion Tensor Imaging for Differentiating High-Grade Glioma from Solitary Brain Metastasis: A Systematic Review and Meta-Analysis
- Differentiating Tumor Progression from Pseudoprogression in Patients with Glioblastomas Using Diffusion Tensor Imaging and Dynamic Susceptibility Contrast MRI