
Abstract
BACKGROUND AND PURPOSE: SWI is a powerful tool for imaging of the cerebral venous system. The SWI venous contrast is affected by blood flow, which may be altered in sickle cell disease. In this study, we characterized SWI venous contrast in patients with sickle cell disease and healthy control participants and examined the relationships among SWI venous contrast, and hematologic variables in the group with sickle cell disease.
MATERIALS AND METHODS: A retrospective review of MR imaging and hematologic variables from 21 patients with sickle cell disease and age- and sex-matched healthy control participants was performed. A Frangi vesselness filter was used to quantify the attenuation of visible veins from the SWI. The normalized visible venous volume was calculated for quantitative analysis of venous vessel conspicuity.
RESULTS: The normalized visible venous volume was significantly lower in the group with sickle cell disease vs the control group (P < .001). Normalized visible venous volume was not associated with hemoglobin, percent hemoglobin F, percent hemoglobin S, absolute reticulocyte count, or white blood cell count. A hypointense arterial signal on SWI was observed in 18 of the 21 patients with sickle cell disease and none of the 21 healthy control participants.
CONCLUSIONS: This study demonstrates the variable and significantly lower normalized visible venous volume in patients with sickle cell disease compared with healthy control participants. Decreased venous contrast in sickle cell disease may reflect abnormal cerebral blood flow, volume, velocity, or oxygenation. Quantitative analysis of SWI contrast may be useful for investigation of cerebrovascular pathology in patients with sickle cell disease, and as a tool to monitor therapies. However, future studies are needed to elucidate physiologic mechanisms of decreased venous conspicuity in sickle cell disease.
ABBREVIATIONS:
- BOLD
- blood oxygen level–dependent
- mIP
- minimum intensity projection
- NVVV
- normalized visible venous volume
- SCD
- sickle cell disease
Stroke is one of the most devastating complications in children with sickle cell disease (SCD).1 The cause of stroke in SCD has both occlusive and hemodynamic contributions.2,3 The pathophysiology of vaso-occlusion is related to the poor deformability of sickled red blood cells and the increased endothelial interactions of erythrocytes and inflammatory cells, which can induce vascular injury.4 Hemodynamic contributions arise from a hemolytic anemia, creating a hyperemic state to satisfy cerebral oxygen demands.2,3,5 Transcranial Doppler sonography is routinely used to screen for the risk for stroke, as the increase in cerebral blood flow in the hyperemic state is known to increase the risk for stroke.3,6⇓⇓–9 MR imaging and MRA are also routinely used to assess parenchymal injury and the vascular integrity of the cerebrovascular system to assess the risk for stroke in patients with SCD.10
In addition to MRA, SWI has evolved into an important technique for imaging of the cerebrovascular system.11 SWI enhances the venous contrast in the brain by taking advantage of the difference in magnetic susceptibility between deoxyhemoglobin and oxyhemoglobin. Because SWI is a blood oxygen level–dependent (BOLD) sensitive technique, the image can be affected by CBF changes, as reported in studies that have used carbogen or caffeine challenges or anesthesia.12⇓–14 Hyperemia is a well-described condition in SCD.5,9,15,16 SWI has not been systematically investigated in SCD and may be a useful tool to study venous flow in conditions in which CBF is increased.
In this study, we quantitatively compared the venous contrast in patients with SCD with that of age- and sex-matched healthy control participants. The visible venous volume calculated in each SWI examination was correlated with hematologic variables to determine whether this quantitative SWI measurement could be used as a biomarker of disease severity.
Materials and Methods
Patient Demographics and MR Imaging
This retrospective study was approved by our hospital institutional review board. We analyzed diagnostic SWI scans from patients with SCD treated at our institution between March 2010 and December 2010. Patients who were sedated,14 received supplemental oxygen for the MR examination, had a history of stroke, Moyamoya vasculopathy, encephalomalacia, or who had severe stenosis (> 75%) or occlusion of major intracranial vessels of the circle of Willis by MRA were excluded from analysis. Of the 29 eligible patients, 7 were excluded because of severe motion artifacts on SWI, and 1 patient was excluded for the hemoglobin SC genotype, yielding a final cohort of 21 patients with genotype hemoglobin SS (12 female, mean age, 12.9 ± 3.7 years; 9 male, mean age, 12.3 ± 3.9 years). Patients were also categorized by treatment: hydroxyurea, long-term transfusion therapy, or no therapy. Hemoglobin, percent hemoglobin F, percent hemoglobin S, absolute reticulocyte count, and white blood cell count (Table 1) obtained within 30 days of the MR examination were used as covariates for SWI analysis in the SCD group. SWI examinations were also analyzed from 21 sex- and age-matched healthy control participants (12 females, mean age, 12.7 ± 4.1 years; 9 males, mean age, 12.3 ± 3.5 years). The healthy control participants were enrolled from the community in an institutional review board–approved clinical trial examining neural substrates of reading (National Institutes of Health R01HD049888). Hematologic parameters were not available for the control group.
Correlation of NVVV with hematologic parameters
In the SCD group, 12 examinations were performed at 1.5T (Avanto and Symphony; Siemens, Erlangen, Germany) and 9 examinations at 3T (Trio; Siemens). All control examinations were performed at 3T. The SWI acquisition involved a 3D T2*-weighted gradient-echo sequence with the following parameters: TE, 25 ms; TR, 56 ms at 3T and TE, 40 ms; TR, 60 ms at 1.5T; flip angle, 20°; section thickness, 2 mm; matrix size, 384 × 257 × 72; FOV, 210 × 210 mm2; and a parallel imaging acceleration factor of 2. Sliding minimum intensity projections (mIP, 16-mm thick) were used in the image analysis.
Because SWI was performed at 1.5T and 3T in the SCD group, another set of healthy adult volunteers underwent scanning at 1.5T and 3T by use of the respective SWI parameters to evaluate any potential differences in the SWI signal as a function of field strength. Twelve healthy volunteers (3 females, mean age, 53.0 ± 5.2 years; 9 males, mean age, 38.1 ± 14.9 years) were recruited and underwent scanning consecutively at 1.5T and 3T after informed written consent was obtained.
Image Analysis
The apparent venous contrast was quantified by segmentation of the venous structures by a Frangi vesselness filter17 in Matlab (MathWorks, Natick, Massachusetts). The mathematic basis of the Frangi vesselness filter pertaining to vessel segmentation has been shown previously,17⇓–19 including the evaluation of SWI contrast in multiple sclerosis.20 In general, the line intensity profile of the hypointense vein seen in SWI can be described as a Gaussian function with a uniform intensity along the vessel. The second partial derivative of the image provided by the Hessian matrix describes the local curvature along the vessel and its cross-section. The degree of curvature is described in the eigenvalues of the Hessian matrix. The Frangi vesselness filter analyzes the relationship of the eigenvalues to remove “blob” or circlelike features and determines the likelihood of tubelike structures.
Vein maps were created by first removing the skull from the mIP images with the Brain Extraction Tool (FMRIB Software Library; www.fmrib.ox.ac.uk/fsl).21 To provide a similar signal intensity range for all images, the mIP images were normalized to 98% of the maximum signal intensity before applying the 2D Frangi vesselness filter. The 2 filter parameters (β and c), used to suppress bloblike structures and background noise, were set to β = 0.5 and c = 20, as suggested in previous studies.17,22 The spatial scale of the filter was equal to the in-plane spatial resolution of the mIP (0.55 mm). The filter result is a probability estimate of the venous vesselness. Vein maps were created by accepting a probability estimate of > 60%. The volume identified as veins above the level of the M1 segment of the MCA was divided by the total intracranial volume above the M1 segment to create a quantitative normalized visible venous volume (NVVV). NVVV is a dimensionless ratio. Only the sections above the M1 segment were used to avoid possible misidentification of these structures as veins due to inflow effects that are sometimes seen in gradient recalled-echo acquisitions. This also avoided susceptibility artifacts at the level of the paranasal sinuses.
All SCD and healthy control examinations were qualitatively graded for hypointense arterial contribution above the M1 segments on the mIP. An examination with no hypointense arterial vessels on the mIP SWI in the Sylvian fissure received a grade of zero. Examinations with a few arterial vessels in the anterior Sylvian fissure received a grade of I. If the arterial vessels extended through the Sylvian fissure to the posterior temporal lobe, the examination received a grade of II. An examination received a grade of III if multiple tertiary arterial branches were present in the Sylvian fissure.
Finally, to evaluate potential differences in the apparent venous contrast due to field strength and respective SWI parameters, calculated NVVVs at 1.5T and 3T were compared in the same volunteer. The NVVV was calculated following the same procedure as described above. However, to ensure similar section position above the M1 segment, the 1.5T mIP images were realigned to the 3T mIP images by use of FLIRT (FMRIB Software Library)23 before the NVVV calculation.
Statistical Analyses
Statistical analysis was performed by use of Matlab. Variables were expressed as means ± standard deviations. Group differences were assessed by use of the Wilcoxon rank sum test. Differences between 1.5T and 3T NVVV in the healthy volunteers were assessed by the Wilcoxon signed rank test. Linear dependencies of other physiologic markers with NVVV were tested by the Pearson correlation coefficient. Group differences or linear relationships were considered significant if P < .05.
Results
Of the 21 patients with SCD, 15 were receiving hydroxyurea therapy (mean years of therapy, 5.4 ± 1.8 years; 1.5T = 7; 3T = 8), 2 were receiving long-term transfusion therapy (mean years of therapy, 3.85 ± 0.91 years; 1.5T = 2), and 4 were not receiving therapy (1.5T = 3; 3T = 1).
The SCD group had a visually lower venous contrast and overall visible venous vasculature than the control group (Fig 1). The loss of visible venous vasculature in the SCD group appeared to be global, with loss of venous contrast in both the deep medullary and regional cortical veins. By radiologic review, there were no focal regions of decreased or increased venous contrast. However, the presence of arteries (grade I, II, or III) in the mIP SWI was observed in 18 (grade I = 7; grade II = 9; grade III = 2) of the 21 SCD examinations and in none of the 21 healthy control examinations. Larger arterial contributions (grade II or III) were more prominent in the 1.5T cohort (all grades: grade 0 = 1; grade I = 1; grade II = 8; grade III = 2) than in the 3T cohort (all grades: grade 0 = 2; grade I = 6; grade II = 1; grade III = 0). Arterial signal contributions in the mIP SWI originated from hypointense signal in the SWI magnitude images and not from the phase mask multiplication. Figure 2 illustrates that many of the hypointense-appearing vessels on the mIP SWI corresponded to a hyperintense arterial signal on the mIP MRA. Because the arterial contribution could not be removed from the mIP SWI, NVVV is overestimated in the SCD groups because of the inclusion of these hypointense arterial vessels.

SWI, mIP SWI, and segmented vein maps for a representative control (top row, NVVV = 0.032) and patient with SCD (bottom row, NVVV = 0.013). In the mIP SWI and segmented vein maps, there is visually less venous contrast in the examination from the patient with SCD. The arrows point to loss of cortical venous conspicuity in the frontal (A), temporal (B), occipital (C), and deep medullary (D) areas, indicating a global decrease in signal.

An SCD mIP SWI (A) with several hypointense-appearing vessels that could be interpreted as veins (black arrowheads). The corresponding MIP TOF (B) indicated that many of the hypointense-appearing vessels on the mIP SWI correlate with a hyperintense arterial signal from the TOF (white arrowheads). The arrows indicated arterial contribution of more distal branches of the left and right (anterior to posterior) bilateral anterior, middle, and posterior cerebral arteries. This example received a grade of II because of a hypointense arterial signal on the mIP SWI in the anterior Sylvian fissure through to the posterior temporal lobe.
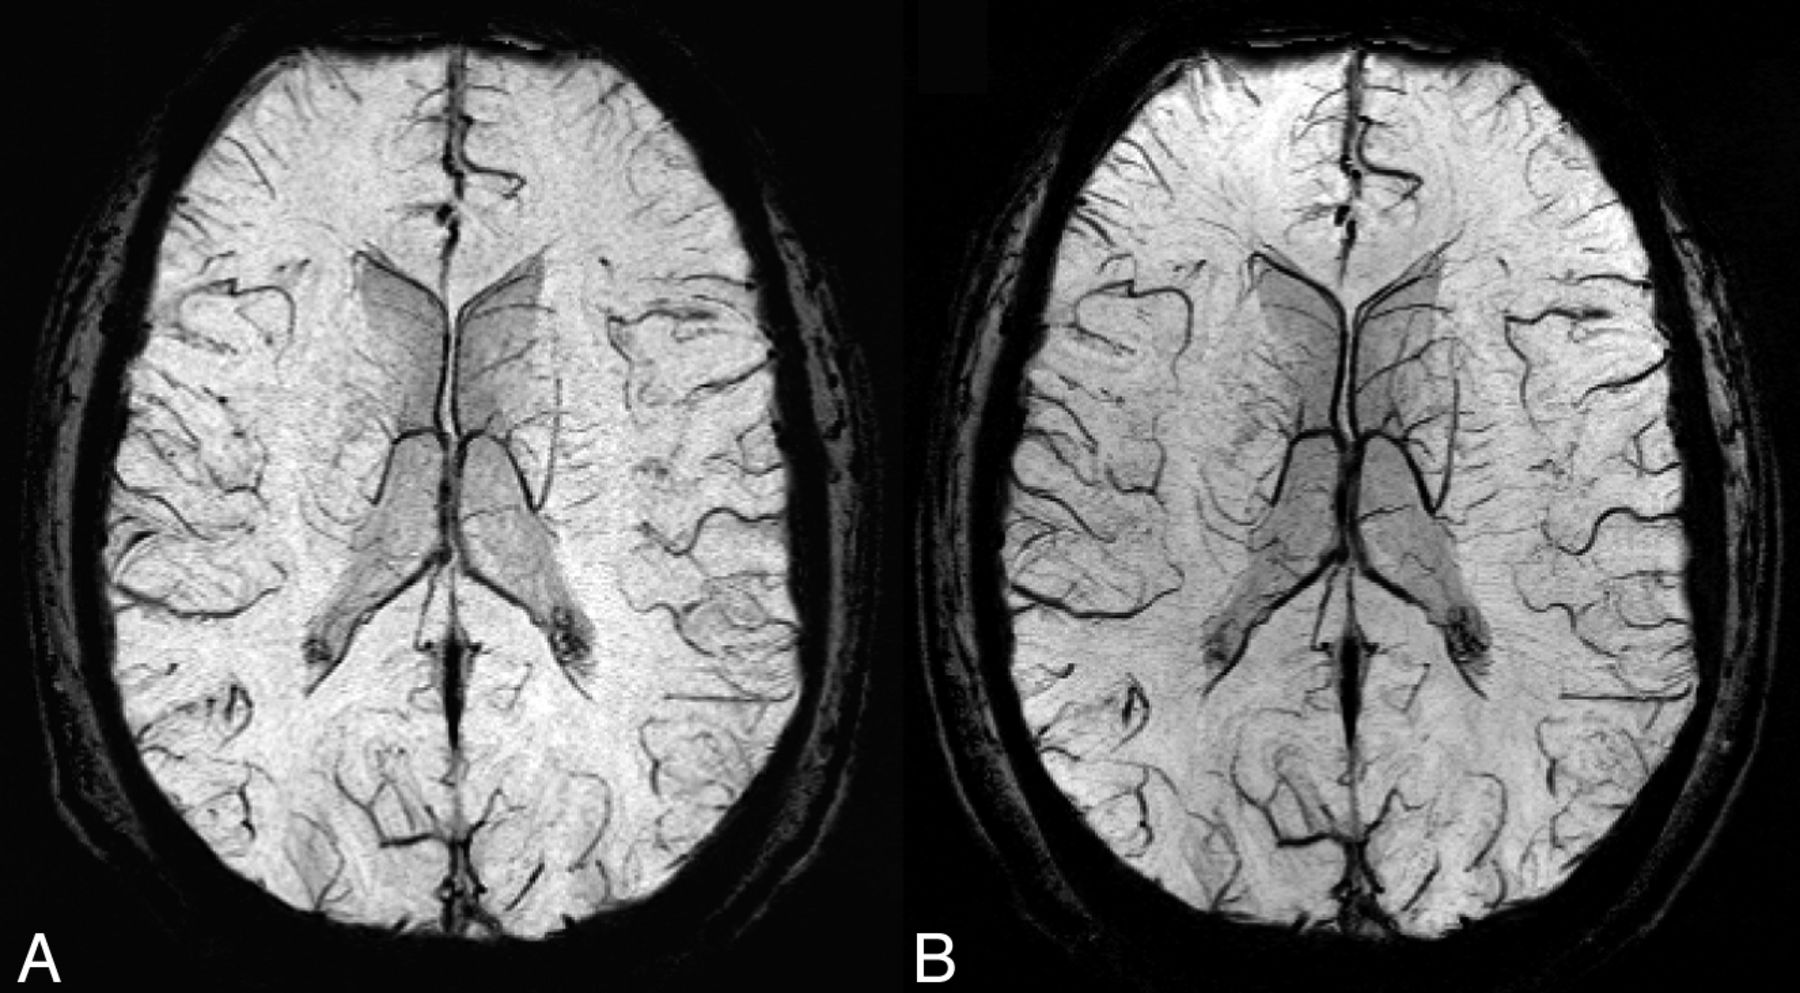
Because the examinations in the SCD group were acquired at 2 magnetic field strengths, the first test analyzed differences in the NVVV by using the segmented vein mask of healthy volunteers who underwent scanning at 1.5T and 3T. There was a significant difference (P = .03) in the NVVV between the 1.5T (0.024 ± 0.006) and 3T (0.028 ± 0.009) examinations. This finding indicates a bias toward higher NVVV at 3T. Figure 3 depicts a representative mIP SWI from the same volunteer who underwent scanning at 1.5T and 3T.

Representative mIP SWI from the same volunteer who underwent scanning at 1.5T (A) and 3T (B) depicts similar venous anatomy. The combination of higher SNR and venous contrast at 3T results in an improved venous conspicuity and a higher venous vessel likelihood from the Frangi filter. Several veins (eg, deep medullary veins) appear larger at 3T. The combination of larger-appearing veins and a higher vessel likelihood we believe were attributed to the increased conspicuity of NVVV at 3T.
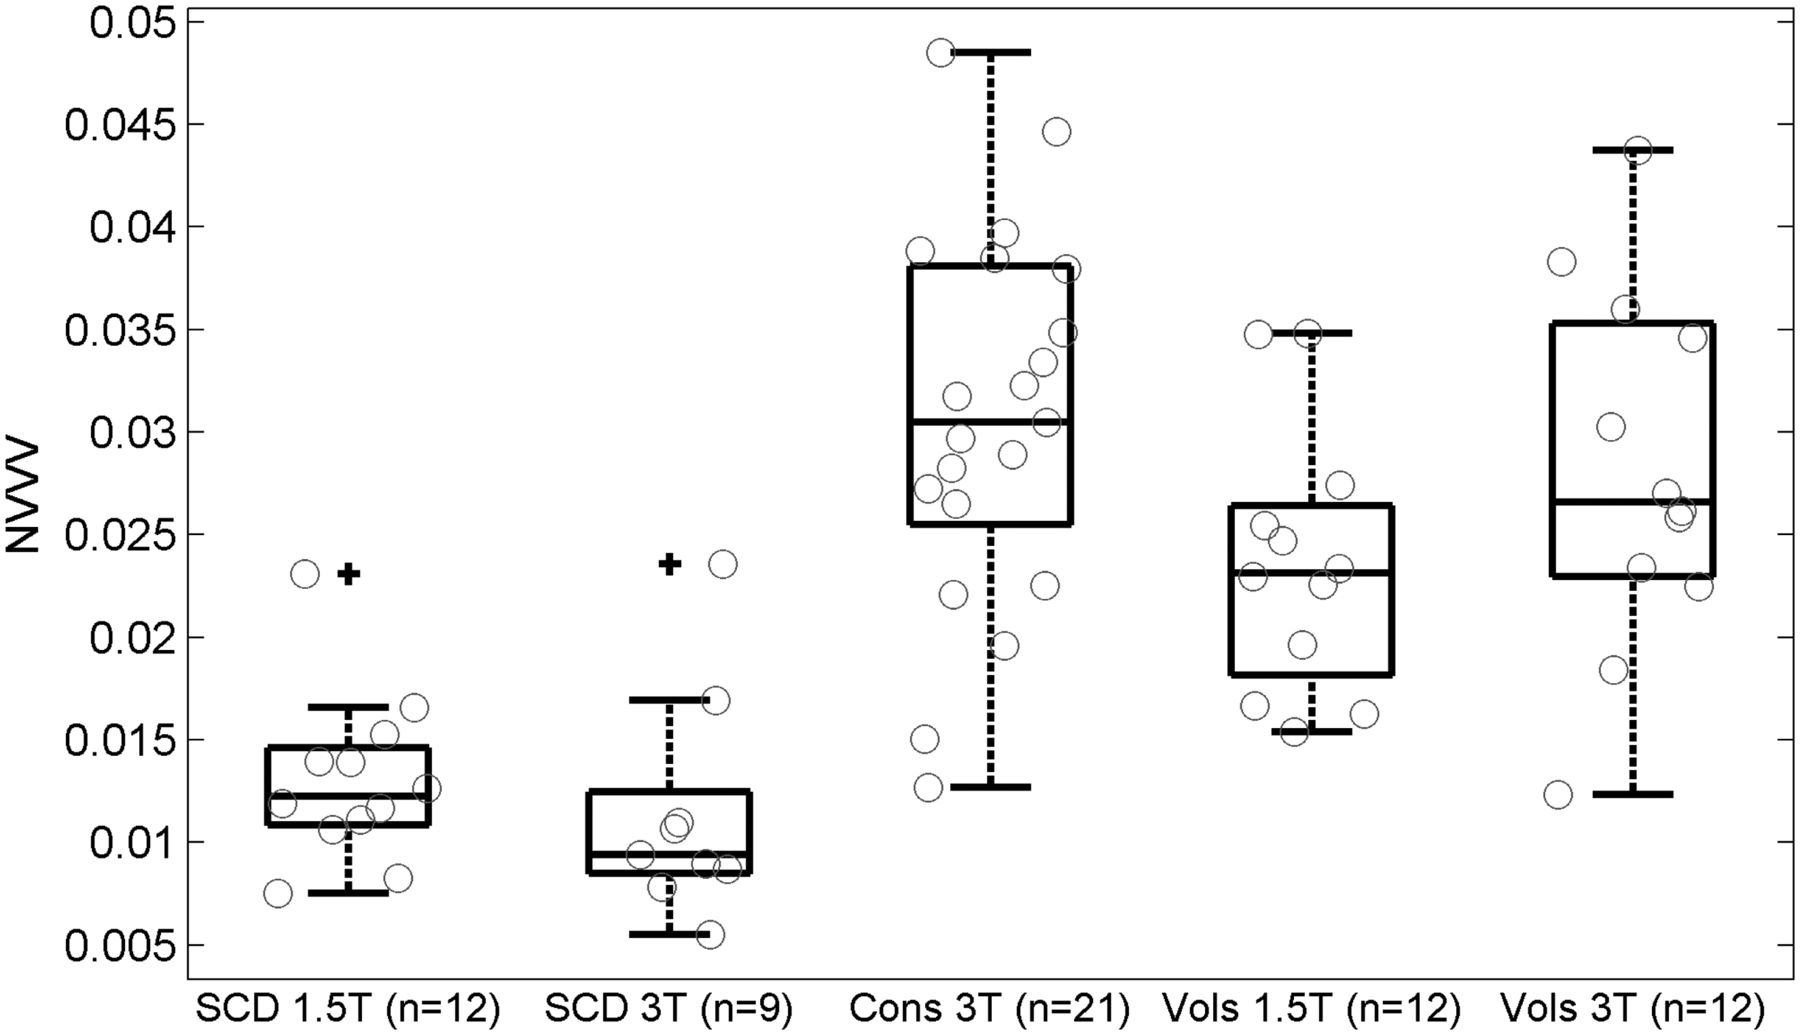
The measured NVVV in the SCD group was 0.013 ± 0.004 (n=12) and 0.011 ± 0.006 (n=9) at 1.5T and 3T, respectively. The measured NVVV in the healthy control participants at 3T was 0.031 ± 0.009 (n=21; Fig 4). There was no significant difference in NVVV measured at 1.5T and 3T in the SCD group (P = .21). The field strength bias detected in the volunteers was not observed in the SCD group. No sex differences (P = .65) or age-related changes (P = .38) in NVVV were observed in the healthy control participants and volunteers at 3T.

Boxplot of the NVVV in the SCD group (1.5T = 0.013 ± 0.004; 3T = 0.011 ± 0.006), control group (3T = 0.031 ± 0.009), and volunteers (1.5T = 0.024 ± 0.006; 3T = 0.028 ± 0.009). The difference in NVVV between the 3T SCD and control groups was significant (P < .001) when assessed by the Wilcoxon rank sum test. Volunteer measurements at 1.5T and 3T indicate increased conspicuity of NVVV at 3T (P = .03) when assessed by the Wilcoxon signed rank test.
Because of the field bias observed in the volunteer measurements, cohort differences were only analyzed from the 9 patients with SCD at 3T and their corresponding 9 sex- and age-matched healthy control participants. There was a significantly lower NVVV in the 3T SCD group when compared with the healthy control group (0.034 ± 0.011; n=9; P < .001). So we would not further reduce our SCD sample size, we correlated NVVV with hematologic variables from all SCD examinations. The correlation of NVVV with hematologic variables was evaluated to determine parameters that may influence venous contrast in the SCD group. There was no significant correlation of NVVV (Table) with hemoglobin concentration (R = 0.25; P = .28), hemoglobin F (R = −0.09; P = .71), hemoglobin S (R = −0.25; P = .31), absolute reticulocyte count (R = 0.10; P = .66), or white blood cell count (R = 0.19; P = .40).
Discussion
This study was undertaken to compare the BOLD-sensitive SWI venous contrast between patients with SCD and an age- and sex-matched healthy population and correlate these findings with hematologic variables in patients with SCD. We found that SCD affects the venous conspicuity of SWI. The NVVV was significantly lower in patients with SCD than in healthy control participants. From a qualitative perspective, SWI in patients with SCD produced a global isointense signal, which was similar in appearance to the diminished venous conspicuity reported in high-flow conditions found during anesthesia14 and carbogen challenges.12 To better understand the pathophysiology of decreased venous conspicuity in SCD, we investigated the relationship between SCD SWI venous contrast and hematologic variables. There were no correlations between the hematologic variables and SCD NVVV, suggesting that other or more complex mechanisms affect venous conspicuity.
The Frangi vesselness filter was used to quantify venous contrast.17 The automated vesselness filter method is superior to a qualitative categoric grading system of weak or strong contrast because it provides a continuous variable with which physiologic parameters can be correlated and is not subject to user-dependent segmentation methods. The mIP images were used in the analysis because they had higher conspicuity of the venous vasculature than SWI, allowing better sensitivity of venous segmentation. The use of mIP images with the same section thickness in both the SCD and control groups allowed a direct comparison between the groups. However, the use of mIP images will overestimate a true venous volume because the same venous vessels are replicated on multiple sections.
In this study, there was a significant difference in NVVV between patients with SCD and healthy control participants. This difference is unlikely the result of a morphologic decrease in the venous vasculature in patients with SCD but, instead, may be caused by decreased venous contrast. We excluded patients with a history of stroke, Moyamoya, encephalomalacia, severe stenosis, or major vessel occlusion to eliminate any confounding variance from known macrovasculature or microvasculature disease that could influence NVVV. Failure of the linear flow compensation observed in 86% of the SCD examinations resulted in the inclusion of an arterial vessel signal in the NVVV. This results in an overestimation of the true apparent NVVV and indicates a larger difference between patients with SCD and healthy control participants. A hypointense signal from arteries in a fully flow-compensated SWI sequence could indicate nonlinear flow or high flow acceleration. The tortuous arterial vessels reported in SCD24,25 could attribute to the difference in flow compensation performance between the patients with SCD and healthy control participants.
Given that SCD can affect the concentration of paramagnetic deoxyhemoglobin,26 the source of contrast in SWI, it was expected that hematologic variables such as hemoglobin levels or absolute reticulocyte count might correlate with the amount of venous contrast in SWI. However, we did not find any significant correlation between the hematologic variables and NVVV, which may be due to the relatively small number of patients in our study and the included arterial signal contributions. However, changes in hematologic variables such as hemoglobin concentration can affect other important parameters such as CBF,16,27 which may play a more primary role in affecting NVVV. In this retrospective study, blood flow or perfusion values were not available to investigate this relationship. From a physiologic standpoint, because of the lower oxygen-carrying capacity of hemoglobin S and the chronic anemic state in SCD, CBF increases to maintain a constant oxygen extraction fraction.2,28 SWI is sensitive to CBF changes,12⇓–14 and CBF could be a cause for altered SWI contrast in SCD. The elevated CBF reported in SCD,15,28 combined with the decreased concentration of deoxyhemoglobin,26 may represent a complex multifactorial physiologic mechanism that results in diminished SWI contrast in SCD.
There were no significant sex differences or age-related changes in NVVV in either the patients with SCD or healthy control participants and volunteers at 3T. Volunteer measurements at 1.5T and 3T detected a bias of higher NVVV at 3T. One possible mechanism for the difference is that the TEs were not scaled proportionally for the change in magnetic field. To produce similar phase effects, the product of magnetic field strengths and TE should be equal.29 A TE of 40 ms at 1.5T only produces 80% of the phase offset of a TE of 25 ms at 3T. SNR also increases with higher field. The combination of higher SNR and larger-phase offset at 3T improved contrast to noise and conspicuity of smaller venous vessels at 3T and, thus, a larger NVVV. However, NVVV was higher at 1.5T than at 3T in the SCD cohort. The higher NVVV could be attributed to a larger degree of arterial contribution (grade II or III) in the 1.5T SCD examinations than in the 3T SCD examinations.
A limitation of this retrospective study was the small number of patients with SCD. Several factors could have impeded our ability to elucidate hematologic effects with NVVV, which included a small sample size, data at 2 different fields, and arterial contribution. Further SWI sequence design to include acceleration compensation or postprocessing techniques would be necessary in future studies to eliminate an arterial signal to provide a better estimate of NVVV. Another study limitation was the absence of flow data to determine its relationship with NVVV. The small number of patients with SCD who did not receive treatment or received transfusions did not allow an analysis of treatment-related NVVV effects. A longitudinal prospective study at a single field across different SCD treatment groups is needed with quantitative measures of cerebral flow to determine the relationship of NVVV in SCD, and to assess if quantitative SWI measures could be used as surrogate markers of disease severity and treatment success.
Conclusions
Our study is the first to describe a spectrum of SWI changes in children with SCD across multiple therapies. SWI venous conspicuity (NVVV) was significantly lower in patients with SCD than in healthy age- and sex-matched control participants. Given that SCD produces a complex physiologic response to maintain adequate cerebral oxygenation, several factors, particularly cerebral blood flow and perfusion, may play a role in this decreased contrast in SWI. Prospective studies that include concomitant longitudinal hematologic and flow measurements are required to determine the physiologic mechanisms of decreased venous conspicuity in SCD and their usefulness as a possible biomarker of disease severity.
Acknowledgments
We thank Dr. Vani Shanker for editing the manuscript and Dr. James Langston for his insightful discussion. We would also like to thank Melissa Jones and Dr. Axel Krafft for assistance in volunteer recruitment scanning.
Footnotes
Disclosures: Adam M. Winchell—Grant: NIH,* HL070590. Paul Grundlehner— Comments: I was supported in part by 5R25CA02394 from the National Cancer Institute of the NIH. Ralf B. Loeffler—Grant: NIH,* HL070590. Winfred C. Wang—Grant: NIH HL070590.* Robert J. Ogg—Grant: NIH (R01HD049888).* Claudia M. Hillenbrand—Grant: NIH,* HL070590 (Comprehensive Sickle Center Scholar). Kathleen J. Helton—Grant: NIH R01HD049888.* *Money paid to institution.
Grant support: NIH HL070590 (Comprehensive Sickle Center Scholar), NIH R01HD049888, and American Lebanese Syrian Associated Charities (ALSAC).
Indicates open access to non-subscribers at www.ajnr.org
REFERENCES
- Received May 2, 2013.
- Accepted after revision September 24, 2013.
- © 2014 by American Journal of Neuroradiology


Jump to section
Related Articles
Cited By...
- No citing articles found.