
Abstract
BACKGROUND AND PURPOSE: Increased echogenicity of the substantia nigra is a typical transcranial sonography finding in Parkinson disease. Experimental software for digital analysis of the echogenic substantia nigra area has been developed. The aim of this study was to compare the evaluation of substantia nigra echogenicity by using digital analysis with a manual measurement in patients with Parkinson disease and healthy volunteers.
MATERIALS AND METHODS: One hundred thirteen healthy volunteers were enrolled in the derivation cohort, and 50 healthy volunteers and 30 patients with Parkinson disease, in the validation cohort. The substantia nigra was imaged from the right and left temporal bone window by using transcranial sonography. All subjects were examined twice by using different sonographic machines by an experienced sonographer. DICOM images of the substantia nigra were encoded; then, digital analysis and manual measurement of the substantia nigra were performed. The 90th percentile of the derivation cohort values was used as a cut-point for the evaluation of the hyperechogenic substantia nigra in the validation cohort. The Spearman coefficient was used for assessment of the correlation between both measurements. The Cohen κ coefficient was used for the assessment of the correlation between both measurements and Parkinson disease diagnosis.
RESULTS: The Spearman coefficient between measurements by using different machines was 0.686 for digital analysis and 0.721 for manual measurement (P < .0001). Hyperechogenic substantia nigra was detected in the same 26 (86.7%) patients with Parkinson disease by using both measurements. Cohen κ coefficients for digital analysis and manual measurement were 0.787 and 0.762, respectively (P < .0001).
CONCLUSIONS: The present study showed comparable results when measuring the substantia nigra features conventionally and by using the developed software.
ABBREVIATIONS:
- AC1
- first-order agreement coefficient
- I
- intensity
- PD
- Parkinson disease
- SN
- substantia nigra
- TI
- tissue index
- TCS
- transcranial sonography
Parkinson disease (PD) is a progressive neurodegenerative disorder. Postmortem and neuroimaging studies showed that PD-associated neuronal dysfunction, cell loss, and α-synuclein pathology begin years before clinical symptoms appear and clinical diagnosis is possible.1⇓⇓–4 This preclinical period may be the most promising time window for successful neuroprotective interventions in PD.5
Increased echogenicity of the substantia nigra (SN) is a typical transcranial sonography (TCS) finding in patients with PD. Recent studies reported an enlarged hyperechogenic SN in approximately 90% of patients with PD, by using cutoff values between 0.20 and 0.25 cm2, depending on the specific sonography system used.6,7 In contrast, a hyperechogenic enlarged SN is detectable in only approximately 10% of healthy volunteers.8 Moreover, this feature is already present in prediagnostic disease stages and persists during the course of PD without significant changes.9,10 Approximately 60% of healthy volunteers with hyperechogenic SN show a decrease in 18F-DOPA uptake in the striatum,8 and hyperechogenic SN is more frequently observed in subjects prone to develop extrapyramidal symptoms after neuroleptic therapy.11
However, the main limitation of TCS in the evaluation of SN hyperechogenicity is the dependence of image quality on both the sonographer's experience and the quality of the bone window.12⇓–14 Digital analysis of TCS images of the SN could eliminate this limitation. We developed an experimental application B-mode Assist System with a graphic user interface in Matlab (MathWorks, Natick, Massachusetts), an integrated development environment with a plug-in Image Processing Toolbox, for digital analysis of SN echogenicity.15,16
The aim of the study was to compare the manual measurement of SN with digital analysis of SN echogenicity by using the developed software obtained by 2 different sonography machines in patients with PD and healthy volunteers.
Materials and Methods
One hundred nineteen healthy volunteers were examined in the neurosonologic laboratory during 1 month for the evaluation of normal values for SN for both manual and automatic measurements of the area: the derivation cohort. Two months later, 52 healthy volunteers and 32 patients with PD were enrolled in the validation study: the validation cohort. Patients with PD were diagnosed in accordance with the UK Parkinson's Disease Society Brain Bank criteria.17 Subjects who exhibited low quality of the TCS B-mode (due to an insufficient temporal bone window) as tested by the developed software were excluded from the study—6 in the derivation cohort, 2 healthy volunteers, and 2 patients with PD in the validation cohort. The image quality was evaluated by a developed B-mode Assist System as a part of the digital analysis of the image. Images with a mean value of brightness intensity (I) ≥ 25 in all 5 × 5 mm pixels were considered low-quality. The entire study was conducted in accordance with the Declaration of Helsinki of 1975 (as revised in 2004 and 2008). The study was approved by the ethics committee of the University Hospital Ostrava. All patients provided written informed consent.
Transcranial Sonography
The substantia nigra was imaged in all subjects from both the right and left temporal bone windows in the axial mesencephalic plane. Two examinations of the SN were performed by using 2 different machines, My Lab Twice (Esaote, Genova, Italy) with a PA 240 phased array (machine 1) and Vivid 7 Pro (GE Healthcare, Horten, Norway) with a 3S phased array (machine 2) in all subjects during a 2-week period.
The examination was performed through a temporal bone window with the following parameters: for the My Lab Twice: a penetration depth of 16 cm; penetration, high; dynamic range, 7 (50 dB); frequency, 1–4 MHz; enhancement, 3; attenuation, 2; view, 9; persistence, 7; dynamic compression, 0; gain, 36%; gray map, 0; S view, off; 2 focuses in 5 and 10 cm; mechanical index, 0.9; tissue indices (TIs) 1.0, TIB 1.0, and TIC 2.1; for the Vivid 7 Pro: penetration depth, 15 cm; dynamic range, 51 dB; frequency, 1.5–3.6 MHz; persistence, 5.6; frame rate, 24.5/s; filter reject, 2; gain, −10; gray map, J; 2 focuses in 5 and 10 cm; mechanical index, 1.2; TIC, 1.4.
The butterfly-shaped structures of the mesencephalic brain stem and the region of the SN were depicted as clearly as possible from the transversal plane (Fig 1). The right and then the left temporal bone windows were used, and both images were saved in DICOM format. Personal data and examination times were deleted, and all acquired images were encoded as anonymized data by using a unique key before manual measurement or digital analysis.

Transcranial sonography: brain stem with the substantia nigra imaged from a transtemporal approach, axial mesencephalic plane. 1) middle cerebral artery, 2) perimesencephalic cisterns, 3) substantia nigra, 4) fourth ventricle, and 5) brain raphe.
Four images (1 image from the left side and 1 from the right side acquired by using both machines) were obtained from each subject. All examinations were performed by a single sonographer (D.Š.) who was blinded to the patient diagnoses but not to movement disorder symptoms.
Manual and Automatic Measurements
The SN ipsilateral to the insonation was assessed from both sides. Manual SN echogenic size measurements were performed on axial scans automatically after manual encircling of the outer circumference of the echogenic SN area from encoded images by the same experienced sonographer (D.Š.) with 15 years' experience with TCS evaluation of the SN.18,19 Interinvestigator and intrainvestigator correlations were published previously.14
For all subsequent processing steps of the digital analysis and measurement, images without SN-area encircling were converted to 8-bit gray-scale (intensity value I = 0–255). The designed algorithm allowed region-of-interest-based processing on gray-scale images with intensities of 0–255, binary thresholding, and computation of areas inside an elliptic region of interest. The size and shape of the region of interest were based on the histologic image of the SN (Fig 2), and the same region of interest was used for digital analysis of all images.15,16 Input images were loaded into the application and cropped to a window of 50 × 50 mm from the native axis of the image. A predefined elliptic region of interest was manually placed in the region of the SN by a single technician (J.B.) trained in TCS image evaluation. The algorithm computed the area for each I (from 0 to 255) inside the total area = 50 mm2 of the elliptic region of interest circumscribed in the ipsilateral SN. The echogenicity index as a total sum of areas (area under the curve) was counted for each image. The 90th percentile value from the derivation cohort was set as a border value. The difference between the border value and the counted value of the echogenicity index of each image in the validation cohort was used for differentiation between normal (minus values) and hyperechogenic SNs (plus values) (Fig 3).

Placement of the region of interest (green) for digital analysis on the TCS brain stem images obtained from a healthy volunteer (A) and a patient with Parkinson disease (B).

The difference between the 90th percentile of the derivation cohort (red line; echogenicity index, 18.536) and the counted value in the validation cohort (black) measured by using machine 1. A, Normal echogenicity of the substantia nigra (echogenicity index, 11.760). B, Hyperechogenic substantia nigra (echogenicity index, 31.810).
Statistics
The Shapiro-Wilk test was used for the correspondence of calculated parameters to a normal distribution. Data with a normal distribution are reported as mean ± SD. All parameters not fitting a normal distribution are presented as mean, median, and interquartile range. Comparative statistical analysis was performed to calculate the level of linear correlation, with the Spearman correlation coefficient (r), between both manual measurement and digital analysis, right and left temporal bone windows, and different sonographic machines. The Cohen κ and first-order agreement coefficient (AC1) were applied when we statistically assessed the correlation between PD diagnosis and manual measurement or digital analysis results. The higher values of manually measured echogenic SN areas and echogenicity indices obtained by using digital image analysis from the right and left temporal bone windows were used for these statistics. Receiver operating characteristic curves for PD diagnosis by using both measurements with area under the curve and optimal cut-point determination were performed for machine 1. Statistical evaluations were performed by using SPSS, Version 17.0 (IBM, Armonk, New York).
Results
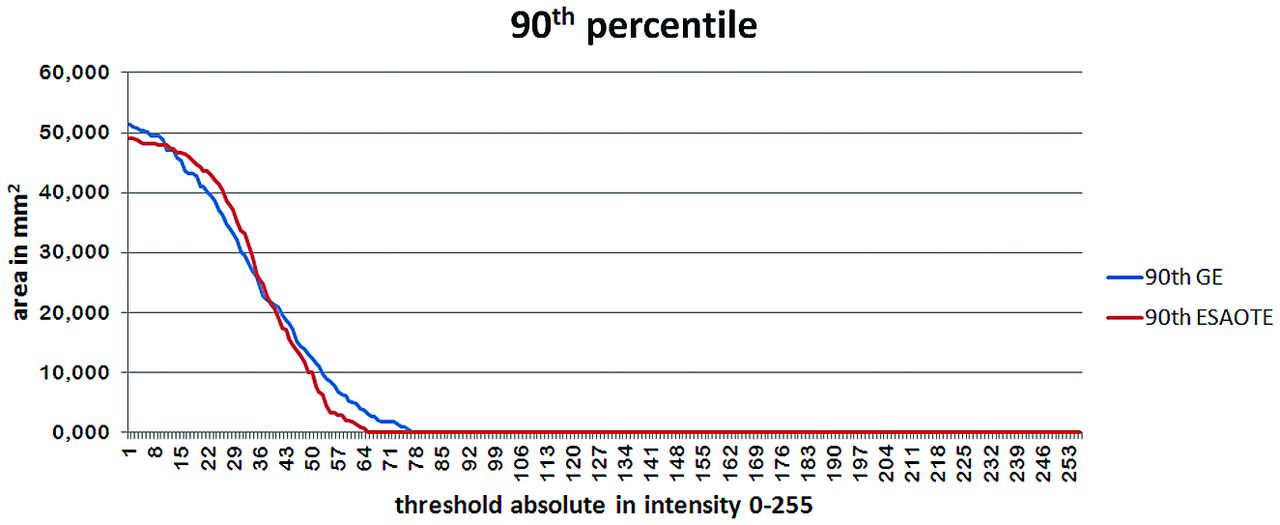
After subjects (healthy volunteers and patients with PD) with a low quality of the TCS B-mode were excluded, 113 healthy volunteers in the derivation cohort and 50 healthy volunteers and 30 patients with PD in the validation cohort were evaluated. Demographic data of the derivation and validation cohorts are presented in Table 1. The 90th percentile values for both machines established from SN images of the derivation cohort are shown in Fig 4. The SN echogenicity index, counted by using digital analysis, was highly correlated between machine 1 and machine 2 (r = 0.996, P < .01). The values of the 90th percentile of the echogenicity index for machines 1 and 2 were 18.536 and 18.078, respectively. The coefficient of variation between the 2 measurements of the same image with a repeat region-of-interest placement was 1.8%. The manually measured 90th percentile of the SN area was equal for both machines (0.24 cm2).

The 90th percentile of the derivation cohort for the Esaote My Lab Twice (machine 1) and GE Healthcare Vivid 7 Pro (machine 2) machines.
Demographic data of the derivation and validation cohorts
The 90th percentile values for both machines and both manual measurement and digital analysis were used as border values in the validation cohort. The bilateral hyperechogenic SN was detected in 4 volunteers by using machine 1 and digital analysis of the TCS image. In the same 4 volunteers, the bilateral hyperechogenic SN was detected by using machine 2 and digital analysis of the TCS image, but only in 2 of them was an enlarged hyperechogenic SN ≥ 0.24 cm2 found by using manual measurements in both machines. In the remaining 2 subjects with hyperechogenic SNs in digital analysis, the manually measured SN area was borderline (0.23 and 0.24 cm2, respectively).
The correlations between the manual measurement and digital analysis for both machines, between images obtained by different machines, and between the right and left SN by using both manual measurement and digital analysis are presented in Table 2.
Correlations between manual measurement and digital analysis of substantia nigra echogenicity for both machines, between measurements performed using different machines, and between the right and left substantia nigra using both manual measurement and digital analysis
Cohen κ and AC1 coefficients for digital manual measurement and digital analysis were κ = 0.762 (95% CI, 0.615–0.909), AC1 = 0.787; and κ = 0.787 (95% CI, 0.648–0.926), AC1 = 0.812, respectively (P < .0001 for both measurements). Receiver operating characteristic curves for PD diagnosis by using both measurements and machine 1 are shown in Fig 5. Areas under the curve for manual measurement and for digital analysis were 0.936 (95% CI, 0.882–0.990) and 0.937 (95% CI, 0.884–0.990), respectively. The optimal cut-point for the echogenic area by using manual measurements was >0.25 cm2, with 86.7% sensitivity and 96.0% specificity for PD. The optimal cut-point for the echogenicity index by using digital analysis was >18.576 for machine 1 and >18.118 for machine 2, with 86.7% sensitivity and 92.0% specificity for PD.

Receiver operating characteristic curve for Parkinson disease diagnosis using manual measurement (blue) and digital analysis (red) of the substantia nigra for machine 1.
Discussion
Correlations between manual measurement and B-mode Assist System digital analysis were high in the presented study, with the Spearman coefficient > 0.6. Both correlations between measurements from images acquired from different machines and between right and left SN were similar when measured manually and digitally. The similar correlation coefficients between measurement of the right and left SN by using both manual measurement and digital analysis showed that both techniques were able to detect the asymmetry in SN echogenicity.
At present, no software for the evaluation of SN hyperechogenicity is routinely used. Contrary to previously tested programs (software) based on image segmentation and consecutive measurement of the hyperechogenic SN area,20⇓–22 the presented software did not use an arbitrary cutoff value of echogenicity (represented by brightness intensity) for the evaluation of the hyperechogenic SN area. Problems with determination of this cutoff value are the main limitation for routine use of such software because only minor changes of this value lead to a substantial shift in measured SN area. Results of the present study demonstrate the usability of digital analysis of SN echogenicity with the developed B-Mode Assist System software, which counts the SN echogenicity index instead of the SN area measured by previously developed software programs. Thereby, it overcomes the problems with determination of the echogenicity cutoff value.
Despite progress in the quality of TCS images obtained by high-end sonographic machines, the main limitation of sonographic B-mode evaluation is still the dependence on the sonographer's experience and skill, and the results may be biased, especially with less experienced investigators.14,18 In addition, the quality of the TCS examination is dependent on the bone window quality.12,13,18 In contrast to the second limitation, the first one should be partially eliminated by using the developed software.15,16
The 90th percentile of the SN area measured in healthy volunteers is used as a border between normal and hyperechogenic enlarged SNs.18 This value differs between different machines and sonographers, usually between 0.20 and 0.25 cm2.6⇓–8,18,23 In the presented derivation cohort, the 90th percentile for both machines (My Lab Twice and Vivid 7 Pro) was the same (0.24 cm2). Moreover, the 90th percentile of the echogenicity index using software for the digital analysis of the image was similar for both machines. These results demonstrated the reproducibility of SN features measured by TCS, not only when the same machine is used but also when using 2 different high-end machines (My Lab Twice and Vivid 7 Pro).7,9,10,18,24⇓–26 Several previous studies showed that TCS is an easily reproducible method and has a high specificity and sensitivity for the diagnosis of PD.7,9,10,18,24⇓–26 Interinvestigator and intrainvestigator correlations of SN evaluation are high and statistically significant (r ≥ 0.85, Cohen κ coefficient = 0.83, intraclass correlation coefficient = 0.84–0.96).9,14,23,26⇓–28 However, semiquantitative TCS evaluation of SN echogenicity and measurement of the SN area are highly dependent on the sonographer's experience, with significant correlations observed only for the experienced physician sonographers (r ≥ 0.85, P < .001) and poor correlations for the sonographic lab assistant or physician without sonographic experience (r < 0.47, P > .05).14
One of the main roles of a digital analysis of SN echogenicity should be the improvement of interinvestigator and intrainvestigator correlations. Nevertheless, its potential use in the detection of changes in SN echogenicity during a course of PD should be tested in the future. Studies with manually measured SN did not show any changes in the hyperechogenic SN area in patients with PD during a 5-year follow up.9 The results of several animal and postmortem studies demonstrated that SN echogenicity is significantly dependent on its iron content, and increased tissue iron concentration correlates with SN hyperechogenicity.8,29⇓–31 This, together with an apparently autosomal dominant inheritance of this echo feature in relatives of patients with idiopathic PD, supports the idea of a primary role of disturbed iron metabolism in PD.32 It is still possible that other factors contribute to SN hyperechogenicity, such as abnormal iron-protein bindings, gliosis, and structural changes of neurons or glial cells (atrophy, morphologic changes of cells) in the SN.33 Due to overcoming the dependency on a subjective bias when evaluating the echogenic SN area manually, the digital analysis of SN echogenicity should be tested for detection of minor and slow changes in SN echogenicity in patients with PD in future studies.
Several limitations of the present study should be mentioned. First, the TCS examination was performed only by a single well-trained sonographer. Sonographers without TCS experience could have problems with correctly imaging the SN. MR imaging–TCS fusion imaging with virtual navigation technology could be helpful in this case. Second, the quality of the TCS image is influenced by the quality of the sonography machine and its preset parameters. For digital analysis, the optimal quality of the TCS image is evaluated by developed software, but it is very subjective when using manual measurements. Finally, the standard sonography system settings should be used.33 Especially, changes in settings influencing the image brightness (eg, gain or dynamic range) could lead to a bias. This influence of gain changes can be overcome by also performing the B-mode Assist System digital image analysis for the reference region (eg, thalamus or occipital lobe white matter) and by using the obtained data for a correction of the digital analysis of the SN area. For the future, there is a new technique, MR imaging–TCS fusion imaging with virtual navigation technology, that could be helpful in more accurate TCS diagnostics.34 This technique enables simultaneous real-time TCS and MR imaging (or CT) of brain structures, with possible overlapping of both images.35 It allows one to exactly determine several structures on TCS imaging for subsequent analysis (eg, substantia nigra, red nucleus, brain raphe, caudate nucleus, lenticular nucleus, or insular cortex).
Conclusions
Digital analysis of SN echogenicity by using the B-mode Assist System showed comparable results with conventional manual measurement of the echogenic SN area by an experienced sonographer. The presented digital analysis may overcome the main limitation of TCS evaluation of SN—the dependence on the sonographer's experience.
Footnotes
Disclosures: David Školoudík—RELATED: Grant: Moravian-Silesian Region.* Petra Bártová—RELATED: Grant: Moravian-Silesian Region.* *Money paid to the institution.
This work was supported by a grant from the Moravian-Silesian Region, No. CZ.1.05/2.1.00/010030.
Paper previously presented as a special oral presentation at: Annual Meeting of the American Academy of Neurology, March 16–23, 2013; San Diego, California.
Indicates open access to non-subscribers at www.ajnr.org
References
- Received February 24, 2014.
- Accepted after revision May 26, 2014.
- © 2014 by American Journal of Neuroradiology


Jump to section
Related Articles
Cited By...
- No citing articles found.