
Abstract
BACKGROUND AND PURPOSE: To date, MRS study of both normal and pathologic brains have focused mainly on the supratentorial regions; few studies have investigated the infratentorial regions. However, the pons, an important structure of the brain, is associated with many neurodegenerative diseases and is often damaged by brain trauma. For MRS study of pontine disease, one must obtain MRS reference data on normal metabolite levels in the pons, including data on how these levels vary with age. The aim of this study was to analyze normal, age-related, metabolic changes in the pons by using turbo spectroscopic imaging.
MATERIALS AND METHODS: Seventy-eight healthy subjects with ages ranging from 5 days to 78 years were included in this study. NAA/Cr, Cho/Cr, and Cho/NAA ratios were measured by using turbo spectroscopic imaging. The 78 cases were divided into 4 groups by age: 0–5, 6–20, 21–50, and older than 50 years. The metabolite levels were compared with observed age-related changes among the groups.
RESULTS: The normal mean pontine metabolite ratios obtained for the combined age groups were NAA/Cr, 2.44 ± 0.45 (mean); Cho/Cr, 1.93 ± 0.25; and Cho/NAA, 0.83 ± 0.28. Statistically significant differences were found in the NAA/Cr between the 0- to 5- and 6- to 20-year-old groups, and among the 6- to 20-, 21- to 50-, and older than 50-year-old groups. A statistically significant difference was found in Cho/Cr between the 0- to 5- and 6- to 20-year-old subjects; however, no differences were found among the 6- to 20-, 21- to 50-, and older than 50-year-old groups. Statistically significant differences in Cho/NAA were also found among the 4 age groups. The NAA/Cr at birth was low, it rose rapidly at 0–5 years, reaching a peak at approximately 10–20 years, and then gradually decreased. The Cho/Cr decreased rapidly at 0–5 years, then continued to decline, and was stable after 20 years of age.
CONCLUSIONS: Turbo spectroscopic imaging is a good method for analyzing normal changes in the pons metabolites during growth, maturation, and aging.
ABBREVIATION:
- TSI
- turbo spectroscopic imaging
Proton MR spectroscopy of the human brain is being increasingly used for both research and clinical applications.1 To date, most spectroscopic studies of both normal and pathologic brains have focused mainly on the supratentorial brain regions.2⇓⇓⇓⇓⇓⇓⇓–10 In contrast, few studies have investigated the infratentorial regions and brain stem.11⇓–13
The pons is part of the brain stem and is an important structure of the human brain. It contains various motor and sensory nuclei and bundles. The upper pons and midbrain tegmentum are the main components of the ascending reticular activating system. Many neurodegenerative diseases, such as Parkinson disease and olivopontocerebellar atrophy, are associated with the pons. In addition, as a central axis structure, the pons can be easily damaged by brain trauma.13⇓⇓–16
Different brain structures have varying metabolite levels, which change with age.6⇓–8 To study pontine diseases, one must obtain MR spectroscopy reference data on normal metabolite levels in the pons, including data on how these levels vary with age. MR spectroscopy studies of the pons have been challenging because the structure is relatively small and surrounded by bones; this anatomy makes it difficult to acquire a homogeneous magnetic field.
Chemical shift imaging is a multivoxel MR spectroscopy technique that can be used to subdivide the spectral frequency information from a large MR spectroscopy volume into smaller MR spectroscopy volumes within the volume of interest and to obtain the average spectral frequency information within the VOI. A spectroscopic imaging technique called turbo spectroscopic imaging (TSI) applies fast spin-echo imaging to obtain chemical shift imaging data rapidly without the loss of spatial resolution, and it is less sensitive to susceptibility effects.9,10,17 In this study, we aimed to develop a proton MR spectroscopic data base of normal pons metabolite levels in vivo that could be used to study pontine lesions in the future. We applied TSI to measure metabolite levels in normal pontine tissues and to examine the variations of these levels with age.
Materials and Methods
Subjects
Seventy-eight healthy subjects, ranging from 5 days to 78 years of age, underwent TSI. Among these subjects, there were 45 males and 33 females. The subjects were divided into 4 groups by age: 0–5 (20 cases), 6–20 (15 cases), 21–50 (21 cases), and older than 50 years (22 cases). For statistical reasons, for subjects younger than 1 year of age, the age in months was divided by 12 and rounded. The inclusion criteria were subjects with no history of neurologic abnormalities and no abnormal findings on routine scans. Permission was granted by the institutional review board of Affiliated Zhongshan City Hospital of Sun Yat-sen University, and informed consent of all subjects or their parents was obtained.
MR Imaging and Data-Processing Methods
All subjects were scanned in a quiet state and were observed for any movement during the localizing and routine scans. A 1.5T MR imaging scanner (Intera; Philips Healthcare, Best, the Netherlands) equipped with a standard 8-channel head coil was used. Conventional transversal and sagittal T2-weighted images were obtained. The scan parameters for TSI were as follows: FOV, 230 × 180 mm; spatial resolution, 1 × 1 × 15 mm; sample, 256; reconstruction matrix, 24 × 24; sensitivity encoding acceleration factor, 2; TSI acceleration factor, 3; TR, 1600 ms; TE, 288 ms. The total TSI scan time was approximately 1 minute 20 seconds. For the scanning positioning methods, the conventional transversal and sagittal T2WI was used as the reference, and the TSI was positioned parallel to the frontal cranial fossa. The collected spectral data were transferred to a postprocessing workstation equipped with Achieva software, Version 2.6.3.5 (Philips Healthcare). The SpectroView software package was used for data processing, which involved selecting LongTeBrain_csi, laying out the VOI in the pons with its manual outlining function, and then selecting the “display average.” The average metabolite ratio value for each of the voxels in the VOI was then accessed (Fig 1).

Positioning of the pons TSI scan and spectrum data processing. A, T2-weighted images show the placement of volumes of interest in the pons. The left side is sagittal, and the right side is transversal. The TSI was positioned parallel to the frontal cranial fossa. Note that the box is the signal-generating area. B, The upper row of images shows the region-of-interest selection area, and the lower image shows the reconstructed average metabolite ratios of the region of interest.
Statistical Analysis
Data are presented as the mean ± SD for normal data and as the median/quartile for skewed data. For normally distributed data, 1-way analysis of variance was conducted among groups. For skewed data, the nonparametric rank sum test for 2 independent samples was applied. A difference with a P value < .05 was considered statistically significant. Scatterplots were graphed to observe changes in metabolite levels with age.
Results
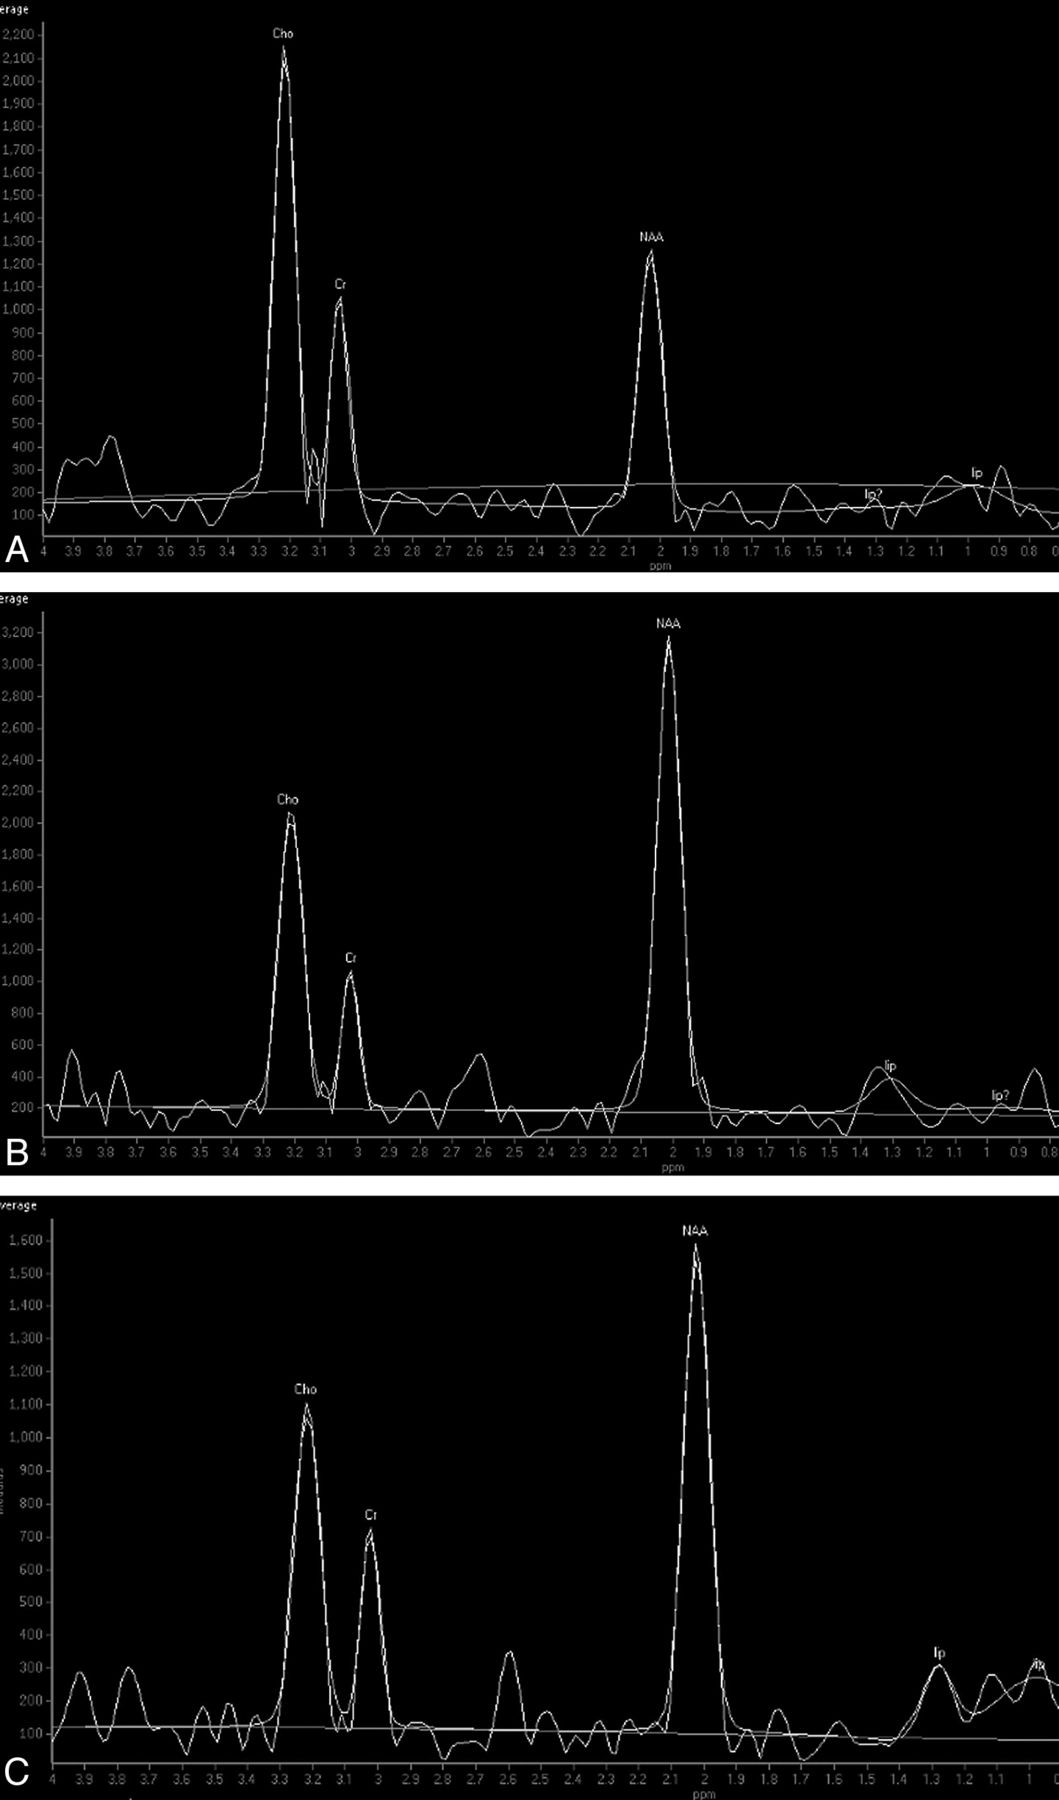
For the 78 cases, the mean pontine NAA/Cr was 2.44 ± 0.45. The mean choline-containing compounds/Cr in the pons was 1.93 ± 0.25, and the mean Cho/NAA was 0.83 ± 0.28. Figure 2 shows the pons MR spectroscopy results for the different age groups.

Proton MR spectrum of the pons in subjects of different ages. A, Spectrum of a 1-month-old baby's pons. B, Spectrum of a 5-year-old boy's pons. C, Spectrum of a 63-year-old man's pons. Note the relatively high Cho and low NAA levels in the baby. There is a higher NAA level and a lower Cho level in the 5-year-old child compared with the baby. The Cho level is lower in the 63-year-old man compared with the 5-year-old child.
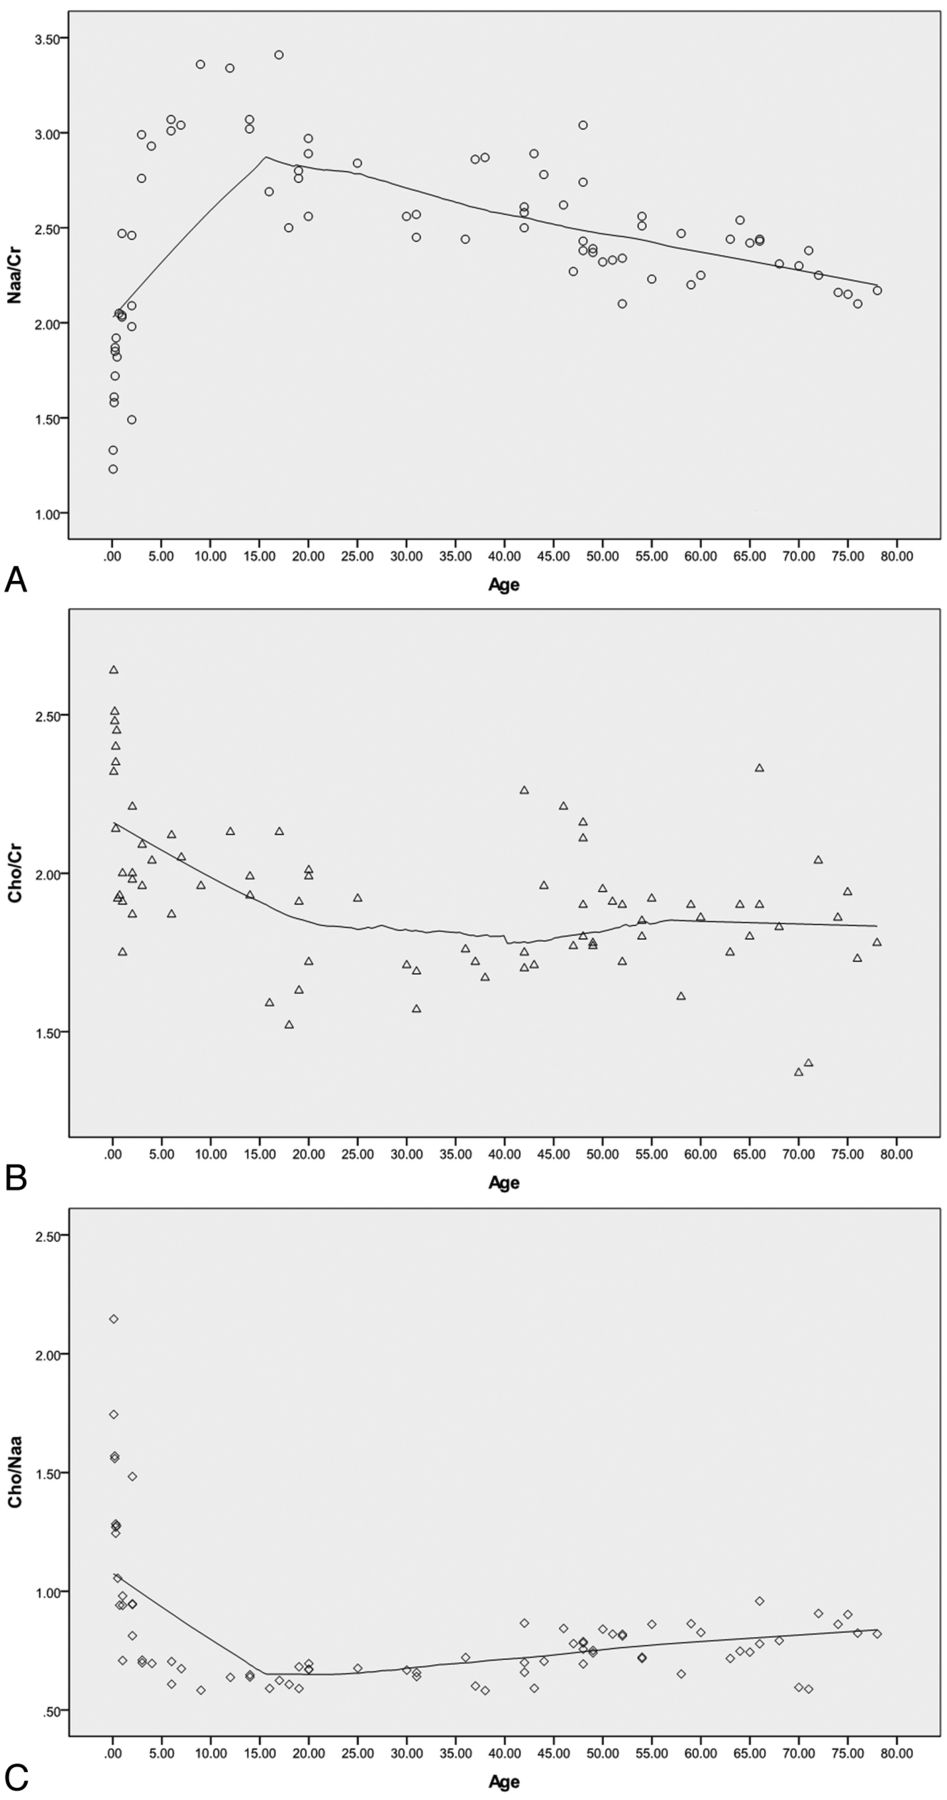
Curve fitting was performed on the NAA/Cr, Cho/Cr, and Cho/NAA scatterplots (Fig 3). The NAA/Cr at birth was low, it rose rapidly at 0–5 years, reaching a peak at approximately 10–20 years, and then it gradually decreased (Fig 3). The Cho/Cr decreased rapidly at 0–5 years, then continued to decline, and was stable after 20 years of age. The Cho/NAA decreased rapidly at 0–5 years, then continued to decline, and finally rose after 20 years of age.

Scatterplot showing the metabolite changes in the pons with age. A, The scatterplot shows that NAA/Cr was low at birth, rose rapidly at 0–5 years, reaching a peak at approximately 10–20 years, and then gradually decreased. B, The Cho/Cr decreased rapidly at 0–5 years, then continued to decline, and was stable after 20 years of age. C, The Cho/NAA decreased rapidly at 0–5 years, then continued to decline, and finally rose after 20 years of age. Note that the curve-fitting model used is locally weighted scatterplot smoothing (LOESS), and the percentage of fitting points is 50%.
The pontine NAA/Cr ratios were compared among the groups of 0–5, 6–20, 21–50, and older than 50 years as shown in Table 1. There was no statistically significant difference between the 0- to 5- and older than 50-year-old subjects. In contrast, there were statistically significant differences among the other age groups. Compared with the 0-to 5-year-old subjects, the NAA/Cr was higher in the 6- to 20-year-old subjects. In addition, the NAA/Cr of the older than 50-year group was lower than that in the 21- to 50-year group.
Comparison of NAA/Cr among different age groups
The Cho/Cr ratios of the groups were also compared as shown in Table 2. There were no statistically significant differences among the groups of 6–20, 21–50, and older than 50 years. There were statistically significant differences between the 0- to 5-year-old group and the other 3 age groups. Compared with the 0- to 5-year-old group, the Cho/Cr was lower in the groups 6–20, 21–50, and the older than 50 years. The Cho/Cr ratios were >1 in all groups.
Comparison of Cho/Cr among different age groups
The Cho/NAA ratios of the groups were compared as shown in Table 3. There were statistically significant differences among all the groups. Compared with the 0- to 5-year-old group, there was a decline in Cho/NAA in the 6- to 20-year-old group. There was a slow rise in Cho/NAA from 21–50 years to older than 50 years.
Comparison of Cho/NAA among different age groups
Discussion
To develop a proton MR spectroscopic data base of in vivo changes in pons metabolite levels during aging, we used the TSI technique to analyze 78 healthy subjects. These data on normal pontine metabolite levels may be applied in future studies of pontine lesions. The results showed that a short TSI scan time could be used to produce good reconstructed spectra for clinical analysis. Our results indicate that the NAA/Cr in the pons rose rapidly in the 0- to 5-year-old group, reached a peak in the 10- to 20-year-old group, and then gradually decreased. The Cho/Cr decreased rapidly in the 0- to 5-year-old group, then continued to decrease, and remained stable after 20 years of age. The Cho/NAA decreased rapidly in the 0- to 5-year-old group, followed by a decline in the 6- to 20-year-old group, then the ratio slowly rose after 20 years of age.
Currently, MR spectroscopy analysis of normal brain tissue has focused on the frontal, temporal, and occipital lobes, and there are few relevant data for the pons.6 This lack of data is due to obstacles to using MR spectroscopy on the pons. The posterior fossa is surrounded by skull base bones, and the pons itself is a relatively small organ. These anatomic features are disadvantages for MR spectroscopy because it requires a uniform magnetic field. The TSI technique used in this study provides a solution to the above problems. Unlike ordinary MR imaging techniques that use frequency and 1 phase direction for spatial encoding, chemical shift imaging usually uses 2 phase directions for spatial coding, which leads to a relatively longer acquisition time; faster acquisitions typically require the sacrifice of spatial resolution.10
Compared with a standard 2D point-resolved spectroscopic sequence, TSI uses an additional 180° pulse (like fast spin-echo) to obtain an additional phase-encoding data-acquisition window, thus reducing the acquisition time. Also like the FSE sequence, with its multiecho technique, TSI is less sensitive to B0 inhomogeneity. Moreover, TSI can be combined with sensitivity encoding to further shorten the scan time and be more insensitive to susceptibility effects.10,17 The major disadvantage of TSI is that it sacrifices spectral resolution because there is insufficient time between the 2 successive refocusing pulses to read the signal. However, by using TSI, 4.4-Hz spectral resolution can be obtained on a 1.5T system, which is sufficient to resolve NAA, Cr, Cho, and lactate spectra. However, for short TE metabolites such as glutamate and glutamine and myo-inositol, the signal rapidly decays with increasing TE, rendering the long echo spacing (at least 100 ms) of TSI impractical for their detection.9,10 In this study, the TSI scan time was reduced to approximately 1 minute 20 seconds, the baseline of the reconstructed spectrum was flat, the metabolite peaks were sharp, and the NAA, Cho, Cr spectra were well-resolved.
The levels of various metabolites in the pons vary with age as the human brain undergoes a maturation process. In a neonate's brain, the Cho level is at its highest, and the NAA level is at its minimum. NAA mainly exists in mature neuronal cells, and its levels rise with the development of the brain. Cho is the precursor to phosphatidylcholine, which is the main component of cell membranes. During brain development, the maturation of myelin and the synthesis of cell membranes cause rapid consumption of Cho, and its level declines.11,18,19 The decline of the Cho/Cr may also be related to the increase of Cr after birth, but Cr is mainly stable after the first year of life and can be used as an internal reference.18 In this study, the NAA levels increased rapidly in the 0- to 5-year-old group and the Cho levels declined rapidly, in support of the above viewpoint. The Cho/Cr value in the pons is relatively high (>1). The pons is characterized by a high attenuation of white matter because it contains many astrocytes and oligodendrocytes, which have a higher Cho content than neurons. This condition is similar to the higher Cho levels observed in the centrum semiovale compared with the cortex.12,20,21
A previous MR spectroscopy study on a healthy population of subjects 4–88 years of age showed that the NAA/Cho of the white matter in the centrum semiovale increased rapidly in the first decade of life, reached a maximum by the second-to-third decades of life, and then declined steadily.11 Although most maturation events in the human brain occur within the first few years of life, the brain is still establishing functional neuronal interconnections until puberty, and this maturation process is associated with significant alterations in the biochemical composition of the brain. As an example, the increase in the number of neuronal cells in the centrum semiovale reaches its peak by approximately 6 months after birth, but maturational changes continue to occur after infancy, with significant increases in the number and size of axonal and dendritic fluctuations.8,11 In this study, the NAA and Cho levels in the pons reached a relatively stable phase by 10–20 years of age, which may correspond to the full maturation of the pons. NAA/Cr continued to decline in the 21- to 50- and the older than 50-year-old groups. This change implies that NAA decreases gradually after puberty. There were few changes in the Cho/Cr among the groups of 6–20, 21–50, and older than 50 years, implying that Cho is relatively stable after puberty. This result is similar to that reported previously by Moreno-Torres et al.13 The reduction in the level of NAA may be due to diminished neuronal attenuation and/or neuronal loss in the aged brain and also a diminished concentration of NAA in neurons.21 With the exception of neurons, Cho is widely present in various types of cells, particularly glial cells, which undergo less dramatic changes with aging than neurons. The minimal changes in Cho levels after puberty may also be explained by the release of Cho compounds related to membrane breakdown during the aging process.13,21
There are some limitations of this study. First, the population sample enrolled in this study was relatively small, and more data should be collected in future studies to correct possible bias. However, the age range examined in this study was wide, with subjects from 0 to 78 years of age. In particular, we examined subjects during the first 5 years of life, which is a critical period for the developing brain, despite the difficulty in collecting data from children without sedation. Second, the regions of interest in TSI do not cover the whole pons. We attempted using 3D MR spectroscopy but the time required was not acceptable and the larger coverage to include the lower parts of the pons caused more difficulty in shimming. Therefore, we chose the region of interest covering as much of the pons as possible.
Conclusions
Our findings indicate that TSI is an appropriate method for detecting changes in metabolites in the pons. We observed significant alterations in NAA/Cr and Cho/Cr in the pons in the 0- to 5-year-old group and noted that these ratios reached a plateau by 20 years of age, which may correspond to the maturation of the pons. After 20 years of age, the NAA/Cr decreased slowly and the Cho/Cr was relatively stable. These data may serve as a basis for studies of normal human neurochemistry and studies of metabolic alterations in diseases of the pons.
References
- Received April 20, 2014.
- Accepted after revision May 11, 2014.
- © 2014 by American Journal of Neuroradiology


Jump to section
Related Articles
Cited By...
- No citing articles found.