
Abstract
BACKGROUND AND PURPOSE: Systematic investigations of the distinguishing imaging features between spinal hyperplastic hematopoietic bone marrow and bone metastasis have not been reported, to our knowledge. The purpose of this study was to determine the distinguishing imaging features of the 2 entities.
MATERIALS AND METHODS: We retrospectively reviewed the radiologic images of 8 consecutive male patients (age range, 52–78 years; mean, 64 years) with suspected spinal metastasis on MR imaging and FDG-PET, which was later confirmed as hyperplastic hematopoietic bone marrow. MR imaging, FDG-PET, CT, and bone scintigraphy images were qualitatively and/or quantitatively evaluated. Imaging findings in 24 patients with spinal metastasis were compared, and differences were statistically analyzed.
RESULTS: All 8 vertebral hyperplastic hematopoietic bone marrow lesions were hypointense on T1- and T2-weighted images; lesions contiguous with the adjacent vertebra were significantly more often seen in hyperplastic hematopoietic bone marrow than in metastasis (P = .035). T2 signal intensity of the lesion was significantly different between the 2 entities (P = .033). FDG-PET showed slightly higher uptake in all hyperplastic hematopoietic bone marrow lesions; their maximum standard uptake value was significantly lower than that of metastatic lesions (P = .037). CT attenuation of hyperplastic hematopoietic bone marrow was equal to or slightly higher than that of adjacent normal-appearing vertebra; the CT appearances of hyperplastic hematopoietic bone marrow and metastasis were significantly different (P < .01). Bone scintigraphy showed normal uptake for all vertebrae with hyperplastic hematopoietic bone marrow; the uptake was significantly different from that of metastasis (P < .01).
CONCLUSIONS: If a lesion was isointense to hyperintense to normal-appearing marrow on MR imaging or had a maximum standard uptake value of >3.6, the lesion was considered metastatic. A normal appearance on CT or bone scintigraphy excluded metastasis.
ABBREVIATIONS:
- HHBM
- hyperplastic hematopoietic bone marrow
- 99mTc-MDP
- technetium Tc99m methylene diphosphonate
- SUVmax
- maximum standard uptake value
Among oncologic diagnostic modalities, FDG-PET and FDG-PET/CT are used increasingly for the staging of malignancies.1 FDG-PET/CT is highly sensitive and specific for the detection of bone metastasis.2 MR imaging is also highly sensitive for detecting bone metastasis and is widely used for determining the presence of bone lesions.3 Meta-analysis showed that FDG-PET and MR imaging are significantly more accurate than CT and bone scintigraphy for the diagnosis of bone metastasis.4
Hyperplastic hematopoietic bone marrow (HHBM) is a proliferation (hyperplasia) of hematopoietic cells in response to increased peripheral demand or hypofunction of blood cells. One or multiple cell lines (eg, erythroid, megakaryocytic, myeloid cells) may be hyperplastic, depending on the stimulus. In adults, it is identified by the reconversion from fatty yellow to red marrow.5 Conditions that may lead to such reconversion include heavy smoking, long-distance running, obesity, chronic anemia, and the use of hematopoietic growth factors.5⇓⇓⇓–9 Spinal HHBM mimicking bone metastasis on FDG-PET and MR imaging scans significantly affects patient management.10 We encountered several patients with spinal HHBM in whom both FDG-PET and MR imaging revealed abnormalities and CT-guided biopsy was required for pathologic confirmation. Although the discrimination of spinal HHBM and bone metastasis is clinically important, no systematic investigations of the distinguishing imaging features of the 2 entities have been reported, to our knowledge. The purpose of this study was to determine the features of PET, MR imaging, bone scintigraphy, and CT for differentiating spinal HHBM and bone metastasis.
Materials and Methods
Patients
Our institutional review board approved this retrospective study and waived patient informed consent. Between August 2006 and January 2012, we encountered 8 patients with spinal HHBM pathologically diagnosed after CT-guided spinal bone biopsy (Table 1). All patients were men, ranging in age from 52 to 78 years (mean, 64.1 years). Six had known malignancies (esophageal squamous cell carcinoma, n = 4; pulmonary squamous cell carcinoma, n = 1; pulmonary adenocarcinoma, n = 1); none reported back pain. The other 2 patients had low back pain; their lumbar MR imaging scans revealed spinal vertebral lesions mimicking bone metastasis. Subsequent FDG-PET/CT studies failed to rule out a neoplastic condition. Seven patients had moderate anemia and a Brinkman index, which is defined as the number of cigarettes smoked per day times smoking years, of >600. All 8 patients were referred for CT-guided biopsy of the spinal lesions detected on both FDG-PET/CT and MR imaging. The CT-guided vertebral bone biopsy was performed for a vertebra that showed the highest uptake on FDG-PET. Five patients had undergone bone scintigraphy by using technetium Tc99m methylene diphosphonate (99mTc-MDP), and none had received granulocyte colony-stimulating factors or anticancer drugs. For all 8 patients, at least 6-month follow-up medical records showed no symptoms suggesting spinal bone metastasis.
Summary of characteristics of patients with spinal HHBM
During the same period, 26 patients diagnosed with spinal bone metastasis based on CT-guided bone biopsy findings were included in this study. Two were undergoing chemotherapy and were excluded from this study. Therefore, 24 patients (14 men and 10 women) ranging in age from 30 to 84 years (mean, 65.4 years) with biopsy-proved spinal bone metastases were included. Their primary malignant tumors were lung cancer (n = 4), hepatocellular carcinoma (n = 4), malignant lymphoma (n = 4), leiomyosarcoma (n = 2), renal cell carcinoma (n = 2); and prostatic (n = 2), uterine- (n = 1), gall bladder- (n = 1), urinary bladder (n = 1), gastric (n = 1), and breast (n = 1) cancer and primary unknown adenocarcinoma (n = 1). All 24 underwent CT, 21 underwent MR imaging studies, 12 underwent FDG-PET, and 13 underwent bone scintigraphy. In each patient, the imaging studies were performed within 1 week of each other as a rule.
MR Imaging, FDG-PET, CT, and Bone Scintigraphy
All MR imaging studies were performed on 1 of 2 MR imaging units (Achieva; Philips Healthcare, Best, the Netherlands; or Magnetom Trio; Siemens, Erlangen, Germany) by using spine coils at 3T. The spinal MR imaging protocol included 3-mm-section sagittal and 4-mm-section axial T1- and T2-weighted spin-echo sequences. When possible, STIR diffusion-weighted and postcontrast T1-weighted imaging studies were performed. In patients who underwent diffusion-weighted imaging, we calculated the apparent diffusion coefficient values of the lesion. In patients who had undergone FDG-PET, we acquired spinal MR imaging scans to cover the entire spine with areas of abnormal uptake. For postcontrast T1-weighted imaging, we intravenously administered 0.1-mL gadopentetate dimeglumine (Magnevist; Bayer-Schering, Berlin, Germany) per kilogram of body weight.
In whole-body FDG-PET/CT, data were acquired with a dedicated combined FDG-PET/CT system (Gemini GXL; Philips Healthcare). Patients fasted for 6 hours before scanning; the blood glucose levels were <150 mg/dL in all patients. An hour before imaging, 185–222 mBq of 18F-FDG (4 millibecquerel per kilogram of body weight) were injected intravenously. Whole-body images covering the skull base to the midthigh level were acquired with the patient in a supine position. Before PET, we obtained unenhanced CT images on an integrated 16-section scanner (tube voltage, 120 kV[peak]; tube current, 80 mA; rotation time, 0.5 seconds; pitch, 0.938; collimation, 16 × 1.5 mm). Then we performed whole-body PET emission scanning. The PET images were reconstructed by using the CT images for attenuation correction. Axial, coronal, and sagittal multiplanar images of the spine were reconstructed.
CT studies were performed without contrast material administration on a 64–detector row CT system (Brilliance 64; Philips Healthcare) with a 0.5-second gantry rotation speed, an x-ray tube voltage of 120 kV, and an x-ray tube current of 300 mA. The collimation was 64 × 0.625 mm, the beam pitch was 0.515, and the table speed was 20.6 mm per rotation. The helical data were reconstructed in the axial plane with a 0.5-mm section thickness at 0.3-mm intervals before storage and transfer to a workstation (M900QUADRA; Amin, Tokyo, Japan). The multiplanar reformation images, including coronal and sagittal images, were reconstructed at a voxel size of 0.4 × 0.4 × 0.7 mm.
For bone scintigraphy, double-head γ camera detectors (Skylight; ADAC Laboratories, Milpitas, California) equipped with a low-energy, general purpose, parallel-hole collimator were used. After the IV injection of 555 mBq (15 mCi) of 99mTc-MDP 3–4 hours earlier, we obtained whole-body images at a scan speed of 12 cm/min in the anterior and posterior projections. Additional static planar images were acquired at the discretion of the attending nuclear physician.
Image Analysis
All image assessments and measurements were performed on a PACS workstation. PET/CT images were independently evaluated by 2 nuclear medicine physicians (S.S. and M.Y., with 15 and 6 years of nuclear medicine experience, respectively) who were blinded to the final diagnosis. Divergent evaluations were reviewed to reach consensus. The PET and MR imaging scans were carefully compared for accurate anatomic identification of the lesions. For quantitative analysis, a circular region of interest was placed over the biopsy-proved vertebral bone lesion on the PET images. The maximum standardized uptake value (SUVmax) of vertebral lesions with the greatest uptake was recorded from a 1-cm2 region of interest in the center of the lesion; SUVmax in each region of interest was calculated automatically.
Bone scintigraphy images were interpreted independently by the same 2 readers blinded to the final diagnosis. They reviewed divergent evaluations to reach consensus. The lesional uptake was qualitatively graded as high, equivalent, or low with respect to adjacent normal-appearing vertebrae. High or low uptake was considered abnormal.
On MR imaging, 2 neuroradiologists (T.H. and Y.S., with 22 and 19 years of neuro-MR imaging experience, respectively) blinded to the final diagnosis independently compared the signal intensity of biopsy-proved spinal vertebral body lesions with adjacent normal-appearing spinal vertebrae and graded it as hypo-, iso-, or hyperintense. The distribution pattern of a main lesion in a single vertebra was also recorded as diffuse, patchy, or nodular (Fig 1A). The vertebral lesions were classified as homogeneous or heterogeneous on the basis of MR imaging findings (Fig 1B). Lesions were considered homogeneous if no evidence of necrosis, cyst, hemorrhage, or fracture was seen on T1- and T2-weighted images. If ≥1 of these features or mixed signal intensity (ie, high and low signal intensity) on the MR images was present, the vertebral lesion was considered heterogeneous. The readers also assessed the location of other spinal vertebral lesions with the same signal intensity as the biopsy-proved spinal HHBM.

A, Schema of the distribution pattern of a lesion in a single vertebral body. “Diffuse pattern” indicates involvement of the entire region in a single vertebral body; “patchy pattern,” involvement of the partial region in a single vertebral body; and “nodular pattern,” involvement of the nodular area in a single vertebral body. B, Schema of the appearance of homogeneity of a lesion in a single vertebral body. Lesions were considered homogeneous if no evidence of necrosis, cyst, hemorrhage, or fracture was seen on T1- and T2-weighted images. If ≥1 of these features or mixed signal intensity (ie, high and low signal intensity on the MR images) was present, the vertebral lesion was considered heterogeneous.
The same neuroradiologists also independently rated the CT appearance of each vertebral body lesion by using a 4-point grading system: grade 1 = normal appearance with normal or subtle high attenuation, grade 2 = osteolytic lesions, grade 3 = osteoblastic lesions, and grade 4 = mixed osteolytic and osteoblastic lesions. When grade 2, 3, or 4 vertebral lesions were observed, their appearance was graded as abnormal. When the grades assigned by the 2 readers were different, the final grade was determined by consensus. For the quantitative assessment of CT attenuation, 1 neuroradiologist (Y.S., 19 years of neuro-CT experience) placed a 1-cm2 region of interest in the lesion center and on an adjacent normal-appearing vertebral body by referring to the corresponding MR images.
Statistical Analysis
To compare findings in patients with HHBM and bone metastasis, we used the Mann-Whitney and Fisher exact tests. Differences in the CT attenuation between HHBM lesions and adjacent normal-appearing vertebrae were analyzed with the Wilcoxon signed rank test. A P value < .05 was considered statistically significant.
Results
MR Imaging Findings
HHBM.
HHBM was more likely to be seen in the thoracic region (Table 1). In 7 of 8 patients with vertebral HHBM, the lesions were contiguous with the adjacent vertebral body (Fig 2 and Table 1). The other patient had a diffuse lesion in only 1 vertebra. The HHBM lesions were hypointense compared with adjacent normal-appearing vertebrae on both T1- and T2-weighted images in all 8 patients (Fig 2 and Table 2). The vertebral HHBM distribution pattern was diffuse in 5 patients, patchy in 2, and nodular in 1. The HHBM lesion in all patients had a homogeneous appearance. On STIR sequences acquired in 4 patients, the signal intensity was slightly hyperintense in 3 and isointense in 1 (Fig 2). In 2 patients, we performed contrast-enhanced studies; in both, the HHBM lesions were slightly more enhanced than the normal-appearing adjacent vertebral bone marrow. Two patients underwent diffusion-weighted imaging; in both, the lesions were hyperintense and their ADC values were 0.56 and 0.47 × 10⁻³mm2/s, respectively (Fig 2). The ADC values in normal-appearing vertebrae of the same patients were 0.78 and 0.57 × 10⁻³mm2/s, respectively.

A 54-year-old man with biopsy-proved hyperplastic hematopoietic bone marrow in the T11 vertebral body. Coronal (A) and sagittal (B) reconstructed FDG-PET/CT images reveal the highest uptake (large arrow) in the T11 vertebral body. The SUVmax of the vertebra was 2.4. Subtle uptake is also seen in some thoracic and lumbar vertebral bodies (small arrows). Primary lung cancer is demonstrated in the left lower lung (arrowhead in A). Sagittal T1- (C) and T2-weighted (D) spin-echo MR images of the thoracolumbar spine show diffuse hypointensity (large arrow) in the T11 vertebral body. Patchy hypointense areas are seen in some thoracic and lumbar vertebral bodies (arrowheads). E, Sagittal STIR image of the thoracolumbar spine depicts slight hyperintensity (arrow) in the vertebrae from T10 to L3. F, Sagittal diffusion-weighted image of the thoracolumbar spine reveals marked hyperintense areas (arrowheads) in the vertebrae from T10 to L3. G, The ADC map shows restricted diffusion (arrowheads), corresponding to the hyperintense areas in the vertebrae on diffusion-weighted images. The ADC value in the T11 vertebral body was 0.56 × 10⁻³mm2/s. H, On the sagittal reconstructed CT image of the thoracolumbar spine, there is diffuse, slightly high attenuation in the T11 vertebral body (large arrow). I, Posterior bone scintigraphy shows no apparent uptake in the thoracolumbar spine.
Summary of visual assessments of vertebral lesions on MRIa
Bone Metastasis.
The 21 vertebral lesions in 21 patients were pathologically confirmed as spinal bone metastasis and were hypointense on T1-weighted images (Fig 3). In 13 of 21 patients with bone metastasis, the lesions were contiguous with the adjacent vertebral body. Lesions contiguous with the adjacent vertebral body were present significantly more often in HHBM than in bone metastasis (P = .035). On T2-weighted images, 12 lesions were hypointense, 6 were isointense, and 3 were hyperintense (Fig 3). When the signal intensity was divided into 2 categories (hypointensity versus iso- to hyperintensity), there was no significant difference in the T1 signal intensity of the lesions between patients with HHBM and those with bone metastasis (Table 2). On the other hand, there was a significant difference in the T2 signal intensity of the lesion between the 2 groups (P = .033, Table 2). The lesional distribution pattern was diffuse in 20 patients and nodular in 1; 15 lesions had a homogeneous and 6 a heterogeneous appearance. There was no significant difference in the distribution pattern and appearance of the lesions between patients with HHBM and those with bone metastasis (Table 2).

An 84-year-old man with lung cancer and biopsy-proved metastatic bone tumor in the L3 vertebral body. Sagittal T1- (A) and T2-weighted (B) spin-echo MR images of the lumbar spine show diffuse hypointensity (arrow) in the L3 vertebra. There are no vertebral lesions adjacent to the L3 lesion. C, Sagittal STIR image of the lumbar spine depicts hyperintensity (arrow) in the same vertebra. D, On the axial CT image at the level of the L3 lumbar vertebra, there is an osteolytic area in the vertebral body (arrow). E, Axial FDG-PET/CT image at the level of the L3 lumbar vertebra reveals a high uptake area in the vertebral body (arrow). SUVmax of the vertebral lesion was 12.4.
FDG-PET Findings
HHBM.
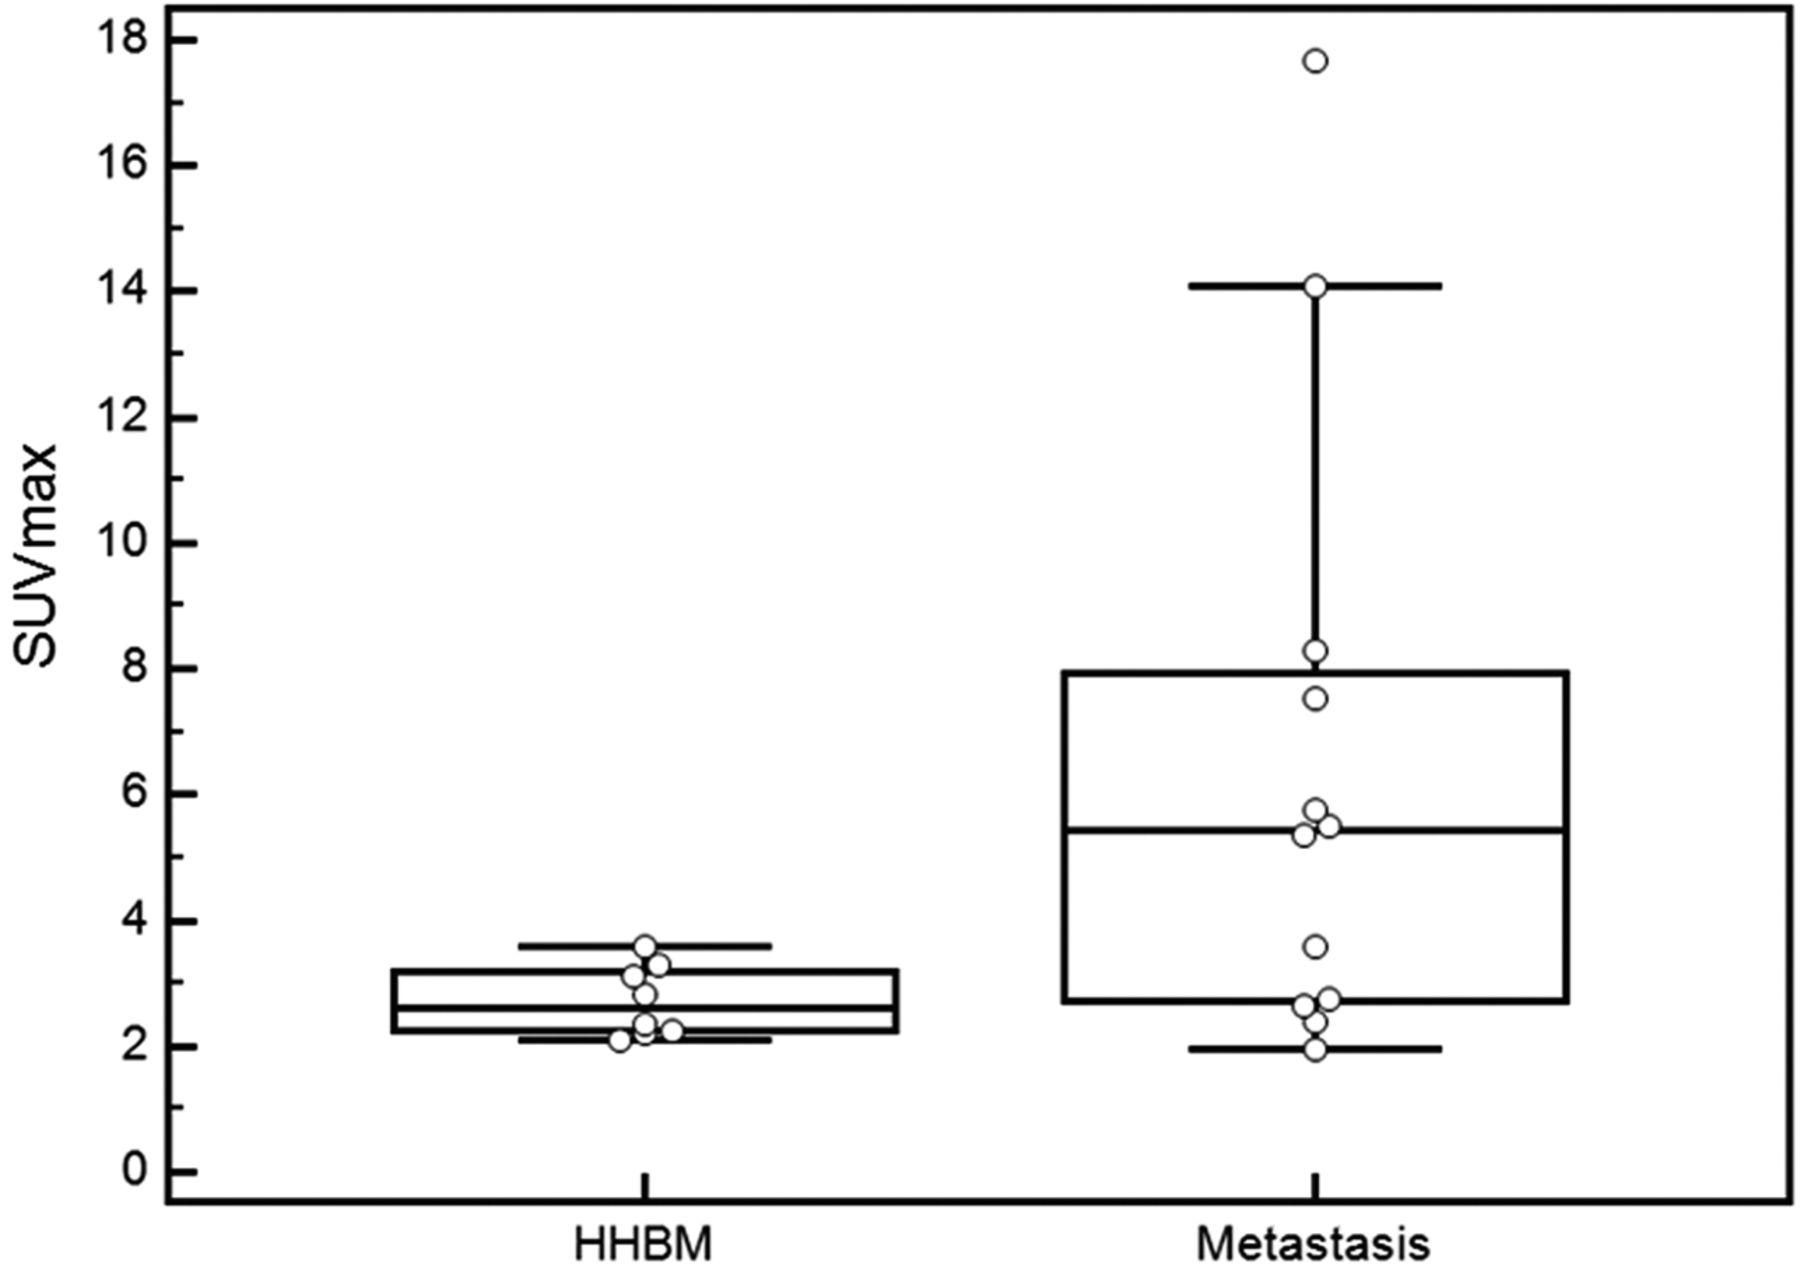
In all 8 patients with pathologically confirmed HHBM, the vertebral lesions showed a relatively high uptake compared with adjacent normal-appearing vertebrae (Fig 2). The mean SUVmax of biopsy-proved HHBM was 2.72 ± 0.57; it ranged from 2.09 to 3.6 (Figs 2 and 4).

Comparison of SUVmax between HHBM and bone metastasis. The SUVmax of the biopsy-proved vertebral lesions is shown. A significant difference is seen between HHBM and bone metastasis (Mann-Whitney test, P = .037). The horizontal short lines indicate 95% CI for the median.
Bone Metastasis.
In 12 patients, FDG-PET studies were performed before biopsy. The mean SUVmax of the biopsy-proved spinal bone metastases was 6.46 ± 4.90 (range, 1.97–17.67) (Figs 3 and 4). There was a statistically significant difference in the SUVmax between patients with HHBM and those with bone metastasis (P = .037, Fig 4).
CT Findings
HHBM.
In all 8 patients with HHBM, the affected vertebrae were ranked grade 1 (subtle high attenuation, n = 7; normal, n = 1) (Fig 2 and Table 3). Their mean CT attenuation was 189.8 ± 49.0 HU, significantly higher than that of adjacent normal-appearing vertebrae (93.7 ± 37.0 HU, P = .0078) (Fig 5).
Summary of visual inspections of vertebral lesions on CTa

Comparison of CT attenuation between HHBM and normal-appearing bone marrow. The mean CT attenuation of HHBM was significantly higher than that of adjacent normal-appearing vertebrae (Wilcoxon signed rank test, P = .0078). The horizontal short lines indicate 95% CI for the median.
Bone Metastasis.
Of the 24 vertebral lesions pathologically proved as spinal bone metastasis, 17 were ranked as osteolytic (grade 2), and 5, as osteoblastic (grade 3) (Fig 3). The other 2 were grades 1 and 4. With regard to the CT appearance of normal (grade 1) and abnormal (grades 2–4) patterns, HHBM and metastasis differed significantly (P < .01, Table 3).
Bone Scintigraphy Findings
HHBM.
Of the 8 patients with HHBM, 5 had undergone bone scintigraphy before bone biopsy (Table 4). The uptake was equivalent in the 5 HHBM lesions and the adjacent normal-appearing vertebrae (Fig 2).
Summary of visual inspections for abnormal uptake on bone scintigraphy
Bone Metastasis.
In 13 of the 24 patients with bone metastasis, bone scintigraphy was performed before biopsy. The uptake was higher in all 13 lesions than in the adjacent normal-appearing vertebrae. Qualitative uptake assessment yielded significantly different results for HHBM and bone metastasis (P < .01, Table 4).
Discussion
Spinal HHBM lesions with abnormalities on both FDG-PET and MR imaging are clinically problematic, especially at the staging of malignant neoplasms, because the diagnosis affects patient management. Therefore, an understanding of the typical imaging findings of HHBM is important. To our knowledge, we are the first to report the characteristic findings of HHBM on systematic studies of MR imaging, FDG-PET, CT, and bone scintigraphy.
MR imaging findings on HHBM have been documented.5⇓⇓⇓⇓–10 Typically, the MR imaging signal of HHBM is compatible with that of normal red marrow—that is, there is a moderate-to-marked decrease in signal intensity on T1- and T2-weighted spin-echo images and an intermediate-to-moderate increase in signal intensity on fat-saturated T2-weighted images.5 Although STIR findings have not been described, they can be expected to be similar to those on fat-saturated T2-weighted images. In all of our patients with HHBM, the signal intensity was similar to that in earlier reports. Our results indicate that HHBM and bone metastasis significantly differ on T2 signal intensity. On T2-weighted images, in 9 (43%) of 21 patients with cancer, we were able to differentiate HHBM and bone metastasis. Thus, the T2 signal intensity of the lesion would be useful for differentiating the 2 entities. Although HHBM and bone metastasis did not significantly differ in the lesional distribution pattern and appearance in a single vertebra, a heterogeneous vertebral lesion was seen in only 6 (29%) of 21 patients with cancer.
Under normal conditions, red marrow is generally distributed in a homogeneous pattern within the vertebral body. Occasionally, red marrow can be more cellular near the vertebral endplate and in the anterior aspect of the vertebral bodies on MR imaging.11 Then, fatty marrow can become prominent around the vertebral basilar veins on MR imaging.11 As a rule, these variations in the MR imaging appearance should involve all vertebral bodies of the same subject in a similar manner. In spinal HHBM, on the other hand, we found that the distribution pattern of vertebral HHBM was diffuse, patchy, or nodular and that the HHBM lesions often involved adjacent vertebrae. The same MR imaging appearance of adjacent vertebral bodies may be a feature of spinal vertebral HHBM, though this can also be seen in metastatic spinal tumors.
As did others,5,12 we found that areas involved by HHBM may be contrast-enhanced. This makes it difficult to distinguish HHBM and metastatic bone lesions. We found no earlier reports on the appearance of HHBM on diffusion-weighted images. Our study revealed that spinal HHBM lesions manifested restricted diffusion, but this result was derived from only 2 patients. Some metastatic spinal tumors may show restricted diffusion on diffusion-weighted images.13 In our study, patients with bone metastasis did not undergo diffusion-weighted imaging. Therefore, the usefulness of diffusion-weighted imaging for discriminating bone metastasis is not understood. Further studies by using large population data are required to clarify this issue.
In our patients with HHBM, the qualitative assessment of FDG-PET scans showed a relatively high uptake by HHBM lesions compared with adjacent normal-appearing vertebrae. Our quantitative study demonstrated that mean SUVmax for HHBM was significantly lower than that for vertebral metastasis. Although a relatively high uptake by HHBM on FDG-PET scans has been described in some case studies,11,14 to our knowledge, there are no reports on the SUVmax of HHBM. Our results indicate that quantitative assessment by using SUVmax is useful for differentiating HHBM and bone metastasis. If the SUVmax of a vertebral lesion exceeds 3.6, the possibility of HHBM appears to be low (Fig 4).
Our quantitative analysis of CT showed that CT attenuation of HHBM was significantly higher than that of normal bone marrow. We also found that the CT appearance of HHBM was significantly different from that of bone metastasis. To our knowledge, such findings have not been reported elsewhere. We suggest that this observation is important for the CT diagnosis of HHBM; osteolytic, osteoblastic, or mixed lesions should not be misdiagnosed as HHBM (Fig 5).
On bone scintigraphs, we observed no abnormal uptake in areas involved in HHBM. Because there was a significant difference in the uptake between HHBM and bone metastasis, bone scintigraphy can be useful for a differential diagnosis. Because the uptake of 99mTc-MDP mainly reflects osteoblastic activity, it is surprising that HHBM with slightly higher attenuation on CT images did not show a high uptake on bone scintigraphs. The slightly higher attenuation of HHBM on CT may be due to high cellularity in the vertebrae. This theory is compatible with diffusion restriction of HHBM in our study.
Our study has some limitations. First, it was retrospective, the number of consecutive patients with HHBM was small, and all were men. Because heavy smoking and chronic anemia can lead to HHBM,5⇓⇓⇓–9 their history of smoking and anemia may have affected the etiology of HHBM in our patients. Second, we did not use other imaging techniques for differentiating HHBM from bone metastasis, such as MR imaging with in-phase and opposed-phase techniques15 or contrast-enhanced MR imaging by using iron oxide.16 Third, the tumor type of bone metastasis may have affected our results. It is well-known that lymphoma often shows little abnormality on bone scintigraphy and CT. We included only 4 cases with lymphoma in this study. Because lymphomas usually indicate high SUVmax,17 FDG-PET may be useful for differentiating HHBM from lymphoma.
Fourth, we did not perform CT-guided biopsy for all vertebral lesions indicating abnormal signal or uptake on MR imaging and FDG-PET. In each case, only 1 vertebral bone biopsy was performed for a vertebra that showed the highest uptake at FDG-PET. Due to the invasiveness of CT-guided biopsy, our approach is considered a reasonable strategy for evaluating the vertebral lesions. In our institution, no patients have been misdiagnosed by using this CT-guided biopsy approach for vertebral lesions.
Conclusions
We found that if a lesion was isointense to hyperintense to normal-appearing marrow in other vertebral bodies on MR imaging or had a SUVmax of >3.6, it was considered metastatic (Fig 6). If not, then a normal appearance on CT or bone scintigraphy excluded metastasis (Fig 6). HHBM was more likely to be seen in asymptomatic patients and in the thoracic spine; contiguous lesions with the adjacent vertebral body were more often seen in HHBM than in bone metastasis. Bone biopsy might still be needed in indeterminate cases. To put our findings to the absolute test, a prospective study is required in the future.

A proposed diagnostic scheme to be followed by practitioners/radiologists when faced with the problem of differentiating HHBM from bone metastasis. Asterisk indicates that bone biopsy might be still needed in indeterminate cases.
REFERENCES
- Received December 23, 2013.
- Accepted after revision February 18, 2014.
- © 2014 by American Journal of Neuroradiology


