
Abstract
BACKGROUND AND PURPOSE: Cavernous sinuses and draining dural sinuses or veins are often visualized on 3D TOF MRA images in patients with dural arteriovenous fistulas involving the CS. Flow signals may be seen in the jugular vein and dural sinuses at the skull base on MRA images in healthy participants, however, because of reverse flow. Our purpose was to investigate the prevalence of flow signals in the pterygoid plexus and CS on 3T MRA images in a cohort of participants without DAVFs.
MATERIALS AND METHODS: Two radiologists evaluated the flow signals of the PP and CS on 3T MRA images obtained from 406 consecutive participants by using a 5-point scale. In addition, the findings on 3T MRA images were compared with those on digital subtraction angiography images in an additional 171 participants who underwent both examinations.
RESULTS: The radiologists identified 110 participants (27.1%; 108 left, 10 right, 8 bilateral) with evidence of flow signals in the PP alone (n = 67) or in both the PP and CS (n = 43). Flow signals were significantly more common in the left PP than in the right PP. In 171 patients who underwent both MRA and DSA, the MRA images showed flow signals in the PP with or without CS in 60 patients; no DAVFs were identified on DSA in any of these patients.
CONCLUSIONS: Flow signals are frequently seen in the left PP on 3T MRA images in healthy participants. This finding may be the result of flow reversal and should not be considered to indicate occult DAVF.
ABBREVIATIONS:
- CS
- cavernous sinus
- DAVF
- dural arteriovenous fistula
- EV
- emissary vein
- IPS
- inferior petrosal sinus
- PP
- pterygoid plexus
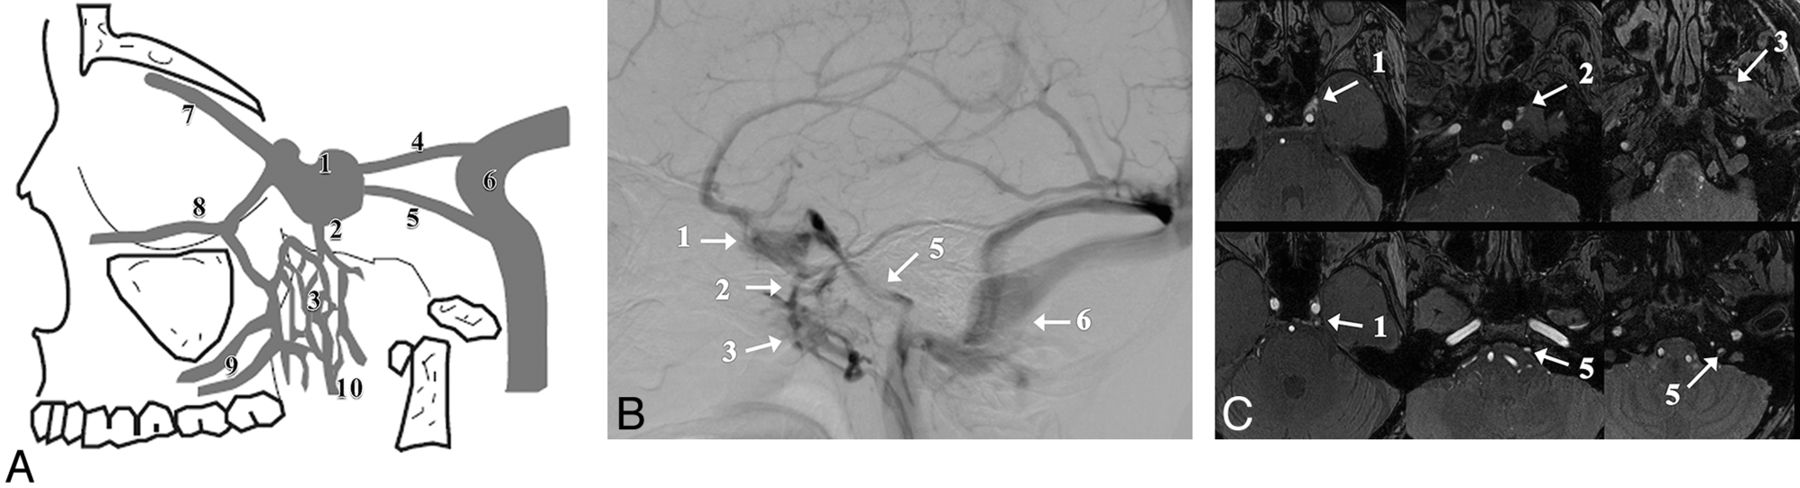
The cavernous sinus is a paired venous structure. Its anterior part receives the superior and inferior ophthalmic veins, the superficial middle cerebral vein, and the sphenoparietal sinus. Posteriorly, the CS drains into the inferior petrosal sinus and then into the internal jugular vein. The CS also has an anastomosis with the pterygoid plexus by way of the sphenoid emissary veins (Fig 1).1

Drainage pathways of the CS. Schematic representation (A), DSA (B), and MRA source image (C). The numbers represent the major anatomic structures analyzed in this study. These are 1, cavernous sinus; 2, emissary vein; 3, pterygoid plexus; 4, superior petrosal sinus; 5, inferior petrosal sinus; 6, sigmoid sinus; 7, superior ophthalmic vein; 8, inferior ophthalmic vein; 9, deep facial vein; and 10, retromandibular vein.
3D time-of-flight MR angiography is a noninvasive imaging technique that is widely accepted as a first-line diagnostic tool in the MR examination of numerous cerebrovascular diseases. Multiple studies2⇓⇓–5 have been published concerning the role of MRA in demonstrating abnormal venous flow in dural arteriovenous fistulas at the CS. Cornelius6 summarized the MRA characteristics of DAVFs at the CS, which commonly include visualizing venous structures such as the CS, IPS, superior petrosal sinus, PP, Sylvian veins, superior ophthalmic vein, and sphenoparietal sinus. During our routine clinical work, we observed that flow signals are often seen in the PP and EV, IPS, and CS on routine 3T MRA images. Although Paksoy et al7 have reported that visualization of CS and IPS flow signals occurring from reverse flow are visible in patients without DAVFs on 1.5T MRA images, the appearance of PP or EV was not specifically evaluated. Furthermore, visualization of IPS and CS flow signals has not been evaluated with 3T MRA images. As 3T TOF MRA offers potential advantages compared with 1.5T TOF MRA, including higher spatial resolutions and increased T1 relaxation times,8 3T MRA is expected to increase vessel-tissue contrast, including reverse flows.
The purpose of this study was to investigate the prevalence of flow signals in the PP/EV, IPS, and CS on 3T MRA images in a cohort of participants without clinical signs or symptoms of DAVF at the CS. In addition, the findings of 3T MRA were compared with those of digital subtraction angiography in a subgroup of patients to confirm that the flow signals were not attributed to DAVF at the CS.
Materials and Methods
Patient Selection
This retrospective study was approved by the institutional review board. Informed consent was not required.
A computerized search of the radiology data base (MR imaging files) at this university hospital for a 4-month period from August 2009 through November 2009 revealed data for 492 patients who underwent 3T brain MRA. When multiple MRA studies were available, the MRA images obtained at the latest examination were used for the analysis. A total of 86 patients were excluded on the basis of the following criteria: large territory infarction (n = 17), dural arteriovenous fistula (n = 9), venous thrombosis (n = 4), craniotomy (n = 32), and poor image quality (n = 24). Of the 9 patients with dural arteriovenous fistula, the fistulas were located in the transverse-sigmoid sinus in 4 patients, the cavernous sinus in 3 patients, and the craniocervical junction in 2 patients. Patients with chronic small infarctions (small cerebellar infarctions or lacunar infarcts) and small punctate hemorrhages (microbleeds) were not excluded. A total of 406 patients were evaluated (Table 1). The 406 patients included 195 men and 211 women. The mean age for the study group was 62.8 years (interquartile range, 53.0–75.0 years).
Patient characteristics
Next, to identify participants with both 3T MRA and DSA images, we performed a computerized search of the radiology data base (DSA files) at this university hospital for a 5-year period from July 2007 through July 2012 to find patients who underwent bilateral common carotid or internal carotid studies. This cohort of 241 patients was used to further select patients who 1) had no history of lesions with arteriovenous shunting, such as vascular malformations; and 2) who underwent brain 3D MRA with a 3T MR system before or within 1 month after DSA. A total of 171 participants (82 men and 89 women) fulfilled these criteria. The mean age for the study group was 59.5 years (interquartile range, 51.75–71.0 years). The specific diagnoses made according to the DSA images were as follows: aneurysm in 59 patients, intra-axial tumor in 47 patients, extra-axial tumor in 26 patients, cerebral artery or carotid artery stenosis in 18 patients, vertebral arterial dissection in 3 patients, and normal findings in 18 patients.
Image Acquisition
All MR imaging studies were performed with a 3T MR system (Signa Excite; GE Healthcare, Milwaukee, Wisconsin) by use of a dedicated 8-channel phased array coil (USA Instruments, Aurora, Ohio). We performed our standard intracranial 3D TOF protocol in all participants by using the following parameters: TR, 30 ms; TE, 3.3 ms; and a tilted optimized nonsaturating excitation pulse with a central flip angle of 20°. Section thickness was 1 mm. A field of view of 18 × 18 mm was used with a matrix of 384 × 224. The acquisition time was 4 min 37 s. The angiography procedure was standard, and conventional 2D DSA was performed with an angiography system (Digitex Safire; Shimadzu, Kyoto, Japan). Venous-phase DSA images, as well as arterial-phase DSA images, were obtained in all patients.
Image Interpretations
The 406 MRA examinations were evaluated by 2 neuroradiologists independently (S.K. and N.O., with 15 years and 25 years of experience in neuroradiology, respectively) at separate sessions. After independent interpretations, the differences in assessment of both observers were resolved by consensus. MRA source and maximum intensity projection images were used for the evaluation.
The radiologists subjectively rated the flow signals observed in the PP/EV and CS on the MRA images by using a 5-point grading scale as follows: grade 0 = the PP flow signal is less than or equal to the background signal; grade I = the PP/EV flow signal is above the background signal; grade II = the PP/EV flow signal is equal to that originating from arterial structures of the same size; grade III = a high signal intensity is seen in less than or equal to one- third of the CS and PP/EV; and grade IV = a high signal intensity is seen in more than one-third of the CS and PP/EV (Fig 2). In addition, the radiologists rated the flow signals observed in the IPS and CS by using a 5-point grading scale: grade 0 = the IPS flow signal is less than or equal to the background signal; grade I = the IPS flow signal is above the background signal; grade II = the IPS flow signal is equal to that originating from arterial structures of the same size; grade III = a high signal intensity is seen in less than or equal to one-third of the CS and IPS; and grade IV = a high signal intensity is seen in more than one-third of the CS and IPS (Fig 3).

Examples of the 5-point grading scale for the PP/EV. A, Grade I: The PP/EV flow signal (arrow) was above the background signal on the MRA source image. B, Grade II: The PP/EV flow signal (arrow) was equal to that originating from arterial structures of the same size on the MRA source image. C, Grade III: A high signal intensity (arrow) less than or equal to one-third of the CS and PP/EV was seen on the MRA source image. D–E, Grade IV: A high signal intensity (arrow) in more than one-third of the CS, and PP/EV was seen on the maximum intensity projection source image (D). A high signal intensity (arrows) was seen in the PP/EV on the MRA maximum intensity projection image (E).

An example of the IPS flow signal. On the MRA source images, a high signal intensity in more than one-third of the CS and IPS was seen (grade IV).
With use of the 5-point grading scale just mentioned, 171 MRA images obtained before or after DSA were evaluated by 2 neuroradiologists independently (S.K., N.O.), and the final judgments were obtained by consensus. A total of 171 DSA images were simultaneously reviewed by the radiologists to determine whether DAVFs were present at the CS. In the assessment of the MRA and DSA images, each image was analyzed separately.
The images were displayed and interpreted on a diagnostic monitor (Flexscan L365; EIZO Nanao, Ishikawa, Japan). An intuitive and efficient user interface allowed the manipulation (ie, rotation, zoom, and electronic scalpel) of these views in real time, and the reviewers determined the threshold of the vessel images in each participant by interactively observing the MRA images at the workstation.
Statistical Analysis
The statistical analyses were performed with a statistical software package (StatView 5.0; SAS Institute, Cary, North Carolina). A χ2 analysis was performed on the results to assess the statistical significance of the different scores assigned to the flow signals in the PP/EV and IPS. The participants were grouped into 10-year age intervals. The Cochran-Armitage test for trend was used to evaluate the linear association between the age groups and the frequency of the flow signals in the PP/EV or IPS. In addition, the association between the frequency of the flow signals in the PP/EV or IPS and the age groups was evaluated by use of the χ2 test and odds ratio with 95% confidence intervals. To evaluate the level of interobserver agreement of the grade of the flow signal in the PP/EV and IPS, a Kendall W test was performed on the independent grade from 2 radiologists before the consensus review. Kendall W coefficients between 0.5 and 0.8 were considered to indicate good agreement, and coefficients higher than 0.8 were considered to indicate excellent agreement. A P value of <.05 was considered to indicate a statistically significant difference.
Results
Of the 406 total MRA images, a flow signal was seen in the PP/EV and the IPS in 110 patients (27.1%; 108 left, 10 right, 8 bilateral) and in 64 patients (15.8%; 58 left, 12 right, 6 bilateral), respectively. For both the PP/EV and IPS, flow signals were significantly more common on the left side than on the right (P < .01). The flow signal in the PP/EV was rated as grade 0 in 296 patients (72.9%), grade I in 50 patients (12.3%), grade II in 17 patients (4.2%), grade III in 34 patients (8.4%), and grade IV in 9 patients (2.2%). The flow signal in the IPS was rated as grade 0 in 342 patients (84.2%), grade I in 40 patients (9.9%), grade II in 16 patients (3.9%), grade III in 6 patients (1.5%), and grade IV in 2 patients (0.5%). In these patients, the flow signals in the PP/EV and IPS gradually decreased toward the CS. A flow signal was seen in both the PP/EV and IPS in 22 patients (5.4%). Flow signals were significantly more common in the PP/EV than in the IPS (27.1% vs 15.8%; P < .01), and a grade of III or IV was significantly more common for the PP/EV than for the IPS (11.3% vs 2.0%; P < .01).
The frequency of flow signal in the PP/EV and IPS according to age group and grade is shown in Table 2. There were no statistically significant differences between age group and frequency of flow signal in the PP/EV (P = .21, Cochran-Armitage test for trend). On the contrary, a statistically significant association between age group and frequency of flow signal in the IPS was observed (P < .01). Patients older than 50 years were 3 times more likely to have flow signals in the IPS compared with those younger than 50 years (odds ratio, 3.29; 95% confidence interval, 1.28–8.51).
Frequency of flow signal in PP/EV and IPS by age group and grading
In the analysis of the 171 MRA and DSA images, a flow signal was seen in the PP/EV in 60 patients (35.1%). These were rated as grade I in 23 patients (13.5%), grade II in 13 patients (7.6%), grade III in 16 patients (9.4%), and grade IV in 8 patients (4.7%). No DAVFs were seen at the CS on DSA images in any patients with flow signals in the PP/EV (Fig 4). For rating the grade of the flow signal in PP/EV and IPS, the interobserver agreements between the 2 radiologists were excellent with Kendall W values (τ) of 0.94 and 0.94, respectively. For the evaluation of participants with both 3T MRA and DSA images, the interobserver agreement in rating the grade of the flow signal in PP/EV was also excellent with Kendall W values (τ) of 0.95.

An 72-year-old man with stenosis of the right internal carotid artery. MRA source (A) and maximum intensity projection (B) images show a high signal intensity in the left PP/EV and CS (arrows). This patient was rated as grade IV. No DAVFs at the CS were seen on DSA with a left common carotid artery injection (C).
Discussion
We evaluted the incidence and visualization of venous flow signals in the PP/EV and CS in healthy participants and demonstrated that high signals in the PP/EV and CS are frequently seen on 3T MRA images. No DAVFs were identified at the CS on DSA images in any patients with flow signals in the PP/EV on MRA images. According to a previous study9 in which 1.5T MRA images (TR, 35 ms) were used, only 1 (4%) of 25 patients showed a high signal in the IPS or posterior CS. Our study demonstrated that 64 (15.8%) of 406 patients showed a high signal in the IPS, and 2.5% of these patients showed a flow signal in the anterior CS. A possible explanation for these results may be the potential benefits of 3T MRA vs 1.5T MRA, including increased T1 relaxation times and/or high signal-to-noise ratios.10
Tanaka et al11 reported that, in normal cases, the left internal jugular vein and sigmoid sinus are higher in signal intensity significantly more often than the right internal jugular vein and sigmoid sinus, and compression of the left brachiocephalic vein is the major cause of frequent high signals in the left internal jugular vein and sigmoid sinus. From an anatomic standpoint, the left brachiocephalic vein drains into the superior vena cava where the superior vena cava crosses the aortic arch. Therefore, the left brachiocephalic vein can be easily compressed between the sternum and the aortic arch or right brachiocephalic artery.12 In our study, we also found that flow signals are significantly more common in the left PP/EV than in the right PP/EV, and these gradually decreased toward the CS in all patients. These results suggest that flow signals in the PP/EV originate from reverse flow, same as in the internal jugular vein and sigmoid sinus. A previous study13 of microscopic anatomy reported that venous valves, arteriovenous anastomoses, and blood-storable shapes were observed in the PP, which easily cause a stagnant bloodstream. Although it remains unclear why flow signals were significantly more common in the PP/EV than in the IPS, we speculate that the blood flow in the PP/EV may be more easily reversed because of these anatomic factors. In addition, venous flow may be slower in the PP/EV than in the IPS, which seems to lead to more frequent reverse flows. Because the PP/EV are small and complex vessel structures, reverse flow speeds are not as high and may not be detected on 1.5T MRA images. The phase-contrast MRA may enable more confident identification of small and complex vessel structures with low-velocity encoding and may provide an effective way to assess venous flow reversal in the PP/EV with phase reconstruction.14 Therefore, further study with phase-contrast MRA may confirm our speculation of the reversal venous flow in the PP/EV.
We also found that flow signals are seen in the IPS in older patients; this result may be because the left brachiocephalic vein can be easily compressed as it becomes more elastic from aging or atherosclerosis.12 On the contrary, no significant relationship between age group and frequency of flow signal in the PP/EV was observed.
Our study had several limitations. First, the study was retrospective and DSA was not performed in all cases. Second, young participants comprised a relatively small sample size. In addition, all of the patients in the study underwent imaging for clinical indications and, in this respect, were not completely representative of a normal population.
Conclusions
High signals are frequently seen in the left PP/EV and left CS on 3T MRA images in healthy subjects. Radiologists and other physicians should be aware of these flow signals so that normal findings are not misinterpreted as DAVFs at the CS and unnecessary further evaluation can be avoided.
Footnotes
Paper previously presented at: Annual Meeting of the American Society of Neuroradiology, June 4–9, 2011, Seattle, Washington.
REFERENCES
- Received May 28, 2012.
- Accepted after revision August 28, 2012.
- © 2013 by American Journal of Neuroradiology
In this issue


Jump to section
Related Articles
Cited By...
- No citing articles found.