
Abstract
SUMMARY: Term-equivalent imaging can assess myelination status in very preterm infants (<30 weeks' gestational age at birth). However, myelination assessment has yet to be compared among GRE-T1WI, SE-T1WI, and SE-T2WI at 3T. We aimed to compare the rates of myelination among those 3 sequences in 11 very preterm neonates who underwent 3T MR imaging at term-equivalent age and subsequently had normal neurologic development. On each sequence, 2 neuroradiologists individually assessed 22 structures. SE-T2WI depicted a higher myelination rate (present in 58.2%–66.4% of all structures) than either GRE-T1WI (51.6%–63.9%) or SE-T1WI (20.5%–38.5%), while GRE-T1WI had the highest interobserver agreement (κ, 0.56; P < .0001). Myelination was present in 90%–100% of patients within the corpus callosum splenium, DSCP, ICP, lateral lemniscus, and spinal tract/nucleus of cranial nerve V on SE-T2WI, and in the DSCP, ICP, lateral lemniscus, medial lemniscus, pyramidal decussation, PLIC, and superior cerebellar peduncle on GRE-T1WI, occurring in similar structures as previously shown at 1.5T and 1T. However, it is not clear whether these findings represent true myelination versus precursors to myelination.
ABBREVIATIONS:
- DSCP
- decussation of superior cerebellar peduncles
- GRE
- gradient-recalled echo
- ICP
- inferior cerebellar peduncle
- PLIC
- posterior limb of the internal capsule
- SE
- spin-echo
Term-equivalent brain MR imaging has been used as a predictor of late outcome in preterm infants in many centers, though it remains a controversial part of early clinical management.1,2 One reason some have advocated an initial MR imaging as standard practice at term-equivalent age is that as many as 10%–15% of very preterm infants (≤30 weeks' gestational age at birth) develop cerebral palsy, while up to 50% may subsequently exhibit a neurobehavioral problem.3
MR imaging can detect more subtle forms of white matter injury and aids in the assessment of the extent of myelination, a surrogate marker of brain maturation.
At 1.5T and at 1T, earlier studies have demonstrated that certain structures are expected to be myelinated at term and term-equivalent imaging on SE-T1WI and SE-T2WI, most notably the DSCP, ICP, medial lemniscus, PLIC, and the superior cerebellar peduncle.4,5 However, there are as of yet no studies regarding the myelination patterns of premature infants imaged at term-equivalent age by using GRE-T1WI at 3T.6 Also, there has not yet been a comparative evaluation of different T1WI acquisition methods at 3T, such as GRE-T1WI versus SE-T1WI, for detecting myelination. This is important because SE-T1WI exhibits less gray-white differentiation at 3T; we observed, before our study, that GRE-T1WI may depict T1-bright myelination earlier than SE-T1WI in infants at 3T. Hence, in this study, we set out to evaluate myelination at term-equivalent age in very premature infants with subsequently normal neurologic development; our goal was to determine which regions consistently exhibit myelination on these sequences by comparing various landmarks, based largely on a previous study by Barkovich.4
Materials and Methods
Internal review board approval was obtained for this retrospective study. An imaging data base and clinical record review during 3 years (January 2007–January 2010) yielded 24 very preterm infants (<30 weeks) who underwent 3T MR imaging at term-equivalent age (38–42 weeks) that used all 3 sequences, SE-T1WI, GRE-T1WI, and SE-T2WI, and had no neurologic symptoms at clinical follow-up at 9 months of age or older (as determined by a pediatric neurologist), based on inclusion criteria from a previous study with a similar patient population.7 Of the 24 patients from the data base search, 13 were excluded at initial review: 9 due to MR imaging abnormalities such as hypoxic-ischemic insult or T1-bright periventricular foci (n = 4), germinal matrix or parenchymal hemorrhage (n = 3), periventricular leukomalacia (n = 1), or a congenital structural abnormality (n = 1). The remainder of excluded patients were due to suboptimal imaging or severe motion (n = 4). Of the remaining 11 patients included for analysis, 5 were male and 6 were female, with a gestational age at birth ranging from 25 weeks + 5 days to 28 weeks + 1 day.
MR Imaging Technique
All studies were performed on a single 3T MR imaging unit (Intera; Philips Medical Systems, Best, the Netherlands), with patients sedated by a pediatric intensivist. The imaging parameters for GRE-T1WI were a volumetric acquisition of 9.8/4.6 ms/8°/15–20 cm/1 (TR/TE/flip angle/FOV/NEX), with a matrix of 169 × 169–240 × 240, a section thickness of 1 mm (0 mm gap), and an acquisition time of approximately 5 minutes; these were reconstructed and stored within the PACS in the axial plane at a section thickness of 3 mm. For SE-T1WI, the parameters were 353–734/10 ms/14–20 cm/1 (TR/TE/FOV/NEX), with a matrix of 168 × 132–265 × 205, axial thickness of 3 mm (0.3- to 1-mm gap), and an acquisition time of approximately 5 minutes. For turbo SE-T2WI, the parameters were a turbo factor of 14; 3000/80–122 ms/14–20 cm/2 (TR/TE/FOV/NEX); a matrix of 268 × 190–400 × 312; an axial section thickness of 3 mm (0.3- to 1-mm gap); and an acquisition time of approximately 2.5 minutes.
Image Interpretation
Two staff neuroradiologists (A.M.M., C.L.T., each with >7 years' experience in interpreting neonatal MR imaging), independently assessed 22 structures, evaluating each sequence separately. The structures were adapted from a previous study and were the anterior and posterior commissures, anterior limb of the internal capsule, brachium of the inferior colliculus, corpus callosum splenium, cranial nerve V fascicle, corticospinal tracts, DSCP, habenular commissure, ICP, lateral geniculate nucleus, lateral lemniscus, medial lemniscus, medial longitudinal fasciculus, optic nerves, optic radiations, optic tracts, pyramidal decussation, PLIC, perirolandic cortex, superior cerebellar peduncle, and the spinal tract/nucleus of cranial nerve V.4 The staff members consulted a dedicated imaging atlas to delineate the location of smaller brain stem structures.8 Each of the 22 structures was tabulated as “myelinated” (+, relatively hyperintense on GRE/SE-T1WI or hypointense on SE-T2WI compared with surrounding structures or periventricular white matter), “nonmyelinated” (−), or “equivocal” (±).
Regarding statistical analysis for each sequence, the overall myelination rates of all structures were calculated, and an interobserver κ was calculated.
Results
Regarding all 11 patients included for imaging review, the myelination rates according to reviewers 1 and 2, respectively, were “definitely positive” (ie, scored as “+”) in 58.2% and 66.4% of all 22 structures analyzed on SE-T2WI, 51.6% and 63.9% on GRE-T1WI, and 20.5% and 38.5% on SE-T1WI.
The Table shows the percentage of patients myelinated in each region. The anterior limbs of the internal capsules and optic radiations were consistently nonmyelinated as expected (Fig 1), while the anterior and posterior commissures and the medial longitudinal fasciculi consistently lacked myelination on both SE-T1WI and GRE-T1WI and exhibited a very low myelination rate on SE-T2WI.
Percentage of patients myelinated in each region per the 2 observers

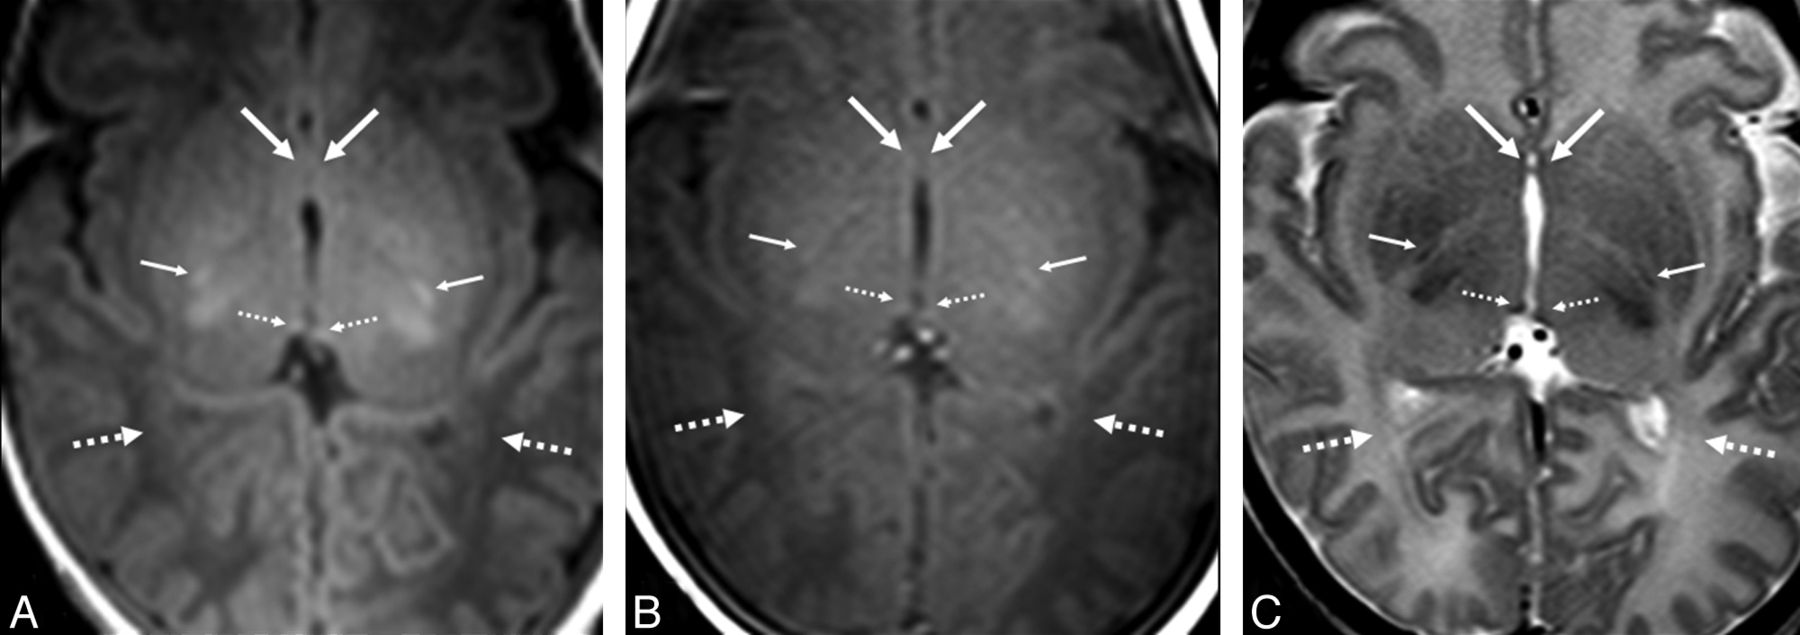
GRE-T1WI (A), SE-T1WI (B), and SE-T2WI (C) at the level of the nonmyelinated anterior commissure (arrows) and optic radiations (dashed arrows) in a very preterm infant (27 weeks +3 days) imaged at term-equivalent age (40 weeks +2 days). Note the myelinated PLIC (thin arrows) and habenular commissure (thin dashed arrows), both of which were myelinated in most infants on both GRE-T1WI and on SE-T2WI.
Structures such as the DSCP, ICP, and lateral lemniscus had quite high myelination rates and high agreement between observers, with 90%–100% of patients being myelinated in those 3 structures on both SE-T2WI and GRE-T1WI (Figs 2 and 3). The medial lemniscus, PLIC, and the superior cerebellar peduncle also exhibited nearly as high rates of myelination, with a range of 81.8%–100% for both observers, based on both SE-T2WI and GRE-T1WI.

GRE-T1WI (A), SE-T1WI (B), and SE-T2WI (C) at the level of the pontomesencephalic junction in a very preterm infant (26 weeks +5 days at birth), imaged at term-equivalent age (39 weeks +5 days). The medial lemniscus (ML) (arrows) and the lateral lemniscus (dashed arrows) are well-depicted on both GRE-T1WI and SE-T2WI but not on SE-T1WI. These 2 structures were myelinated on both sequences in the large majority of term-equivalent infants. A level just caudal to that (D–F) demonstrates that the ML is well-visualized on each sequence, while the cranial nerve V fascicle (thin arrows) is well-visualized on both GRE-T1WI and SE-T2WI but not on SE-T1WI.

Comparison among GRE-T1WI (A), SE-T1WI (B), and SE-T2WI (C) at the level of the midbrain in a very preterm infant (26 weeks +0 days) imaged at term-equivalent age (40 weeks +1 day). The DSCP (arrows) and the brachium of the inferior colliculus (dashed arrows) are depicted. The DSCP was myelinated in all term-equivalent infants on both GRE-T1WI and SE-T2WI, while the brachium of the inferior colliculus was variably myelinated on these 2 sequences.
According to both observers, SE-T2WI showed higher rates of myelination than GRE-T1WI in the following sites: optic tracts, perirolandic cortex, and the spinal tract/nucleus of cranial nerve V. On the other hand, per both observers, GRE-T1WI had higher myelination rates than SE-T2WI in the following sites: corticospinal tracts, optic nerves, PLIC, and the superior cerebellar peduncle (Figs 4 and 5). GRE-T1WI was clearly superior to SE-T1WI for detecting myelination in all sites that had a myelination rate of >0% (Figs 1⇑–3).

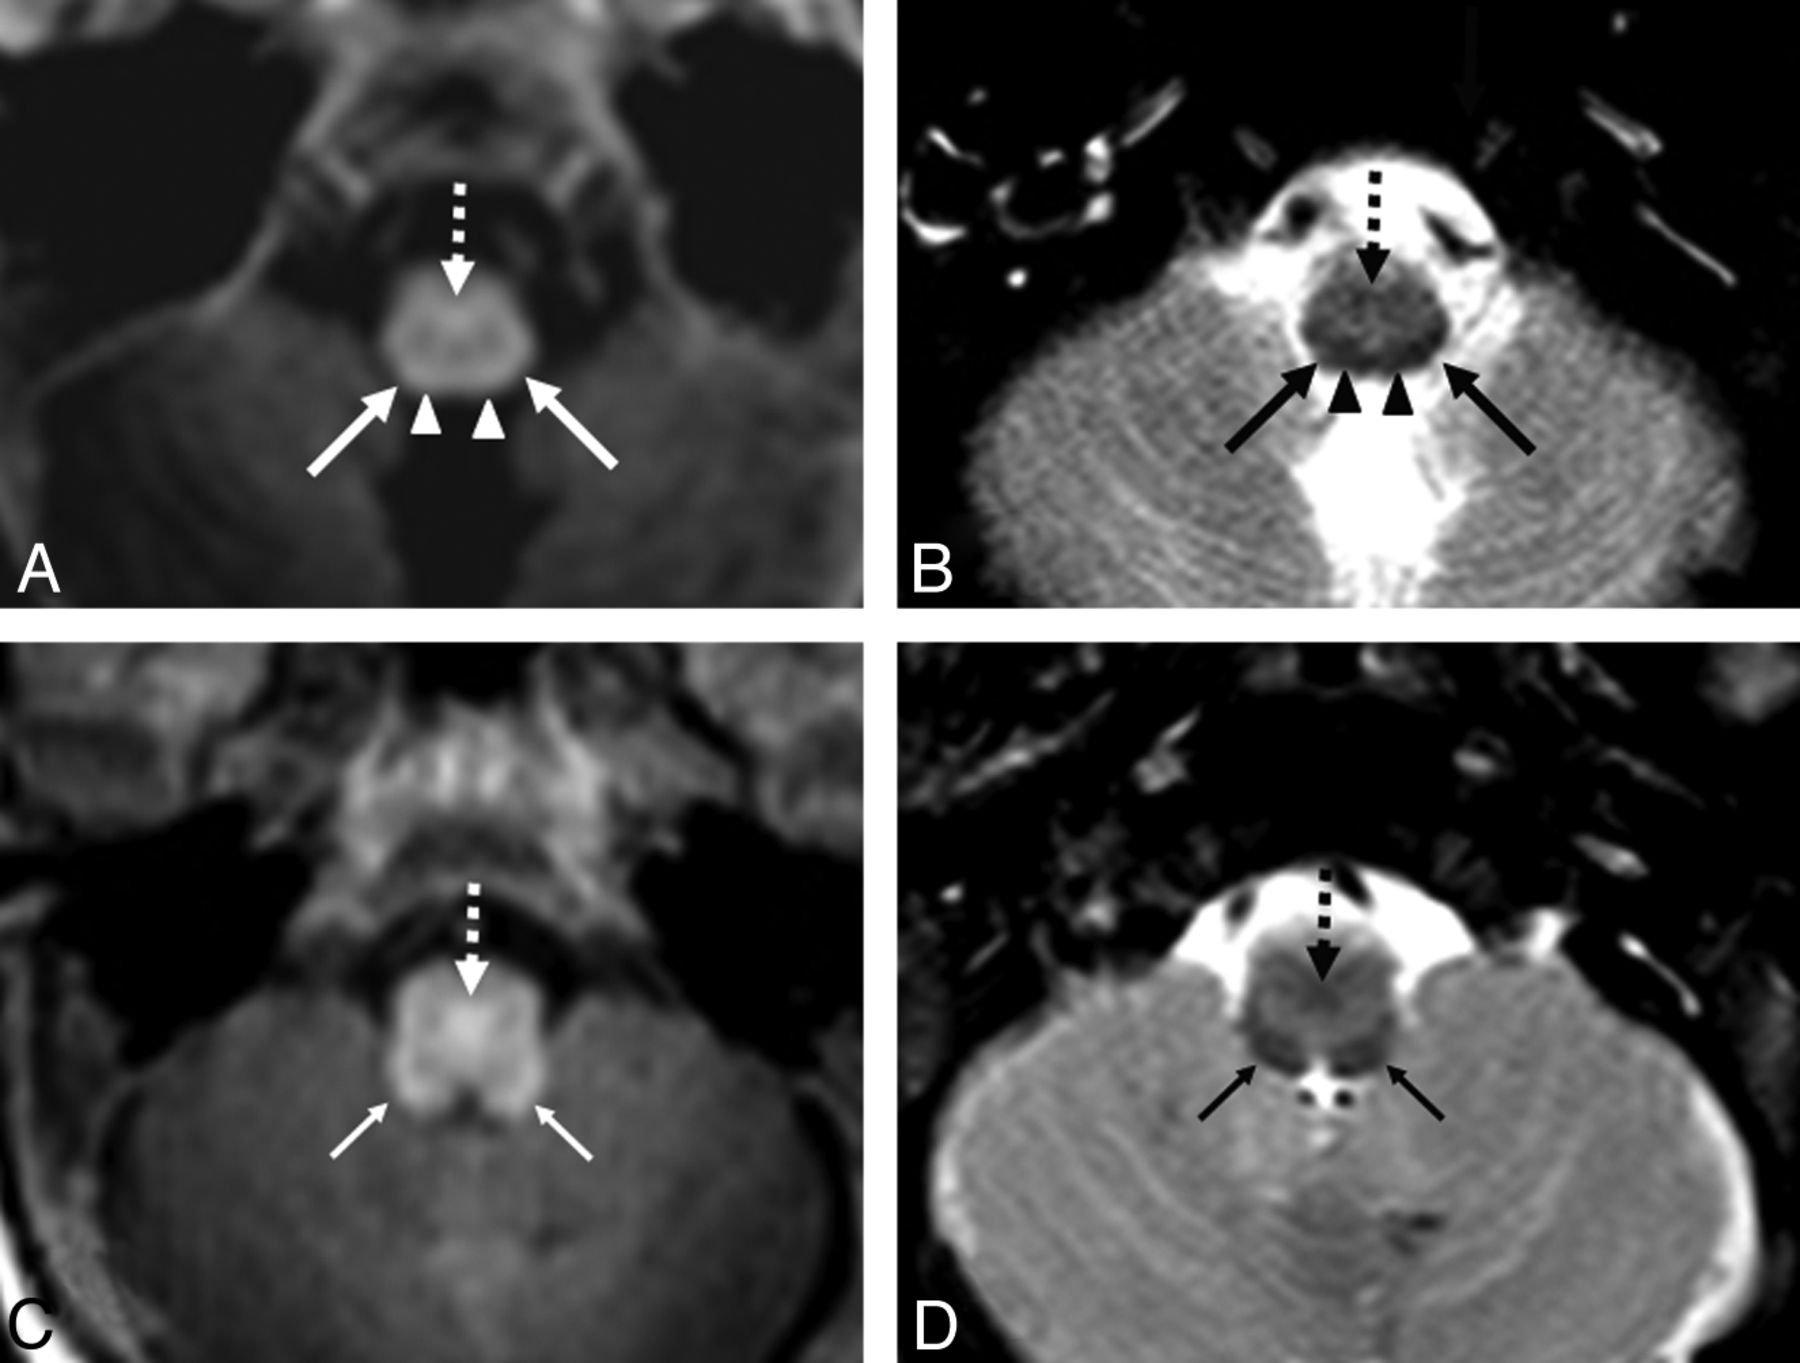
GRE-T1WI (A and C) and SE-T2WI (B and D) at the level of the medulla in a very preterm infant (26 weeks +0 days) imaged at term-equivalent age (40 weeks +1 day). Regarding A and B, the spinal tract and nucleus of cranial nerve V (STV) (arrows) are more easily delineated on SE-T2WI, while the pyramidal decussation (PD) (dashed arrows) is visible on both sequences. Note the cuneate fasciculi (arrowheads) just medial to the STV. At a level 1 section higher (C and D), the ICP (thin arrows) and the PD (dashed arrows) are visible on both sequences, but the ICP is more clearly visible on SE-T2WI due to a greater contrast with the remainder of the medulla.

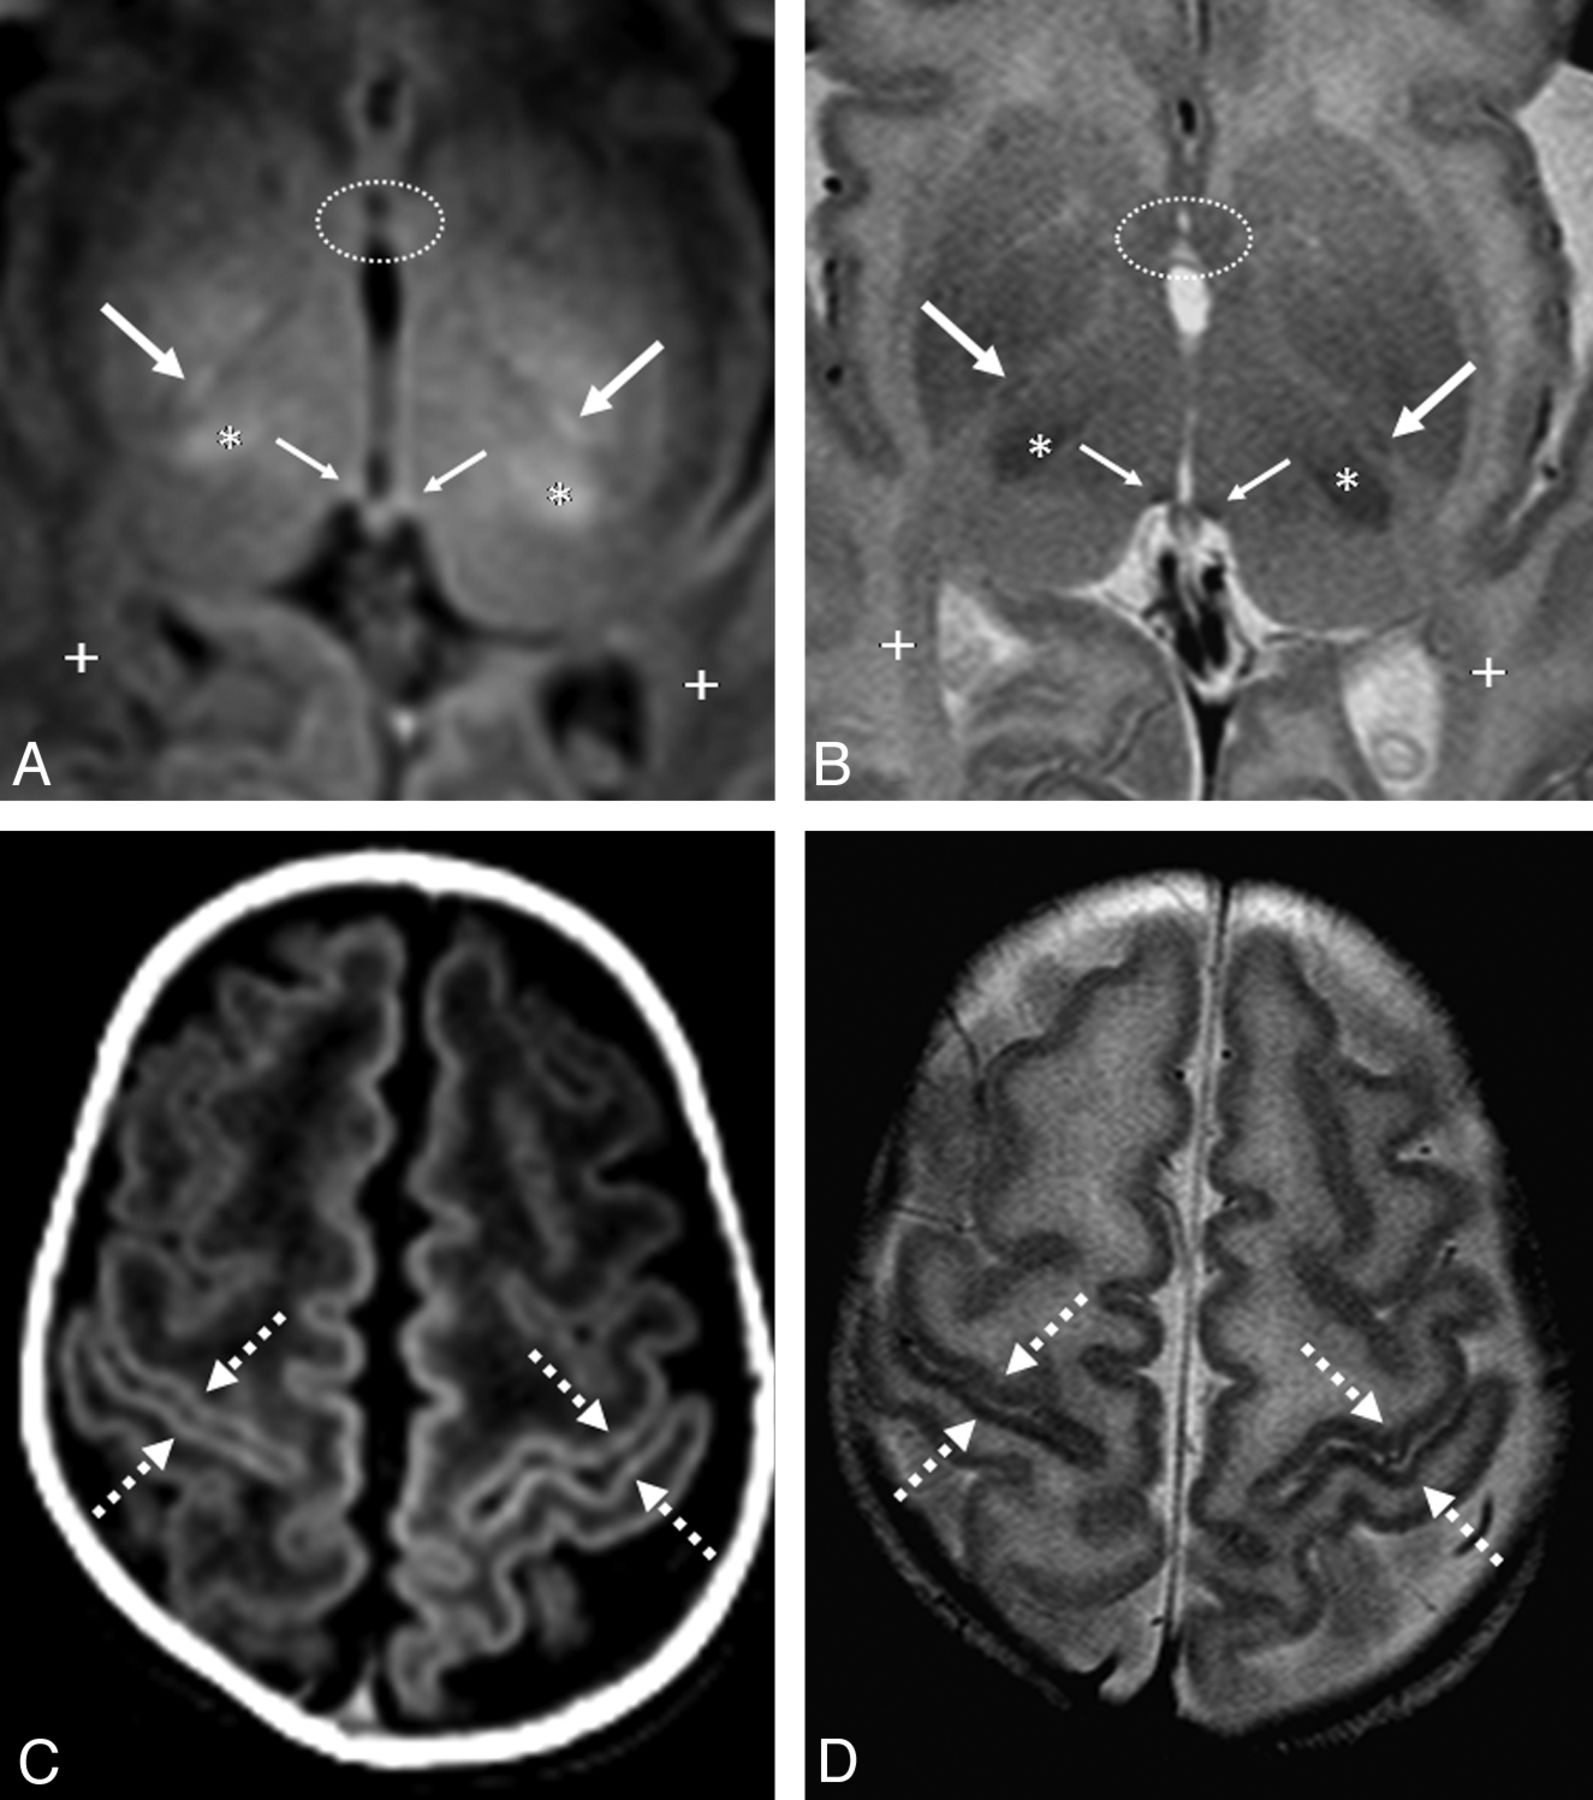
GRE-T1WI (A and C) and SE-T2WI (B and D) in a very preterm infant (26 weeks +4 days) imaged at term-equivalent age (40 weeks +2 days). A and B, The PLIC (arrows) is better delineated on GRE-T1WI, while the habenular commissure (thin arrows) is visible on both sequences. Note the myelinated ventrolateral thalami (asterisk) along with the nonmyelinated anterior commissure anteriorly (dotted circles) and optic radiations posteriorly (+). Near the vertex (C and D), the perirolandic cortex (dashed arrows) is visibly myelinated on both sequences. The PLIC has a slightly higher rate of myelination on GRE-T1WI than on SE-T2WI.
Interobserver κ on GRE-T1WI was moderate-high (κ = 0.56); and on both SE-T2WI (κ = 0.43) and SE-T1WI (κ = 0.40), it was moderate (each P < .0001).
Discussion
Myelination, a dynamic process in the developing brain, may be the most important indicator of brain maturation.5 This fact prompted us to determine which anatomic structures had high rates of myelination at 3T. On the basis of both SE-T2WI and GRE-T1WI, we found these sites to be the DSCP, ICP, and the lateral lemniscus, each of which had myelination in 90%–100% of term-equivalent patients, according to both observers. Other sites, such as the corpus callosum splenium, DSCP, medial lemniscus, pyramidal decussation, PLIC, superior cerebellar peduncle, and spinal tract/nucleus of cranial nerve V also exhibited nearly as high rates of myelination but were favored by 1 sequence (either SE-T2WI or GRE-T1WI). We also found that SE-T2WI showed slightly higher overall rates of myelination and that GRE-T1WI clearly outperformed SE-T1WI in myelination evaluation at 3T.
Assessment of normal myelination is one of the most important questions to be answered by neonatal imaging, for which previous studies at lower field strengths have used SE-T1WI to assess the degree of myelination.4,5,9,10 Because the myelination patterns at 3T and on GRE-T1WI are largely unknown, we assessed myelination in term-equivalent infants to not only determine their myelination patterns but to also compare 3 commonly used sequences at 3T in a head-to-head manner. To our knowledge, there are no previous studies comparing the myelination patterns on GRE-T1WI with either SE-T1WI or SE-T2WI in neonates or premature infants. On the basis of our results, GRE-T1WI was superior to SE-T1WI both in detecting rates of “myelination” of each structure and regarding interobserver agreement. We acknowledge that it has not been proved that such structures are hyperintense as a result of successful myelination.
Our results were similar in some aspects to those in a previous study of 12 term neonates performed at a lower field strength, in which structures such as the DSCP, ICP, lateral lemniscus, medial lemniscus, pyramidal decussation, PLIC, and the superior cerebellar peduncle also demonstrated higher rates of myelination on GRE-T1WI than in our study.4 However, our study may contradict prior data that T1-weighted precedes T2-weighted images in detecting myelination; in particular, our study found a higher rate of myelination within the optic tracts, perirolandic cortex, and spinal tract/nucleus of cranial nerve V on SE-T2WI compared with GRE-T1WI at 3T. In a previous study of very preterm infants imaged at term-equivalent age at 1T, the authors compared 3 different sequences (SE-T1WI, inversion recovery, and SE-T2WI) and found a higher percentages of myelination on SE-T1WI relative to SE-T2WI in most white matter structures; the large majority of patients exhibited myelination in the DSCP, ICP, lateral lemniscus, medial lemniscus, PLIC, and superior cerebellar peduncle.5 Such results are similar to our findings on SE-T2WI and GRE-T1WI, with the addition of a high rate of myelination of the corpus callosum splenium and spinal tract/nucleus of cranial nerve V on SE-T2WI, and the cranial nerve V fascicle and pyramidal decussation on GRE-T1WI (each >80%).
Additionally, our study at 3T found a slightly greater extent of myelination overall on SE-T2WI than on GRE-T1WI, which may be due to several factors. First, the use of a 3T field strength likely played a role, in which there is theoretically a 3-fold increase in SNR from 1T that augments the visualization of abnormalities on SE-T2WI.11⇓⇓–14 Second, SE-T2WI at 3T may display greater background white matter hyperintensity in premature patients, thus creating greater contrast of certain structures to background white matter. Third, the difference in rates of myelination detection between SE-T2WI and GRE-T1WI is slight and could even be accounted for by interobserver differences.
We acknowledge that it has yet to be proved that T1-bright signal within structures on GRE-T1WI represents true myelination. The potential drawback of SE-T1WI at 3T is that the gray-white matter contrast on SE-T1WI is lessened compared with lower field strengths; this occurs due to prolongation of the T1 times of tissue to the point at which T1 times can be closer together.15,16 Because the overall contrast between various anatomic landmarks of the brain is likely diminished on SE-T1WI at 3T, GRE-T1WI has been proposed as an alternative to obtain T1WI at 3T. Our results suggest that GRE-T1WI could potentially replace SE-T1WI as a sequence to evaluate myelination at 3T.17 However, this necessitates future evaluation with long-term follow-up MR imaging and clinical data to determine whether such T1-bright structures truly reflect active myelination or are precursors of myelination. In this regard, a preliminary study using diffusion tensor imaging in preterm infants at term-equivalent age had noted higher fractional anisotropy in such regions but still questioned whether those findings reflected accelerated myelination or maturation versus activity focally induced in affected pathways.18 Thus, future studies could use diffusion tensor imaging to determine whether T1-hyperintense and T2-hypointense regions at 3T truly reflect myelination.18⇓⇓–21
This study had several limitations, including the inherent limitations of a retrospective study. Qualitative analysis based on subjective scoring can also be considered a limitation, in the absence of a consensus review, though subjectivity is inherent in regular daily practice. We note that 1 goal of this study was to evaluate for such “subjectivity” at 3T to ascertain whether and in what structures myelination could be reproducibly identified and found that, at a minimum, the DSCP, ICP, and lateral lemniscus were reliably identified as myelinated by both observers on both SE-T2WI and GRE-T1WI. Technical limitations also exist, such as motion between sequences or artifacts such as pulsation, which could alter the visualization of smaller structures. Also, other limitations include the lack of a control group (such as term infants) with which to compare myelination patterns, the relatively small number of patients, and the lack of a longitudinal follow-up imaging with time. Despite the fact that the patients within this study demonstrated normal neurologic development at least up to 9 months, we acknowledge that minor neurologic deficits and developmental delays could become manifest at later ages.
Conclusions
Our results suggest that both SE-T2WI and GRE-T1WI are much more sensitive than SE-T1WI in detecting myelination in term-equivalent very preterm infants at 3T. While SE-T2WI detects a slightly greater rate of myelination, GRE-T1WI has higher interobserver reliability. At a minimum, the DSCP, ICP, and lateral lemniscus can be reliably identified as myelinated on both SE-T2WI and GRE-T1WI. However, this pattern has yet to be validated in healthy term infants, and further prospective research is necessary to confirm whether the bright signal on GRE-T1WI and dark signal on SE-T2WI at 3T in such structures truly represent myelination.
Footnotes
Disclosures: Alexander M. McKinney—UNRELATED: Board Membership: Vital Images (Minnetonka, Minnesota), Comments: Advisory Board member, less than $2000 per year compensation.
Paper previously presented in preliminary form at: 48th Annual Meeting of the American Society of Neuroradiology and Neuroradiology Education and Research Foundation Symposium, May 15–20, 2010; Boston, Massachusetts.
References
- Received April 28, 2012.
- Accepted after revision July 29, 2012.
- © 2013 by American Journal of Neuroradiology


