
Abstract
BACKGROUND AND PURPOSE: DTI in cerebral X-linked adrenoleukodystrophy may demonstrate abnormalities in both affected and nonaffected WM; these values have not been studied serially after hematopoietic stem cell transplantation. The purpose of this study was to study pretransplant and posttransplant DTI parameters serially and ultimately to determine the ability of pretransplant DTI parameters to predict clinical outcome after HSCT in children with ALD.
MATERIALS AND METHODS: Eight patients with posterior-pattern cerebral ALD underwent DTI at 3T before HSCT (T0), at 30–60 days (T1), 90–120 days (T2), 180 days (T3), and 1 year (T4) after HSCT. FA and MD were serially measured in 19 regions, and these measurements were compared with those in control patients. MR imaging severity (Loes) scores were recorded. Correlations were performed between DTI parameters and Loes scores, neurologic function scores, and several neuropsychologic scores.
RESULTS: Both FA and MD in subjects differed significantly from that in controls at nearly every time point within cerebellar WM, callosal splenium, and parieto-occipital WM; FA alone was significantly different at each time point within the optic radiations, lateral geniculate, and the Meyer loop (P < .05). Loes scores at T0 correlated strongly with each clinical score at T4 (r = 0.771–0.986, P < .05). The only significant DTI correlation at T0 with a clinical score at T4 was callosal body FA with adaptive function (r = 0.976, P < .001). Correlating the change in DTI values with change in NFS (change between T0 and T4) showed that only ΔMD within the optic radiations correlated strongly with ΔNFS (r = 0.903, P < .05).
CONCLUSIONS: DTI values at T0 were generally poor predictors of outcome at 1 year, whereas Loes scores were generally good predictors. ΔMD within the optic radiations strongly correlates with ΔNFS over that year. In addition, certain normal-appearing regions, such as cerebellar WM, may have DTI abnormalities before HSCT that persist after HSCT.
ABBREVIATIONS:
- ALD
- adrenoleukodystrophy
- FA
- fractional anisotropy
- HSCT
- hematopoietic stem cell transplantation
- IQ
- intelligence quotient
- MD
- mean diffusivity
- NFS
- neurologic function scores
ALD is an inherited, peroxisomal disorder that occurs in approximately 1 in 20,000 live male births; the most severe form is cerebral ALD, a progressive disorder.1,2 CNS involvement in the childhood form involves inflammatory demyelination and atrophy.3⇓⇓⇓⇓–8 Allogeneic HSCT can inhibit the advancing demyelination if administered early in the disease course.5,6 This treatment is the sole therapy to have shown long-term effectiveness in improving outcome, particularly in less severely affected patients (ie, those with lower Loes scores, 0–1 neurologic deficits, and better neuropsychologic scores).5⇓⇓–8 The mechanism by which HSCT ameliorates the disease in these cases is unknown, but because the typical histologic finding in untreated cerebral ALD is inflammation, HSCT is thought to alter the inflammatory response.9 On the other hand, patients with ALD who have advanced cerebral disease usually respond poorly to HSCT.5⇓–7 On the basis of these facts, periodic MR imaging scans are typically performed early in the course of cerebral ALD to detect early cerebral involvement that may provide information as to the likelihood of success of HSCT.
An MR imaging severity scoring system, termed the “Loes” score, is a 32-point scale that is used for pretransplantation assessment as well as to follow disease progression.8 This score accounts for the degree and extent of hyperintense abnormality on FLAIR or T2WI and the degree of regional atrophy; it is based on a score ranging from 0 (normal) to 32 (most severe). Loes scores measured before HSCT have been shown to correlate with long-term outcome; a pre-HSCT score of <9 is associated with an overall survival rate of approximately 85%, whereas a score of ≥9 is associated with an overall survival rate of approximately 40%.5⇓⇓–8,10
A number of clinical measures are used to assess patients with ALD before and after HSCT. One such metric, termed the neurologic functional score, is a measure of the overall neurologic state of patients with ALD, which is useful for judging their clinical response to HSCT. Various other neuropsychologic tests are also used to evaluate specific aspects of clinical function, such as the adaptive function score, the performance IQ, and the verbal intelligence quotient.4,5
Given the success of the Loes score in predicting clinical outcome after HSCT, it seems reasonable to postulate that other MR features could also serve as predictors of outcome. Preliminary DTI studies in cerebral ALD have found abnormal FA and MD in WM regions that are hyperintense on FLAIR; there are also data to suggest that normal-appearing WM and normal-appearing frontal WM in patients with ALD may have abnormal diffusivity compared with that in control subjects.11⇓⇓⇓–15 In theory, DTI measurements in certain structures before HSCT could potentially serve as predictors of clinical outcome after HSCT, but this theory has not yet been evaluated. With these factors in mind, we set out to assess the ability, if any, of DTI to serve such a predictive role, as well as secondarily to evaluate whether normal-appearing WM regions are abnormal relative to those in control subjects before and after HSCT.
Materials and Methods
Patient Selection
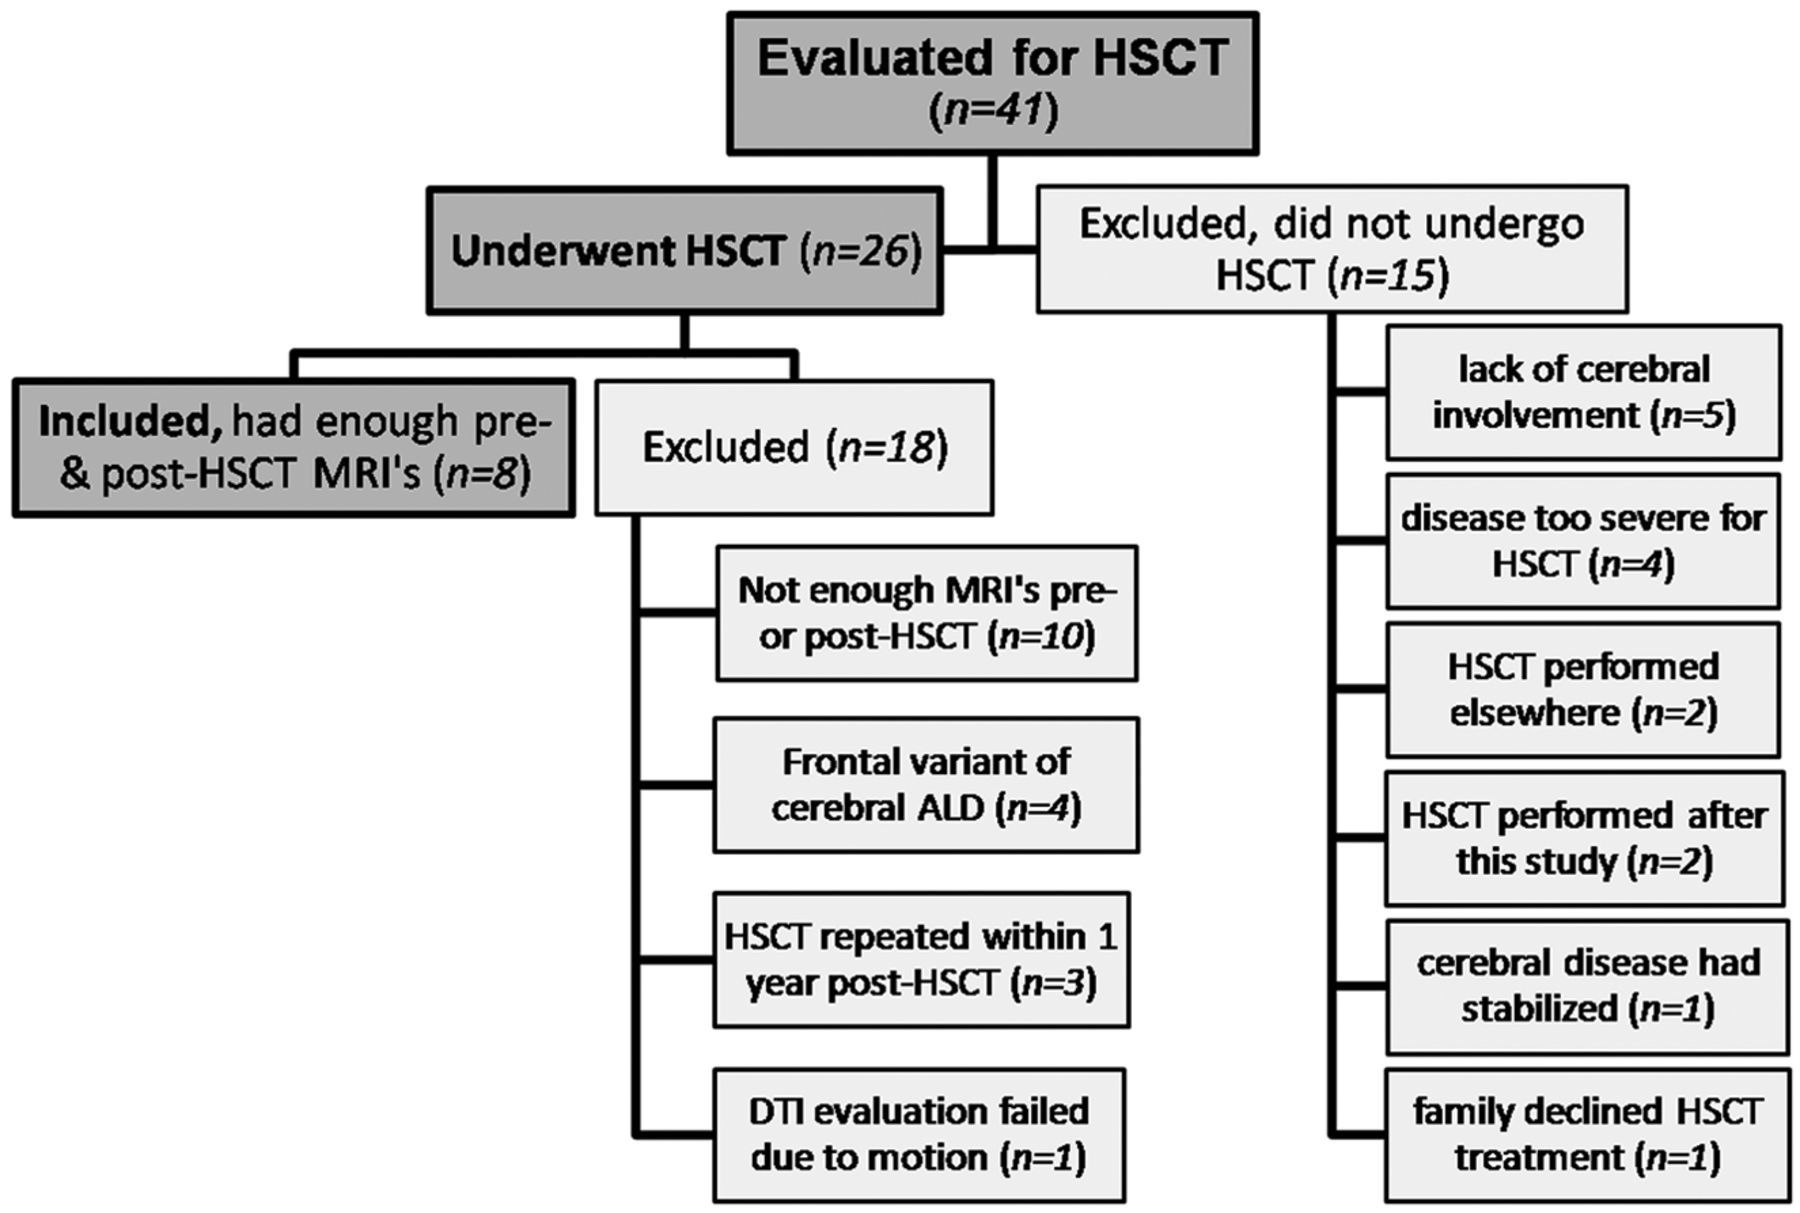
Institutional review board approval was obtained to retrospectively evaluate data obtained longitudinally over a 3-year period lasting from January 2007–January 2010 as part of a standard pre- and post-HSCT protocol for cerebral ALD. This involved 41 clinically confirmed patients with ALD who underwent 12-directional DTI at 3T. Of these, 26 underwent HSCT; the remaining 15 were excluded from HSCT for various clinical reasons (Fig 1). The standard protocol calls for patients to undergo pre-HSCT MR imaging <45 days before HSCT (T0), with at least 4 serial post-HSCT MR imaging sessions with DTI on the 3T scanner at time points 30–60 days (T1), 90–120 days (T2), 180 days (T3), and 1 year after HSCT (T4). Patients with HSCT were included for DTI analysis only if quality MR studies at our institution existed for all 5 time points. Patients with “frontal-variant” cerebral ALD (as opposed to the more common posterior-variant) were excluded; ultimately, 8 patients met criteria for inclusion. In addition, 8 age- and sex-matched control subjects (all male) with normal MR images and no neurologic diagnosis were selected for a one-time DTI analysis by using the same protocol. These control patients were not matched for IQ or any other measures.

Subgroup of patients with ALD included for serial DTI evaluation, and patients who were excluded.
Routine MR Images and DTI Acquisition
The 3T MR imaging sequences were performed in the following order: 3D volumetric T1WI and FLAIR before intravenous gadolinium contrast administration, postcontrast axial T2WI, 12-directional DTI, and 3D volumetric T1WI. The noncontrast T1WI sequence was used for DTI coregistration and for anatomic localization. Postcontrast T1WI was obtained but not used for this study. The sequence parameters for FLAIR were as follows: TR, 6500–9000 ms; TE, 105–110 ms; TI, 2000–2100 ms; NEX, 1–2; echo-train length, 15–23; gap, 0.5; and section thickness, 5 mm. For the 3D T1WI, a magnetization-prepared rapid acquisition of gradient echo T1WI sequence was obtained with the following parameters: TR, 1810 ms; TE, 3.5 ms; NEX, 1; FOV, 230 mm; parallel imaging factor, 2; isotropic voxel size, 0.9 × 0.9 × 0.9 mm; and acquisition time, 6 minutes. For DTI, the parameters were as follows: TR, 8500 ms; TE, 90 ms; NEX, 3; FOV, 256 mm; parallel imaging factor, 2; section thickness, 2 mm; gap, 1 mm; gradient strength, b = 1000 s/mm2; and acquisition time, approximately 6 minutes.
DTI Postprocessing and Analysis
One staff neuroradiologist (A.M.M.) performed DTI postprocessing by using a DynaSuite Neuro Workstation (Invivo, Gainesville, Florida); this software's method of DTI calculation has been described previously.16,17 First, the unenhanced T1WI was coregistered with the DTI maps by using automated fusion, which could be manually altered in any plane to optimize coregistration. The ventricular conformity, contour of the hemispheres, and basal ganglia contour were confirmed between the 2 sequences.
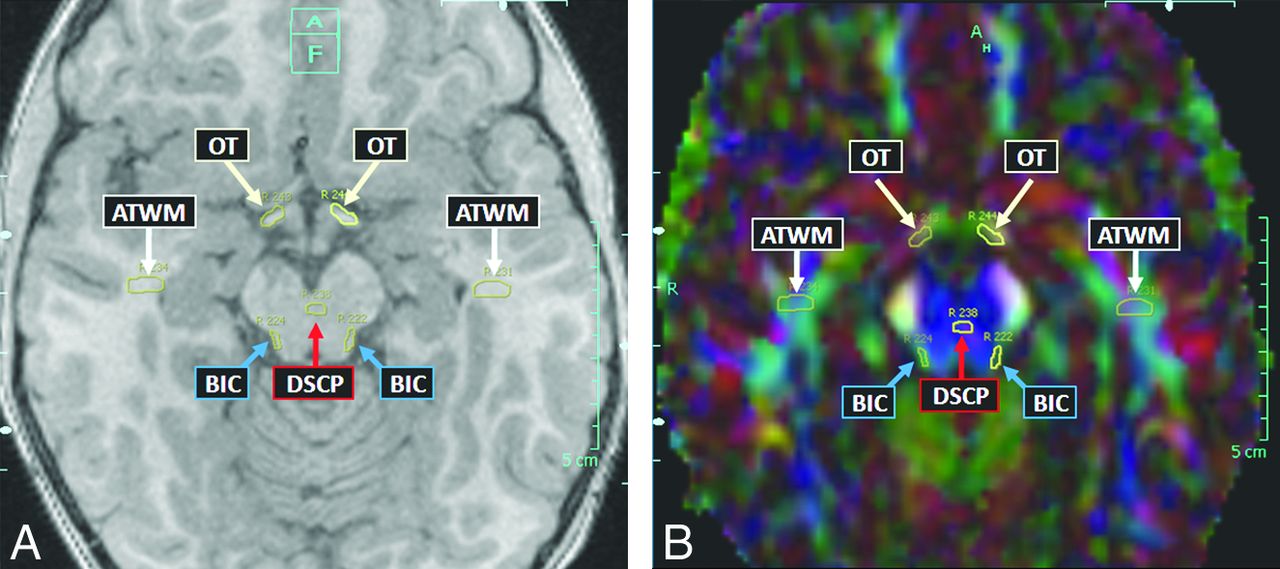
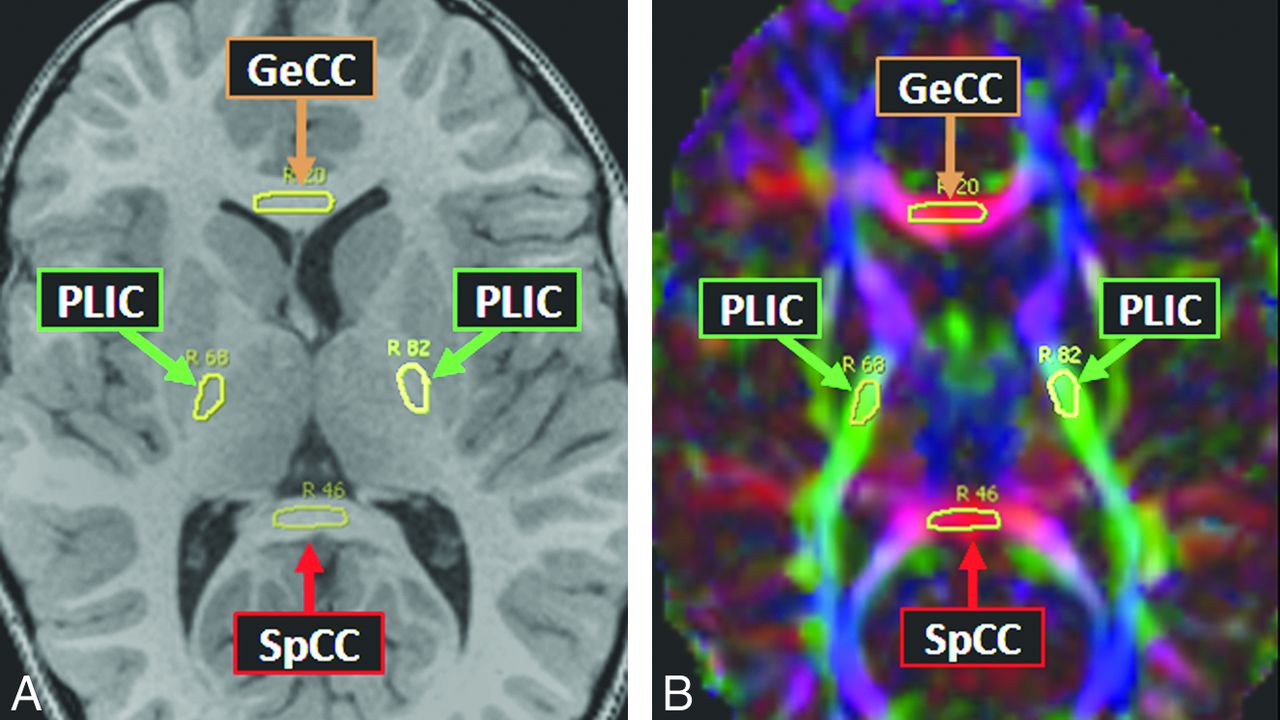
Thereafter, the 19 structures/tracts of interest were localized by comparing FA maps with the 3D T1WI in each of the 3 planes; the software displays a drawn ROI on the T1WI, color FA map, and grayscale FA map simultaneously. This visualization of the structure of interest on both the FA map and the 3D T1WI ensured serial measurements of that structure over the multiple time points. The 19 anatomic regions selected for measurement were based, as much as possible, on the criteria involved in the MR imaging severity scoring system devised by Loes et al.8 These regions were the anterior temporal WM, brachium of the inferior colliculus, corticospinal tracts (within the pons), cerebellar WM, decussation of the superior cerebellar peduncle, normal-appearing frontal WM, callosal body, callosal genu, callosal splenium, medial and lateral geniculate nuclei, medial and lateral leminisci, Meyer loop, optic radiations, optic tracts, posterior limb of the internal capsule, parieto-occipital WM, and trapezoid body (transverse pontine fibers). Thus, MD and FA were measured in these 19 structures serially for each patient, starting with the pre-HSCT MR imaging (T0); 5 total measurements were averaged at each time point for each of the 19 regions. The size of each ROI was typically an oval of approximately 5-mm diameter, though smaller structures, such as the optic tracts and geniculate nuclei, had ROIs of 2–5-mm diameter. In the control subjects, both MD and FA were measured in the 19 structures, with the average of 5 measurements recorded for comparison with the patients with ALD. Figs 2⇓–4 provide examples of ROIs on the 3D T1WI and on the coregistered color FA maps.

Example of anterior temporal WM (ATWM), brachium of inferior colliculus (BIC), decussation of the superior cerebellar peduncle (DSCP), and optic tracts (OT) ROIs in a patient with ALD on axial T1WI (A) and corresponding color FA map (B).

Example of genu of the corpus callosum (GeCC), posterior limb of the internal capsule (PLIC), and splenium of the corpus callosum (SpCC) ROIs in a patient with ALD on axial T1WI (A) and corresponding color FA map (B).

Typical normal-appearing frontal WM (NAFWM) and parieto-occipital WM (POWM) in a patient with ALD on T1WI (A) and color FA map (B).
For the purpose of examining DTI parameters in regions commonly having normal FLAIR signal intensity in patients with ALD, we defined a subset of our 19 ROIs as regions having normal-appearing WM, based on a review of our data base of patients with posterior-type ALD. This subset consisted of the following 5 regions: anterior temporal WM, cerebellar WM, decussation of the superior cerebellar peduncle, callosal genu, and normal-appearing frontal WM. Comparing DTI parameters from these regions in patients with those in control subjects was of particular interest.
MRI Severity Scoring
Two other staff neuroradiologists (D.L., D.N.) separate from the neuroradiologist performing DTI measurements, performed the MR imaging severity (Loes) scoring by using FLAIR and T2WI.8 These 2 neuroradiologists independently scored each MR image for each patient, thereafter jointly reaching consensus. Both readers were blinded to the DTI data.
Clinical Scoring
Clinical scoring consisted of evaluation by a team of neuropsychologists who obtained adaptive functioning, perceptual/visual-motor reasoning intelligence quotient, and verbal IQ scores at 2 points: before HSCT (T0) and 1 year after HSCT (T4); this team was blinded to the Loes scores, DTI data, and NFS data. Separately, an NFS was compiled retrospectively from clinical neurology and transplant records for all 5 time points (T0–T4) by a pediatric blood and marrow transplant clinician (W.P.M.) who was blinded to the Loes scores, DTI data, and neuropsychology data. The Appendix briefly describes the clinical scoring systems for both the NFS and the 3 neuropsychologic scores, adaptive functioning, perceptual/visual-motor reasoning IQ, and verbal IQ.
Statistical Evaluation
SAS (SAS Institute, Cary, North Carolina) was used for statistical analyses. MD and FA from each of the 19 tracts at each time, T0–T4, were compared with the same regions in control subjects by a 2-tailed t test. Thereafter, the Loes scores at T0 were correlated with clinical scores for NFS, adaptive functioning, perceptual/visual-motor reasoning IQ, and verbal IQ at T4 to confirm whether the Loes scores predicted clinical outcome, with the intent to validate that our data were not outliers compared with previous studies.5⇓⇓–8 The DTI parameters FA and MD in each region at T0 in the patients with ALD were then correlated with each clinical score (ΔNFS, Δadaptive functioning, Δperceptual/visual-motor reasoning IQ, and Δverbal IQ) at T4 to determine whether the regional DTI values were predictive of outcome. In addition, the changes in FA and MD (ΔFA and ΔMD) within each region from T0 to T4 were correlated with each change in clinical score (ΔNFS, Δadaptive functioning, Δperceptual/visual-motor reasoning IQ, and Δverbal IQ) from T0 to T4. Spearman correlation coefficient and P value were calculated, with a significance threshold of P < .05. Because of the multiple calculated comparisons, the “false discovery rate” method was used to adjust the P values to minimize spurious statistically significant results.18
Results
The mean ± SD age at time of HSCT for patients with ALD was 7.9 ± 1.55 years; the mean age at MR imaging of control subjects was 7.3 ± 1.04 years. In the 8 patients with ALD studied by DTI, the mean ± SD Loes score at T0 was 8.7 ± 4.99 (median, 11; range, 2–13). Of these, 6 stabilized, whereas 2 deteriorated in visual, auditory, or motor skills by 1 year (T4).
Comparisons of DTI Values in Patients and Control Subjects
Table 1 provides the P values when comparing regional DTI values in patients with ALD and control subjects. Before HSCT (T0), both FA and MD were significantly different in patients and control subjects within the cerebellar WM, medial geniculate, optic radiations, parieto-occipital WM, and callosal splenium (all P < .05). FA alone was significantly different in the anterior temporal WM, lateral geniculate, Meyer loop, and posterior limb of the internal capsule.
P values comparing MD and FA in each region in 8 patients with ALD versus control subjects at times T0–T4
After HSCT, both FA and MD of the callosal splenium were significantly different in patients compared with control subjects across all time points. FA of the cerebellar WM, optic radiations, and parieto-occipital WM were significantly different in patients compared with control subjects at all times. Table 2 summarizes, regarding FA and MD, which structures were significantly different in patients compared with control subjects at various time points. As expected, posterior WM areas showed significant differences in FA and MD before and after HSCT. In addition, significant alterations were consistently found in an unexpected region, the cerebellar WM.
Regions with DTI values significantly different from those of control subjects at each time point (T0–T4)
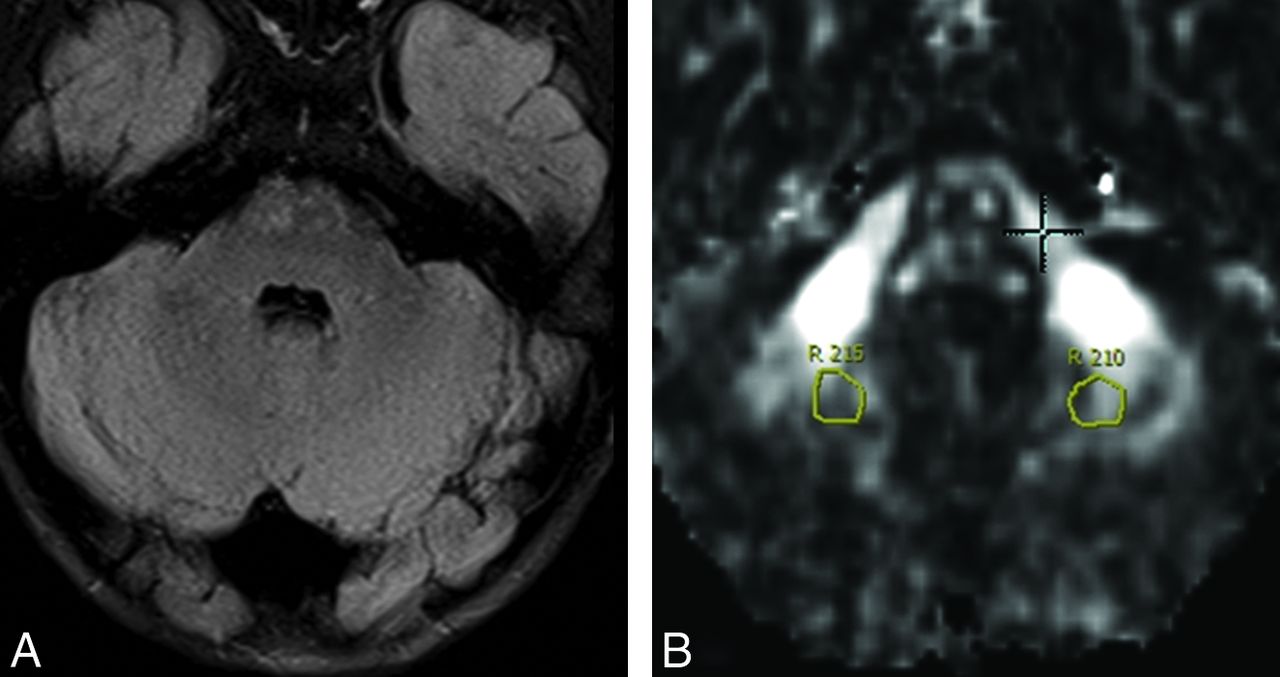
Regarding DTI parameters in the 5 WM regions that typically have normal signal intensity in ALD, we did indeed note visibly normal signal in these 5 regions at each time point in our 8 patients with ALD, but in 4 of the regions, at least 1 DTI parameter differed significantly from that in control subjects for at least 1 time point (Table 2): cerebellar WM (abnormal FA at all 5 time points, MD at 4 points; Fig 5), normal-appearing frontal WM (abnormal FA at the 3 intermediate time points), anterior temporal WM (abnormal FA at 1 point), and decussation of the superior cerebellar peduncle (abnormal MD at 1 point). The callosal genu did not exhibit abnormal FA or MD at any time point.

Eight-year-old patient with ALD with FLAIR image (A) depicting normal-appearing cerebellar WM (CWM) but abnormal DTI values before HSCT (at T0). A gray-scale FA map is provided (B). Within the CWM at T0, FA was 0.365 (mean in controls was 0.479 ± 0.085) and MD was 0.726 mm2/s (mean in controls was 0.699 ± 0.023 × 10⁻³). On follow-up MR imaging at 1 year after HSCT (T4), the cerebellar WM still appeared normal on FLAIR (not shown), whereas FA and MD remained abnormal (0.385 and 0.726 mm2/s, respectively).
Correlations of Loes Scores and Clinical Scores
As expected, pre-HSCT (T0) Loes scores strongly correlated with each clinical score 1 year after HSCT (T4), and the correlations were as follows: NFS, r = 0.889, P = .003; verbal IQ, r = 0.986, P < .001; perceptual/visual-motor reasoning IQ, r = −0.865, P = .012; and adaptive functioning, r = −0.771, P = .025.
Correlations of DTI Values and Clinical Scores
Pre-HSCT MD values did not predict the clinical scores at 1 year (all P > .05) in any region. On the basis of pre-HSCT DTI values, only FA in the callosal body at T0 predicted some form of clinical outcome at T4; only callosal body FA at T0 strongly correlated with adaptive function at T4 (r = 0.976, P < .001). Comparing ΔMD and ΔFA within the 19 regions with changes in the clinical scores, the only significant correlation was that ΔMD in the optic radiations correlated strongly with ΔNFS (r = 0.903, P = .038) (Table 3).
Correlations of the change in MD or FA with the change in clinical scores between times T0 (pre-HSCT) to T4 (1 year after HSCT)
Discussion
DTI Parameters as a Predictor of Clinical Outcome
The primary goal of our study was to determine the utility of DTI in predicting clinical outcome after HSCT. To assess this, we correlated pre-HSCT (T0) regional DTI measurements with various clinical scores at 1 year (T4). We found that callosal body FA at T0 was the sole DTI parameter to predict clinical outcome, predicting only adaptive functioning at T4. Thus, pre-HSCT DTI values were generally not predictive of the various clinical outcome measures at 1 year. Because it has already been shown that Loes scores measured pre-HSCT at T0 are predictive of eventual outcome, we propose several explanations for the lack of predictive ability of the pre-HSCT DTI values.5⇓⇓–8,10 First, the differences in the predictive values of Loes scores versus DTI may reflect fundamental differences between these 2 biomarkers; the Loes score is “global,” incorporates atrophy and extent of abnormality on T2WI/FLAIR, and typically does not improve, whereas DTI values may “focally” improve or worsen. Thus, it stands to reason that poorer Loes scores (ie, >9, on the basis of the literature) as measured pre-HSCT reflect poorer initial clinical states and thereby poor outcomes, whereas the degree of DTI abnormality in affected WM may not reflect permanent damage. In addition, DTI abnormalities could be transient or reversible, and therefore we may be able to detect subtle abnormalities that are not apparent on routine MR images. Hence, the Loes score is a “global” score that may be static and change slowly over time, whereas DTI values are “regional” and more likely to be dynamic because these are subject to focal influences that are not apparent on FLAIR, such as subtle vasogenic edema or potentially even myelin repair (Fig 6 illustrates improving splenial FA but clinical progression after HSCT).5⇓⇓–8 For example, preliminary data have shown that ADC values fluctuate to a large degree at the edge of disease for several months after HSCT in ALD (B. Yonke, unpublished data, 2006).19 We provide an example of visibly apparent fluctuation in diffusivity in one of our patients with ALD after HSCT (Fig 7). Because the goal of HSCT is to stabilize disease, the higher correlation produced by a static biomarker such as the Loes score seems reasonable. Other explanations for the lack of a predictive value of DTI could be that DTI measurements are affected by either 1) interobserver differences or 2) inaccuracies due to background noise. Neither factor was accounted for by this study.

Example of Loes scores, but not DTI values, predicting clinical outcome in our patients with ALD. A, FLAIR image obtained before HSCT (at T0) shows prominent hyperintense abnormalities within posterior WM structures. The Loes score was 12; a score >9 is generally considered to be predictive of poor neurologic outcome. FA within the splenium was 0.190 (mean 0.823 in controls), and MD was 2.352 × 10⁻³ mm2/s (mean 0.815 in controls); the NFS at T0 was 0 (no deficits). B, Axial FLAIR image 1 year after HSCT (at T4) shows extension of hyperintense abnormality further anteriorly into the temporal lobes and posterior limbs of the internal capsules with onset of moderate posterior atrophy. The NFS at this time was 11; interestingly, splenial FA and MD improved slightly to 0.240 and 2.184 × 10⁻³ mm2/s, respectively. Although baseline DTI values were markedly abnormal, they did not serve to predict NFS at 1 year for our group of patients with ALD, whereas initial Loes scores were predictive.

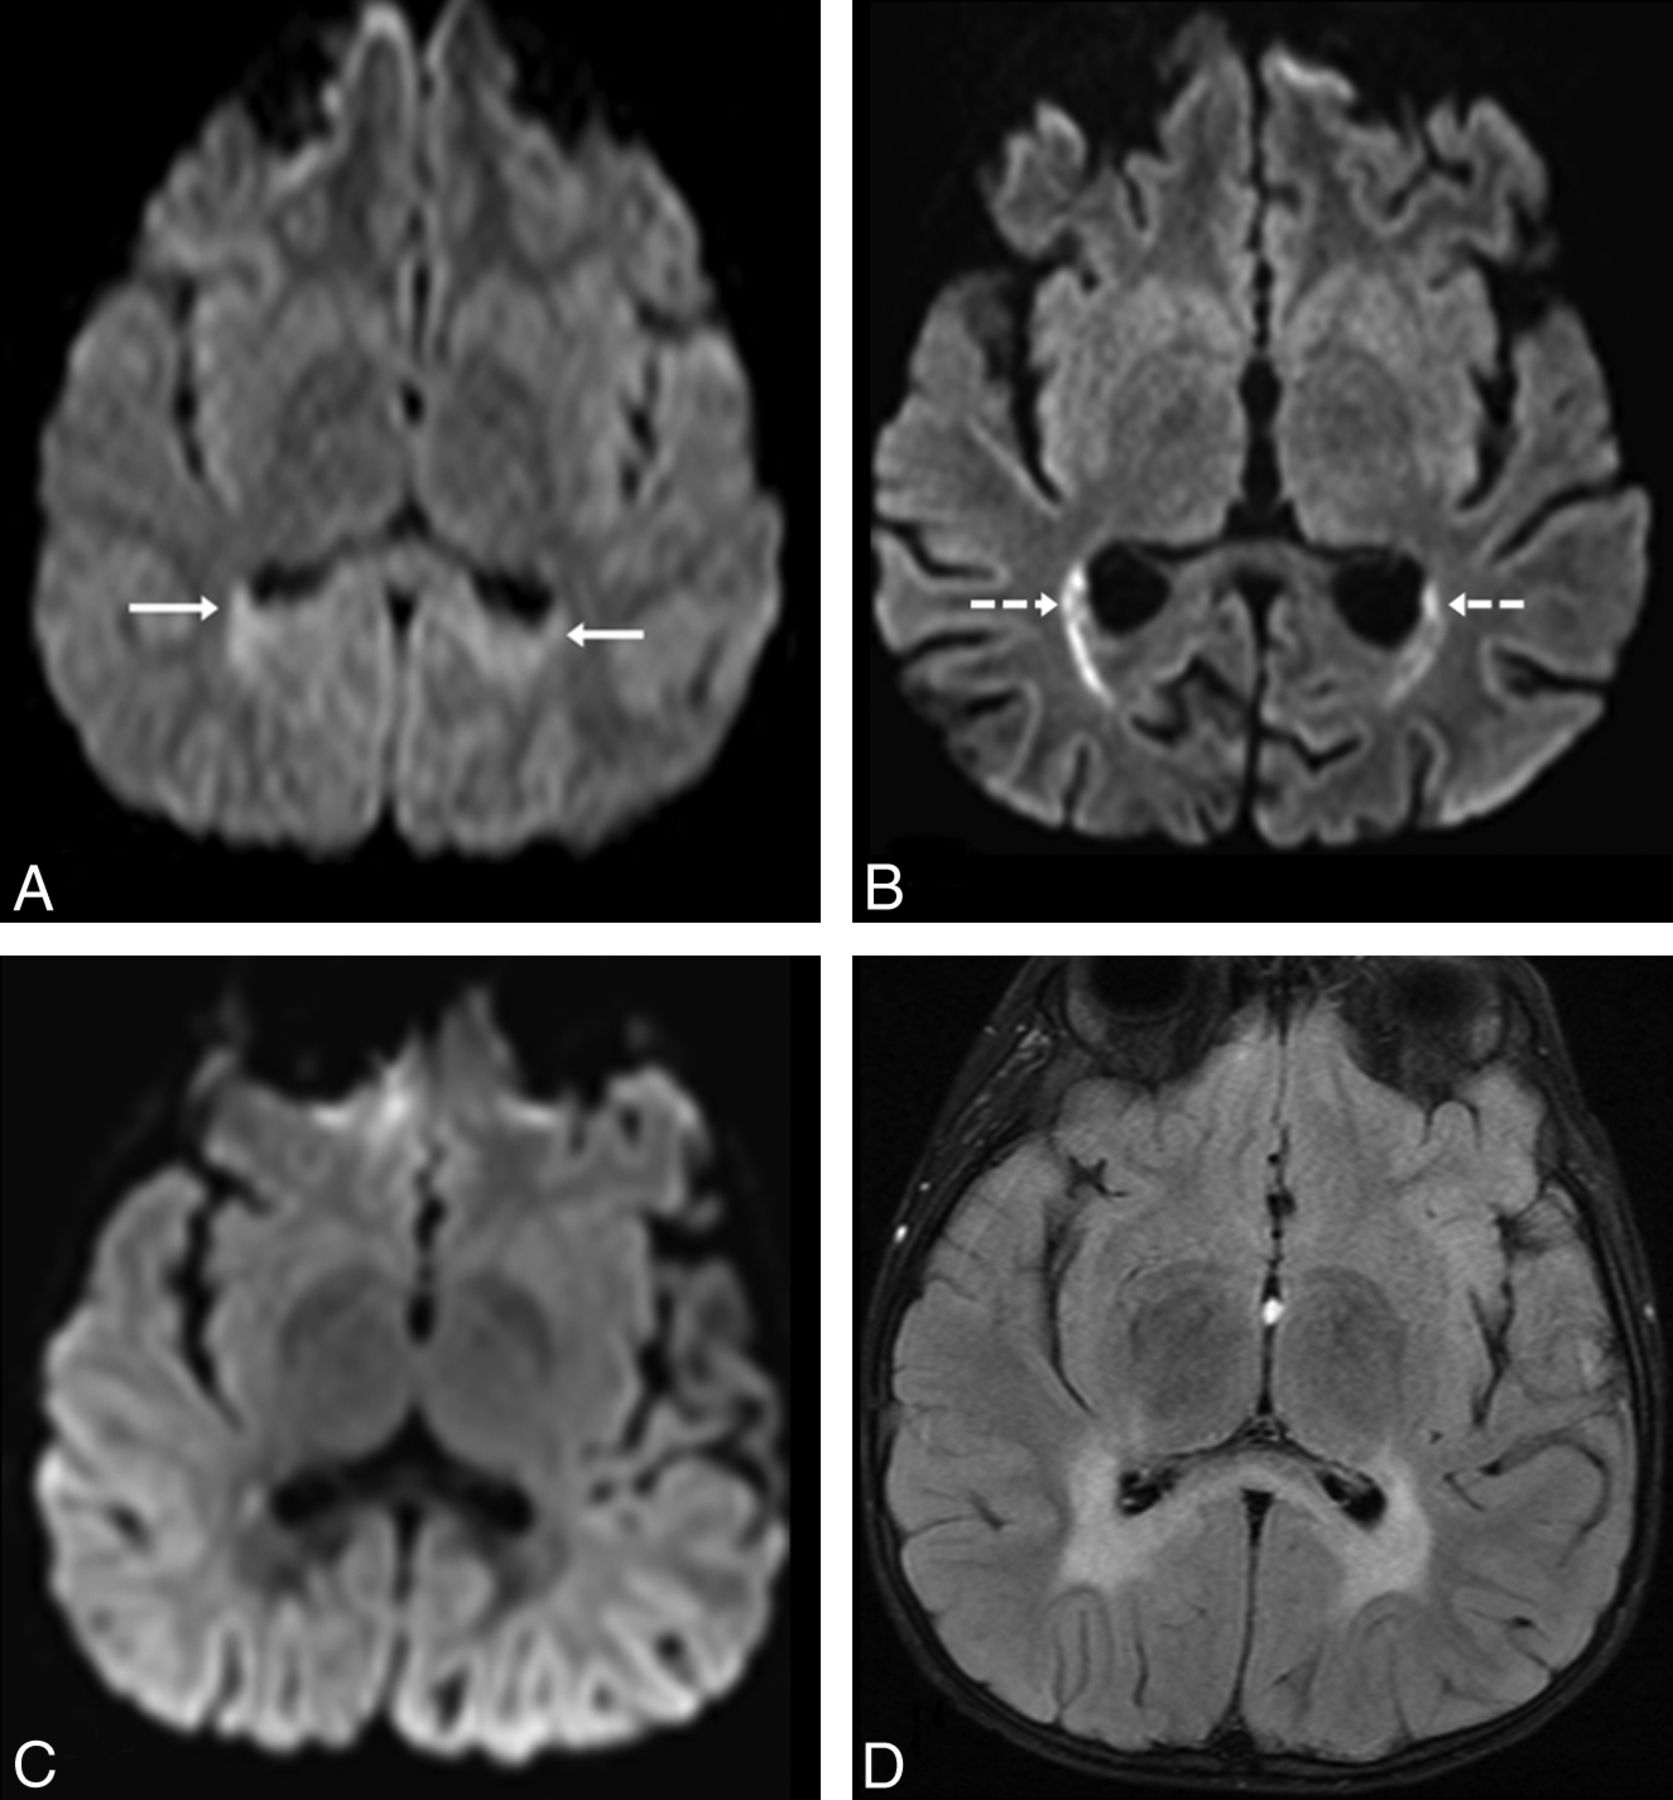
Example of how diffusivity can be seen to fluctuate on routine DWI, in a 6-year-old patient with ALD. At T0, 2 weeks before HSCT, the patient had mild parieto-occipital WM hyperintensity (arrows) on routine 3T DWI (A), related to “T2 shine through.” On DWI 2.5 months after HSCT (B), there is increasingly reduced diffusion in the optic radiations (dashed arrows), confirmed on ADC maps (not shown). At 1 year after transplantation (T4), there is no visibly reduced diffusion on DWI (C), whereas the abnormalities on FLAIR (D) have stabilized. It is noteworthy that this patient's symptoms had not worsened by the 1- and 2-year follow-up clinic visits.
Our findings can be compared with those in other WM diseases of childhood. For example, our finding that DTI values within the optic radiations correlated strongly with ΔNFS suggests that patients who have received HSCT have better outcomes when there are fewer DTI abnormalities at the edge of disease at baseline. These findings would appear to agree with previous results in patients with Krabbe disease, where higher corticospinal tract FA before HSCT correlated with better outcomes as well as a slower rate of decreasing FA after HSCT.20,21 It is noteworthy that infants with Krabbe disease who received transplants earlier exhibited FA values that declined less rapidly, eventually exhibiting FA values similar to those of healthy children; they also developed fewer neurologic symptoms.20,21
DTI Parameters in Abnormal WM
Comparing DTI parameters in abnormal WM regions (on FLAIR) in patients with ALD and control subjects, we found significant differences between the 2 groups in a number of regions, particularly the callosal splenium (the most consistently abnormal structure), optic radiations, and parieto-occipital WM. Because these regions are located posteriorly, it is not surprising that DTI measurements in these locations would be abnormal in posterior-variant ALD. Several other regions also exhibited abnormal signal intensity and significantly different DTI values at certain time points relative to control subjects. Examples include the medial and lateral geniculate nuclei and the Meyer loop, all of which had DTI abnormalities to some degree at nearly all time-points, even before HSCT.
Abnormal DTI Parameters in Normal-Appearing WM
We found that several normal-appearing regions in patients with ALD had abnormal DTI parameters compared with control subjects. It is noteworthy that one such region was the cerebellar WM, which appeared normal on FLAIR in all 8 of our patients with ALD studied by DTI (Fig. 5), yet cerebellar WM lesions on FLAIR or T2WI are found initially in <3% of patients with childhood cerebral ALD.8 We found significantly decreased FA at all time points within this region, and to our knowledge, DTI abnormalities within normal-appearing cerebellar WM have not yet been described in ALD. Such cerebellar WM DTI abnormalities may represent a subclinical finding that worsens in untreated patients (becoming more visible on FLAIR as the disease progresses) or could be secondary to insults situated more cephalad in the neuraxis (eg, an atrophy-type phenomenon akin to “diaschisis”).
In addition, normal-appearing frontal WM exhibited normal FA and MD values before HSCT (at T0) and at 1 year (T4), but FA was abnormal after HSCT at the intermediate time points T1–T3. There are few reports of DTI findings in normal-appearing WM in ALD, and these are inconclusive. For instance, 2 studies found no significant difference regarding FA in such regions of patients with cerebral ALD versus control subjects, whereas a third study found significant differences; MR spectroscopy has variably noted abnormalities in such regions.13⇓–15,22 The fact that our study found abnormal FA only at the intermediate times T1–T3 suggests that this phenomenon may be transient, raising several possibilities. First, it could relate to stabilization of subtle disease in normal-appearing WM (on FLAIR) that would have otherwise progressed anteriorly, which is the natural course of untreated ALD.5⇓–7 Second, this phenomenon could be a transient post-HSCT finding related to fluctuations in diffusivity at or anterior to the edge of disease, as mentioned previously (Fig 7).19 Third, transient WM toxicity could also be a cause, possibly as a result of the toxic effect of immunosuppressive medications used for HSCT.23,24 In aggregate, the presence of DTI abnormalities in regions of normal signal intensity on FLAIR may indicate that the disease extent in cerebral ALD is greater than is evident on routine MR images.
Changes in DTI Parameters after HSCT
We were able to assess whether regions with abnormal DTI values become less abnormal on sequential imaging after HSCT, in an attempt to detect amelioration of affected WM regions. However, the predominant finding was persistently abnormal FA within certain regions at 1 year after transplantation, such as the callosal splenium, optic radiations, and parieto-occipital WM, which suggests that there are potentially irreversible abnormalities within certain myelinated structures. At this point, the relationship between the duration of signal-intensity abnormalities and their potential for reversibility is poorly understood. Likewise, little, if anything, is known about the degree or duration of abnormality of a DTI parameter in a region before it develops FLAIR hyperintensity. These unresolved questions could potentially be answered by higher-resolution DTI studies performed with prospective serial imaging.
Correlation of Loes Scores with Clinical Findings
We performed correlations between Loes scores and clinical scores to confirm that our patients' clinical outcomes were not outliers and thus were similar to those in previous studies in which the Loes scores before HSCT were shown to correlate with long-term neurologic outcomes (as determined by the NFS and several neuropsychologic scores).4⇓⇓⇓–8 In this regard, the pre-HSCT Loes scores (at T0) strongly correlated with each of the clinical scores (ie, NFS, adaptive functioning, perceptual/visual-motor reasoning IQ, and verbal IQ) at 1 year (T4), as expected. Thus, our data and outcomes, albeit with a small sample size, do not seem to be outliers relative to the previous literature.
Limitations
There are several other limitations of this study. First, our study included a relatively small number of patients, which is related 1) to the fact that ALD is a relatively rare disease and 2) to our stringent inclusion criteria. Second, only patients with lower Loes scores (ie, mild to moderate range of MR imaging severity) and the more common “posterior-variant” were included (typical protocols used to select patients for HSCT); thus, our results cannot be extrapolated to more severely affected patients with cerebral ALD or to those with “frontal-variant” disease.5⇓⇓–8,10 Third, we followed patients for only 1 year after transplantation; it could be argued that serial imaging and clinical outcomes in patients with ALD should be obtained for at least 2 years after transplantation to absolutely confirm their clinical outcome. In this regard, we note that many of the MR images obtained at >1 year after HSCT in our patients with ALD were performed at other facilities and without DTI (in large part because of the expense of long-distance travel, often from other states), and thus we were not able to routinely obtain DTI data at >1 year after transplantation. Fourth, because of software limitations, we could not measure the principal eigenvalues, which would have enabled further DTI analyses, such as axial and radial diffusivity. Fifth, another postprocessing limitation is that the software inherently corrects for motion artifacts or eddy currents, which could introduce error into the data. In addition, certain DTI postprocessing tools can use spatial normalization of the group to a common template, thereby minimizing interobserver variability, which we did not employ. Sixth, we could have included a greater number of control subjects to decrease error in the control data; however, in this regard, an increase in the number of control subjects would theoretically decrease the variance in differences between the patients with ALD and the control subjects, which could potentially reveal other significant differences between the 2 groups, and thus should not render invalid the significant differences we found. Seventh, the control subjects were not matched to the patients with ALD based on IQ, which could also theoretically influence DTI parameters. Finally, our evaluation of certain regions may have been limited by unreliability in measuring small structures, particularly those situated immediately adjacent to CSF, such as the lateral and medial geniculate nuclei, and the optic tracts.
Conclusions
We found that baseline DTI parameters measured in patients with childhood cerebral ALD before HSCT (at T0) were generally poor predictors of clinical outcome at 1 year (T4) after HSCT, whereas, as expected, baseline Loes scores do predict eventual outcome. However, ΔMD within the optic radiations over the first year after HSCT is correlated quite strongly with ΔNFS. A secondary finding in this study was that a number of regions with normal signal intensity on FLAIR images, such as cerebellar WM, consistently exhibited abnormal DTI values, which may represent evidence that DTI can detect subtle abnormalities that are not evident on conventional MR imaging. This finding deserves further assessment in future studies that are prospective and include a larger number of patients.
Appendix
Clinical Neurologic Function Scoring
Neuropsychologic Testing
Note that all measures yield age-based standardized scores with the same statistical properties (M = 100, SD = 15), allowing for comparison across tests.
Verbal IQ.
This score reflects verbal intelligence, or verbal cognitive ability, which describes the way in which one reasons with words and acquires language-based knowledge. It was obtained with one of the following measures: the Wechsler Intelligence Scale for Children, 4th edition (WISC-IV),25 Wechsler Preschool and Primary Scale of Intelligence, 3rd edition (WPPSI-III),26 or Wechsler Abbreviated Scale of Intelligence (WASI).27
Perceptual/Visual-Motor Reasoning IQ.
“Performance IQ.” This score reflects nonverbal intelligence, or visual-perceptual and visual-motor processing, which describes the way in which one reasons visually and coordinates visual information with motor responses. It was obtained with one of the following: WISC-IV, WPPSI-III, WASI, or the Beery-Buktenica Developmental Test of Visual-Motor Integration.28
Adaptive Functioning.
This score reflects adaptive functioning, or the level at which the child carries out age-appropriate life skills on a day-to-day basis. It was obtained through a semistructured parent interview with the Vineland Adaptive Behavior Scales, 2nd edition.29
Footnotes
Disclosures: Alexander McKinney—UNRELATED: Board Membership: Vital Images, Toshiba, Minnetonka, Minnesota, Comments: Medical advisory board member. Julie Eisengart—RELATED: Travel/Accommodations/Meeting Expenses Unrelated to Activities Listed: Shire Pharmaceuticals, Comments: One additional night of accommodations following attendance at the Rare Disease Clinical Research Network conference in Washington, DC. The conference was NIH-sponsored. The purpose of the additional night of accommodations was to attend a meeting after the conference between Shire and my place of employment, the University of Minnesota. At the time, I was a trainee and therefore only observed the meeting (I was not specifically paid for providing any services or consultancy) and did not actively participate in discussions. Daniel Loes—UNRELATED: Board Membership: Suburban Radiologic Consultants, Comments: I am a board member for my private practice group, Suburban Radiologic Consultants. Consultancy: St. Jude's Medical, Comments: I am a paid consultant on a clinical events committee regarding a trial on an atrial appendage closure device. Employment: Suburban Radiologic Consultants Ltd, Comments: This is my full-time private practice radiology position. Paul Orchard—UNRELATED: Consultancy: Bluebird Bio, Comments: Bluebird Bio is a tech company that is going to be submitting a clinical trial to the FDA, and before that they wanted data related to the natural history of the disease (ALD) and outcomes with treatment. They contracted with a number of institutions to gather data for this effort, including the University of Minnesota. This contract funding provided support for personnel time in gathering the data. I had no direct support, salary, etc, nor directed funding to my lab.
Paper previously presented in part at: Annual Meeting of the American Society of Neuroradiology, June 4–9, 2011; Seattle, Washington.
This work was supported by grant 1UL1-RR033183 from the National Center for Research Resources of the National Institutes of Health to the University of Minnesota Clinical and Translational Science Institute (CTSI). Its contents are solely the responsibility of the authors and do not necessarily represent the official views of CTSI or the National Institutes of Health. University of Minnesota CTSI is part of a national Clinical and Translational Science Award consortium created to accelerate laboratory discoveries into treatments for patients.
Indicates open access to non-subscribers at www.ajnr.org
References
- Received February 7, 2012.
- Accepted after revision May 27, 2012.
- © 2013 by American Journal of Neuroradiology


