
Abstract
BACKGROUND AND PURPOSE: Tumor location is a significant prognostic factor in glioblastoma, which may reflect the genetic profile of tumor precursor cells. The purpose of the current study was to construct and analyze probabilistic radiographic atlases reflecting preoperative tumor locations and corresponding demographic, “-omic,” and interventional phenotypes to provide insight into potential niche locations of glioblastoma cells of origin.
MATERIALS AND METHODS: Preoperative anatomic MR images in 507 patients with de novo glioblastoma were analyzed. Images were registered to stereotactic space, tumors were segmented, and the stereospecific frequency of tumor occurrence was analyzed statistically by age, extent of resection, MGMT methylation, IDH1 mutation, gene expression subclassification, PTEN loss, PTEN deficiency, EGFR amplification, EGFR variant 3 expression, progression-free survival from the start of radiochemotherapy, and overall survival from initial diagnosis.
RESULTS: Most glioblastomas grow into the periventricular white matter regions adjacent to the subventricular zone. MGMT promoter methylated tumors occur more frequently in the left temporal lobe, in young patients with glioblastoma, in IDH1 mutant tumors, in tumors having the proneural gene expression subtype, and in tumors lacking loss of PTEN occurring most frequently in the frontal lobe. MGMT methylated tumors with the IDH1 mutation tended to occur in the left frontal lobe. EGFR amplified and EGFR variant 3-expressing tumors occurred most frequently in the left temporal lobe. A similar region in the left temporal lobe was associated with favorable response to radiochemotherapy and increased survival.
CONCLUSIONS: Radiographic atlases for specific phenotypes provide insight into overlap between prognostic variables and may help to identify niche locations for cancer cells of origin.
ABBREVIATIONS:
- ADIFFI
- analysis of differential involvement
- EGFR
- epidermal growth factor receptor
- IDH1
- isocitrate dehydrogenase 1
- MGMT
- O6-methylguanine methyltransferase
- PTEN
- phosphatase and tensin homolog
- T1+C
- postcontrast T1-weighted image
Identifying brain tumor precursor cells and their “-omic” signatures is a major challenge in the field of neuro-oncology that holds tremendous promise for increasing survival by customizing treatment paradigms. Evidence suggests that tumor location plays an important role in prognosis1 and is likely linked to the genetic profile of tumor cells of origin.2,3 In support of this hypothesis, region-specific brain tumor cells of origin have been identified in oligodendrogliomas,4 medulloblastomas,5 and ependymomas,6 and compelling evidence has suggested that this is the case for IDH1 mutated gliomas.7 Further, studies have identified clear links between radiologic features, including the volume and extent of edema and/or invasion8 as well as contrast enhancement,9 and -omic signatures. On the basis of these findings, we have constructed a set of radiographic atlases specifying the probability of tumor location and volumetric information for important demographic, -omic, and interventional phenotypes, with the goal of providing new insight into the possible niche locations of cells of origin in glioblastoma. The radiographic atlases of glioblastoma phenotypes presented in the current study quantify the probability of tumor occurrence in 507 glioblastomas stratified by age, extent of resection, MGMT promoter methylation, IDH1 mutation, gene expression subclassification, PTEN loss, PTEN deficiency, EGFR amplification, EGFR variant 3 expression, time to progression from the start of radiochemotherapy, and overall survival from initial diagnosis, along with some interactions between these phenotypes.
Materials and Methods
Patients
Five hundred seven patients with de novo histologically confirmed glioblastoma between April 2000 and December 2011 were enrolled in the current retrospective, institutional review board–approved, Health Insurance Portability and Accountability Act–compliant study. All patients had presurgical T2/FLAIR and postcontrast T1-weighted images available. Subsets of these patients were used in other studies.7,10,11 The extent of resection was noted for the initial surgery. Overall survival was defined as the time from initial pathologic diagnosis until death.
MR Imaging
Data were collected on either a 1.5T or 3T MR imaging scanner. Standard anatomic MR imaging sequences consisted of T2-weighted FSE or FLAIR images, and gadolinium-diethylene-triamine pentaacetic acid– (Magnevist; Berlex, Wayne, New Jersey; 0.1 mmol/kg) or gadobenate dimeglumine– (MultiHance; Bracco, Milan, Italy; 0.1 mmol/kg) enhanced axial T1-weighted images (ie, T1+C). All images were 3- to 5-mm thick with a 0- to 1-mm intersection gap.
Image Registration
All images for each patient were registered to a 1.0-mm isotropic brain atlas (Montreal Neurological Institute 152) by using a mutual information algorithm and a 12 df transformation by using the Functional MR Imaging of the Brain Software Library (http://www.fmrib.ox.ac.uk/fsl/) followed by visual inspection and a consensus by 2 independent raters (W.B.P. and B.M.E.) to ensure adequate alignment.
ROIs
After image registration, T2/FLAIR and T1+C images were segmented by using a semiautomated procedure previously documented.10,12 Briefly, the general regions of tumor on T2/FLAIR and T1+C images were first defined manually. Then, T2/FLAIR and T1+C images were thresholded by using an empiric threshold combined with a region-growing algorithm confined to the manually defined ROIs in the first step. Last, tumor regions were manually edited to exclude any obvious errors in segmentation. Regions of central necrosis were included in the study to outline the entire extent of the tumor. Tumor volume was calculated with respect to preregistration image resolution.
ADIFFI
ADIFFI analysis consisted of first constructing a 2 × 2 contingency table comparing 2 differential phenotypes (eg, phenotypes A and B) and tumor versus nontumor for each image voxel. Next, a 2-tailed Fisher exact test was performed on a voxelwise basis. According to the Fisher exact test, the probability of obtaining an observed pattern in the 2 × 2 contingency table is given by
 where a is the frequency of tumor occurrence in a particular voxel for phenotype A; b, the frequency of tumor occurrence in a particular voxel for phenotype B; c, the frequency of no tumor occurring in a particular voxel for patients with phenotype A; d, the frequency of no tumor occurring in a particular voxel for patients with phenotype B; n, the total number of patients included; and the exclamation point represents the factorial operation. To calculate the significance of the observed pattern in the contingency table corresponding to the total probability of observing a pattern in the contingency table as extreme or more extreme, we recalculated the P value from each voxel for all cases in which the marginal totals were the same as the observed tables and only for cases in which the arrangement was as extreme as the observed pattern. We performed this iteratively so that the values were incremented to calculate a more extreme pattern, adding the previous P value in each image voxel each time until the most extreme pattern was achieved (which may vary from voxel to voxel). The final P value represents the probability of observing the given pattern in the contingency table by chance. P < .05 was considered significant. Additional details are presented in a previous publication.10
Correction for Cluster Size by Using Random Permutations
A cluster-based permutation correction was performed as outlined by Bullmore et al.13 A total of 500 permutations were performed, the resulting ADIFFI-defined clusters were retained, and the 95% confidence intervals for significant cluster size occurring by chance were documented for each phenotype. The cluster-size thresholds used for each phenotype had a <5% probability of occurring by chance.
Molecular and Genetic Analysis
MGMT methylation analysis was performed by methylation-specific polymerase chain reaction or real-time methylation-specific polymerase chain reaction (LabCorp, Santa Monica, California), according to previously published protocols.10,14,15 IDH1 mutation status was determined by subjecting DNA to amplification by polymerase chain reaction by using primers specific for the IDH1 gene, followed by DNA sequencing analysis of a region surrounding codon 132 as described in Lai et al.7 Gene-expression subclassification was performed according to standard protocols and categories.16 EGFR amplification was performed by the UCLA Cytogenetics Laboratory (Los Angeles, California) by using fluorescence in situ hybridization (Abbott/Vysis, Des Plaines, Illinois; LSI EGFR/CEP7 probe cocktail specific for the 7p12 EGFR locus and centromere of chromosome 7). The PTEN copy number was analyzed by using fluorescence in situ hybridization (Abbott/Vysis; LSI PTEN/CEP10 probe cocktail specific for the 10q23 PTEN locus and centromere of chromosome 10). PTEN deficiency was determined by immunohistochemistry (Sarkaria Biomarker Innovations Laboratory or Brain Tumor Translational Resource at UCLA, Los Angeles, California) by using standard protocols.17 Tissue sections were stained with monoclonal antibodies for PTEN (clone 6H2.1; Cascade Bioscience, Winchester, Massachusetts). EGFR variant 3 expression was determined by immunohistochemistry17 or real-time polymerase chain reaction.18
Time to Progression for Radiochemotherapy Interventional Phenotype
Patients treated with upfront radiochemotherapy (radiation therapy and concomitant TMZ temozolomide followed by adjuvant TMZ temozolomide as described by Stupp et al19) showing progression before the last date of censorship (n = 374) were stratified on the basis of the time to treatment failure. Centralized review of progression-free survival was performed for all patients with available scans as previously described.7,10 The date of death was used as the data of progression if the patient had a stable scan finding <2 months before death.
Results
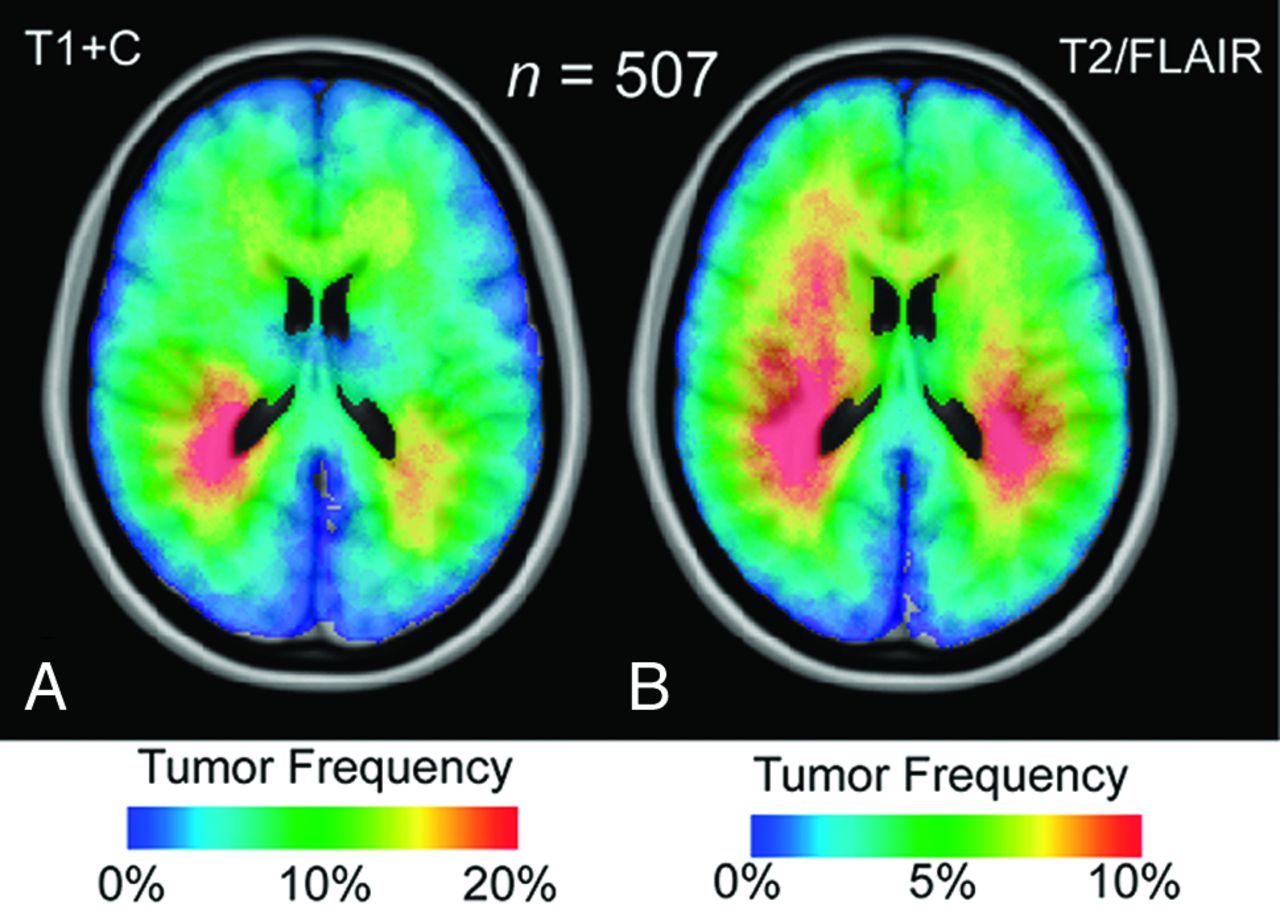
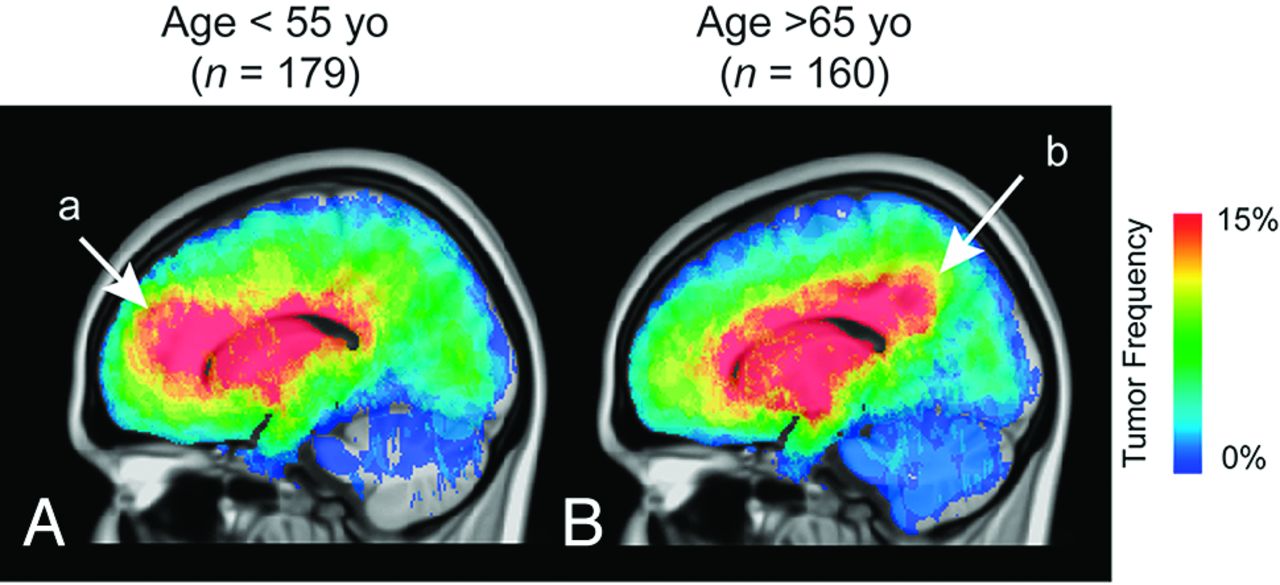
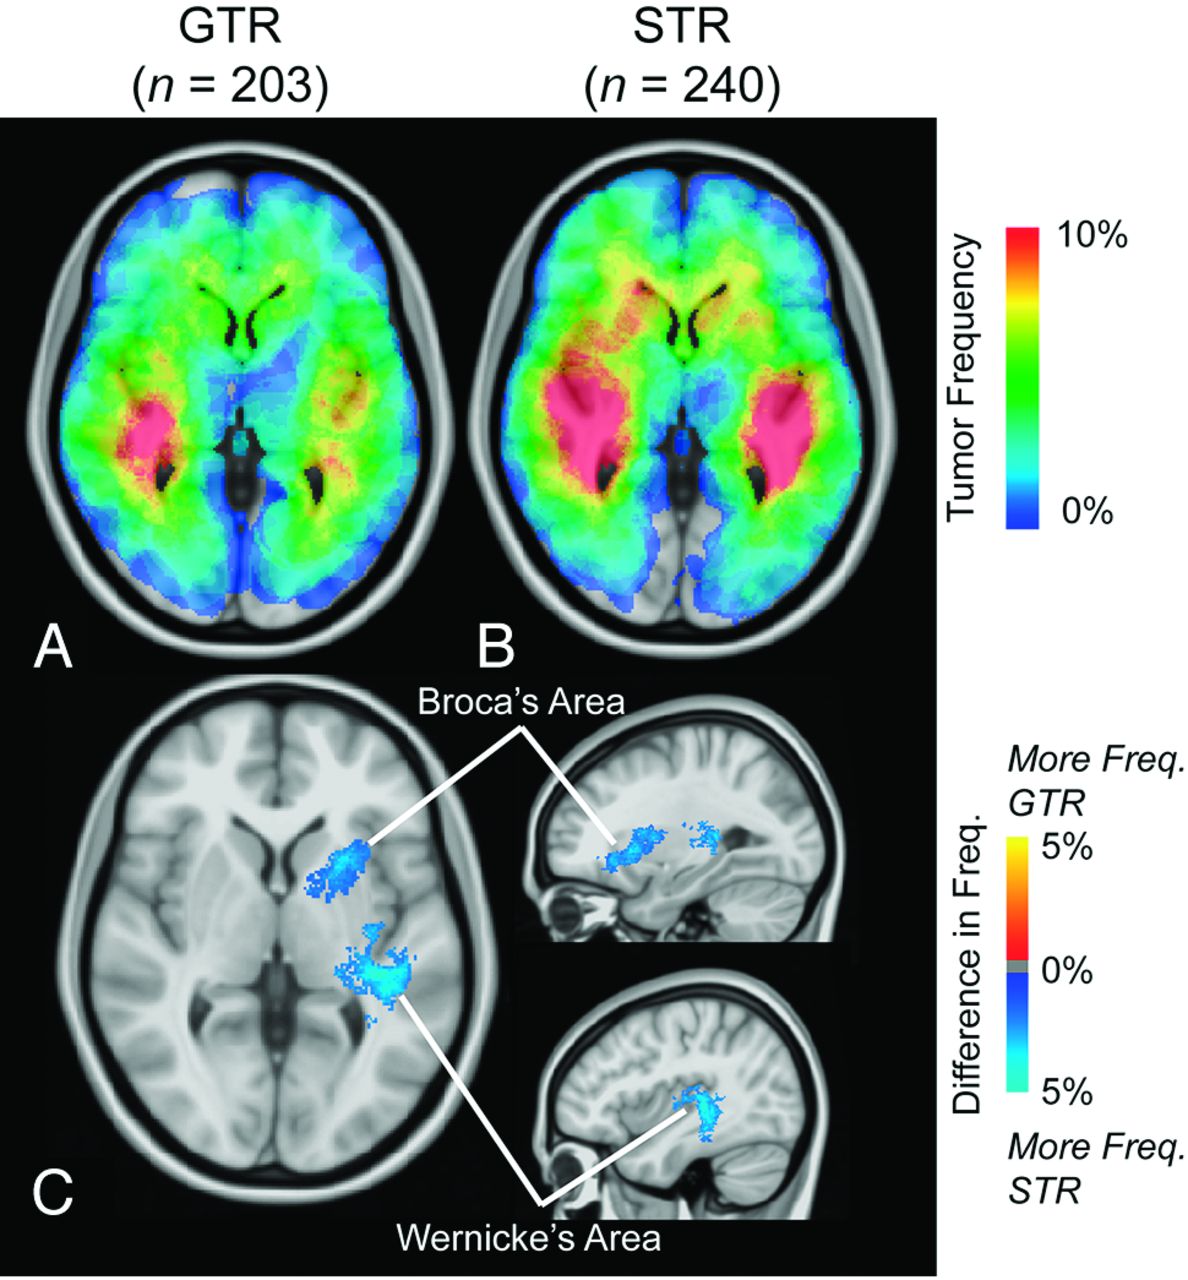
A substantial number of glioblastomas grew into the periventricular white matter regions adjacent to the subventricular zone (Fig 1A, -B), and 91.9% of glioblastomas had T2/FLAIR signal abnormality contiguous with the ventricular system. Tumor frequency results stratified by age suggested frontal lobe predominance in younger patients (a in Fig 2A) compared with older patients (b in Fig 2B). ADIFFI statistical analysis performed on glioblastomas stratified by the extent of resection (gross total resection versus subtotal resection) identified a single spatially distinct cluster encompassing both Broca and Wernicke areas that was statistically more likely to be subtotal resection (Fig 3).

Atlas of all glioblastoma locations. Frequency of glioblastoma occurrence for contrast-enhancing (T1+C) (A) and T2/FLAIR (B) hyperintense lesions in 507 patients. Regions with the highest tumor frequency occur in the periventricular white matter regions adjacent to the subventricular zone.

Atlas of glioblastoma location by patient age. Stratification of glioblastoma tumor location by age shows a high incidence in the frontal lobe in younger patients (a in A) in contrast to the high incidence in more posterior regions in older patients (b in B). T2/FLAIR tumor frequency is illustrated.

Atlas of glioblastoma location for different extents of resection. Frequency of T1+C tumor occurrence for gross total resection (GTR, n = 203) (A) and subtotal resection (STR, n = 240) (B). C, ADIFFI statistical analysis illustrates a single significant cluster (contiguous, out of plane) occurring at a high frequency in patients with STR, encompassing both Broca and Wernicke areas. T1+C tumor frequency is illustrated.
MGMT Promoter Methylation and IDH1 Mutation
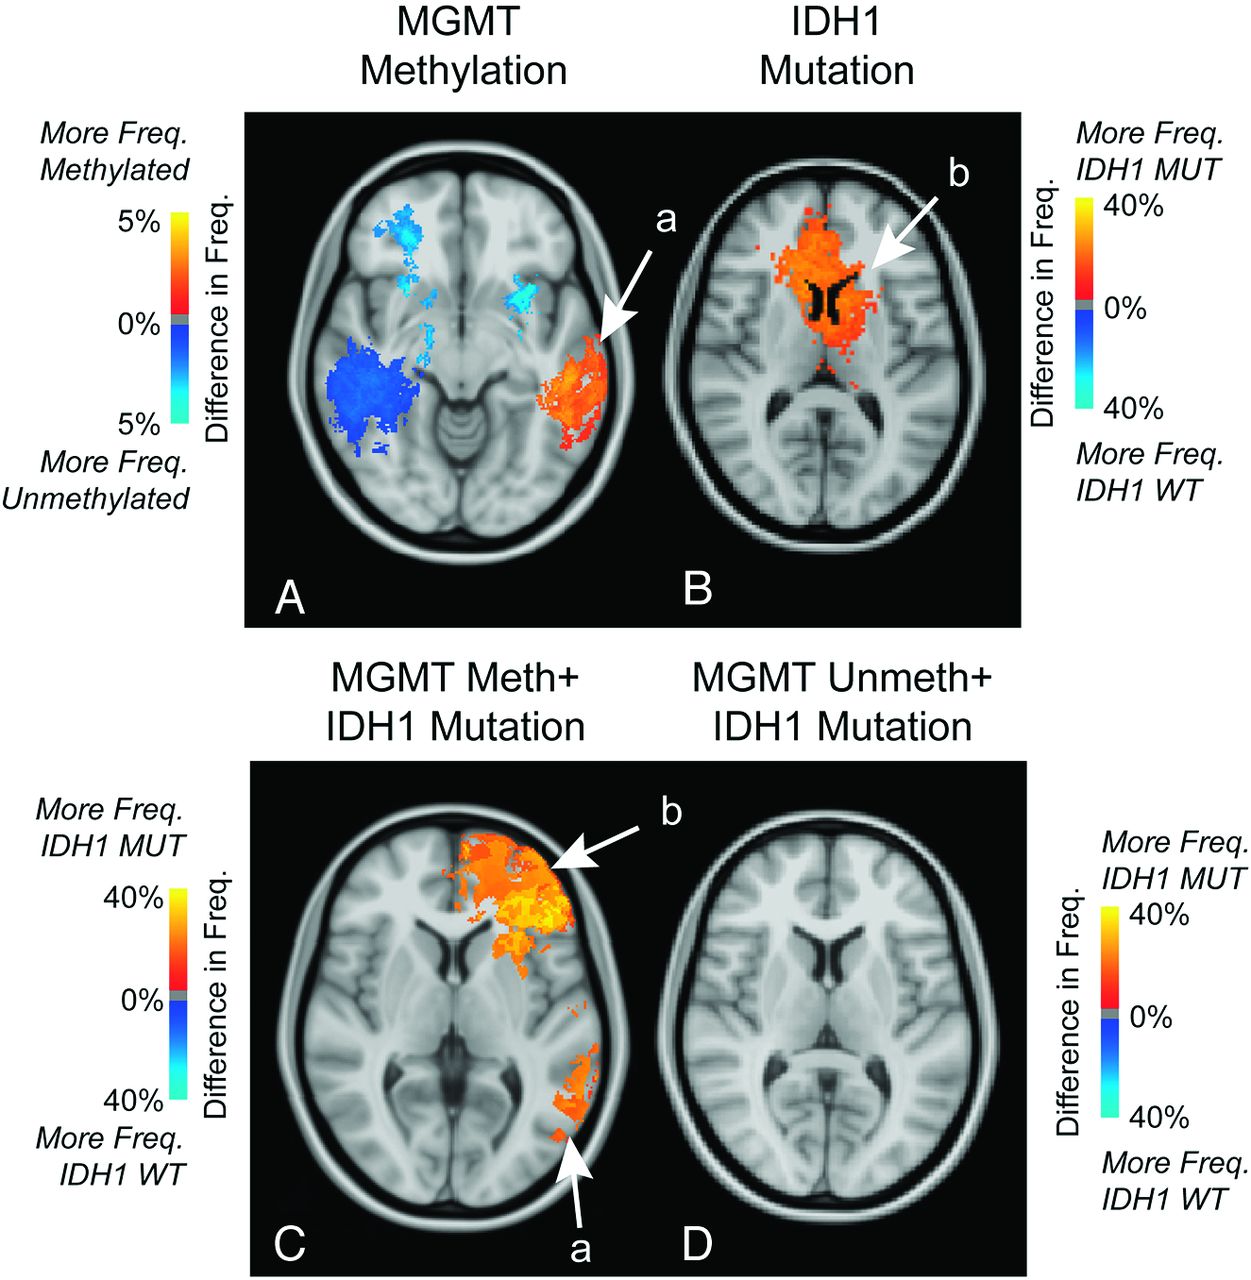
Four hundred thirty-three patients had MGMT promoter methylation data available, for which 38% had MGMT promoter methylation. A subset of patients was also included from a previous study investigating MGMT promoter methylation.10 ADIFFI analysis of glioblastomas based on MGMT promoter methylation status identified a cluster in the right temporal lobe as most frequently associated with MGMT promoter unmethylated tumors and a similar cluster in the left temporal lobe most frequently associated with MGMT promoter methylated tumors (a in Fig 4A), similar to previous data.10 MGMT promoter methylated tumors had a lower volume of contrast enhancement (Fig 4C; t test, P = .038) and T2/FLAIR hyperintensity (Fig 4C; t test, P = .004) compared with unmethylated tumors. Four hundred patients with glioblastoma had IDH1 mutation status information available, for which 8.5% of glioblastomas were IDH1-mutated. A spatially distinct region in the frontal lobe occurred at a significantly higher frequency in IDH1-mutant tumors (Fig 4B), similar to previously presented data.7 IDH1 wild-type glioblastomas had larger volumes of contrast enhancement (Fig 5B; t test, P = .005) but no difference in T2/FLAIR volume (Fig 5B; t test, P = .645). ADIFFI statistical analysis of the interaction between MGMT and IDH1 phenotypes identified 2 independent clusters when IDH1 mutation status was compared within MGMT promoter methylated tumors in similar locations with the independently analyzed MGMT and IDH1 phenotypes (Fig 4C). No statistically significant clusters were identified when comparing IDH1 mutation status within MGMT unmethylated tumors (Fig 4D).

Atlases of MGMT promoter methylation, IDH1 mutation, and the interaction between MGMT methylation and IDH1 mutation. A, ADIFFI statistical analysis for MGMT methylation status illustrating cluster a in the left temporal lobe corresponding to regions with a significantly higher frequency of MGMT promoter methylated tumors (methylated [n = 269] and unmethylated [n = 164]). B, ADIFFI analysis for IDH1 mutation status illustrating a significant cluster b in the frontal lobe, corresponding to regions with a significantly higher frequency of IDH1 mutant (MUT) tumors (IDH1 MUT [n = 34] and IDH1 wild-type [WT] [n = 366]). C, ADIFFI statistical analysis for IDH1 mutation status within MGMT promoter methylated tumors illustrates both cluster a in the temporal lobe and cluster b in the frontal lobe as having a significantly higher frequency of IDH1 mutant tumors (MGMT methylated + IDH1 MUT [n = 15] and MGMT methylated + IDH1 WT [n = 139]). D, ADIFFI statistical analysis for IDH1 mutation status within MGMT promoter unmethylated tumors did not show any significant difference between topographic location of IDH1 MUT and WT tumors (MGMT unmethylated + IDH1 MUT [n = 10] and MGMT unmethylated + IDH1 WT [n = 217]). FLAIR tumor frequency is illustrated.

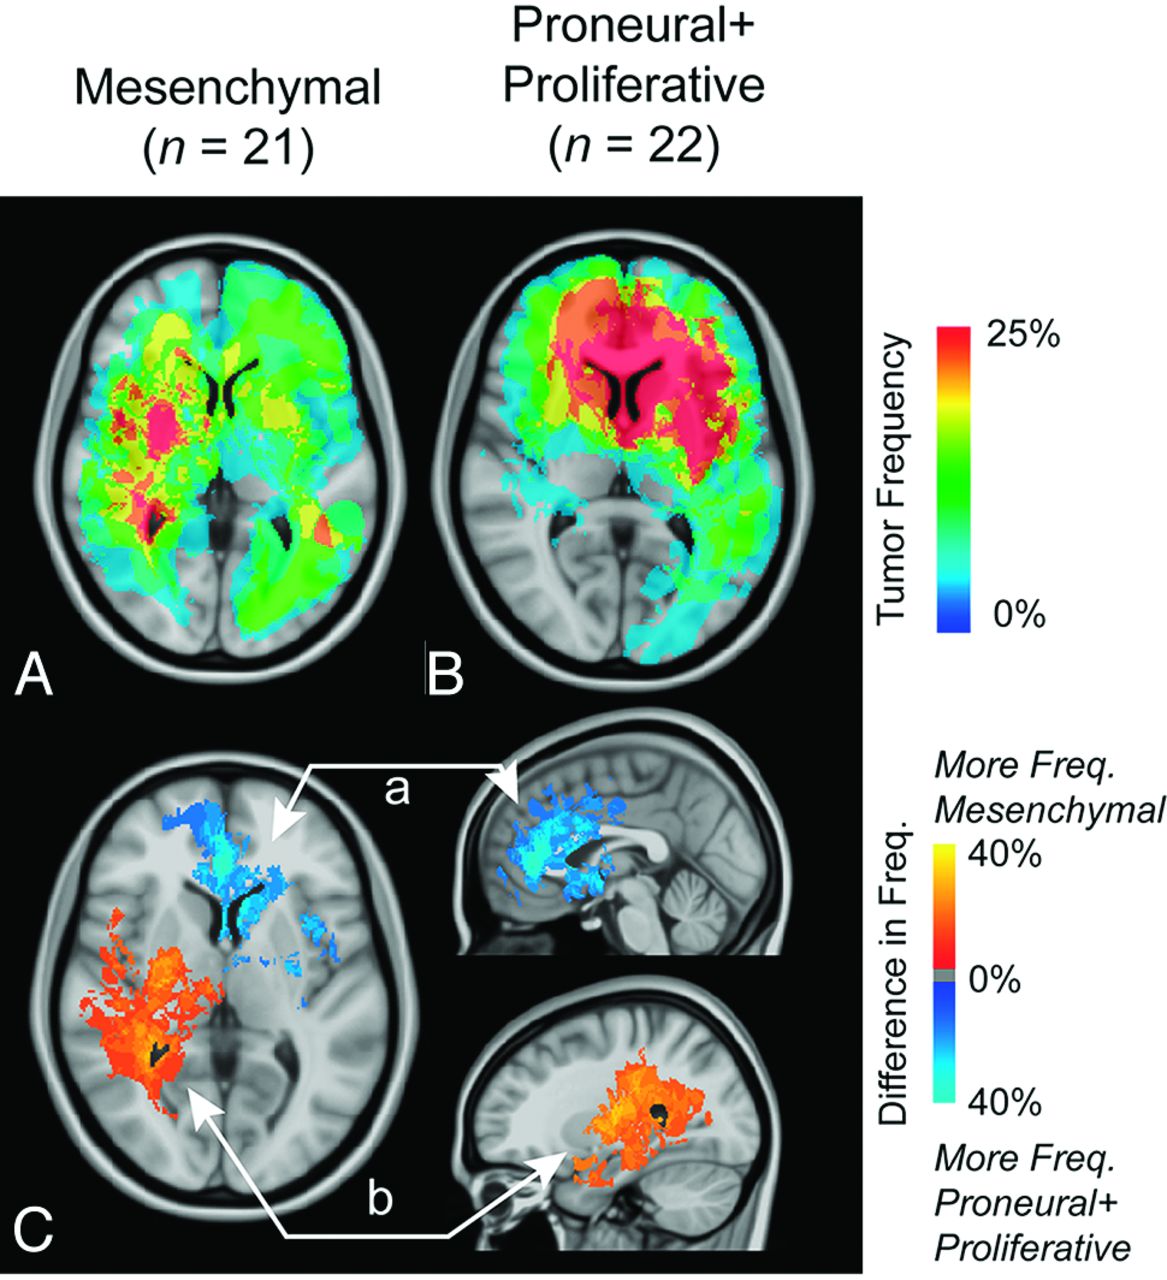
Atlas of gene expression subclassification. Frequency of T2/FLAIR tumor occurrence in mesenchymal (n = 21) (A) and combined proneural and proliferative (n = 22) (B) phenotypes showing a similar pattern to the IDH1 mutant phenotypes. C, ADIFFI statistical analysis isolates 2 spatially distinct clusters, cluster a in the frontal lobe corresponding to tumors that are more frequently proneural or proliferative and cluster b diffusely spread throughout the right hemisphere and surrounding the right posterior lateral ventricle. T2/FLAIR tumor frequency is illustrated.
Gene-Expression Subtypes
Topographic comparisons with respect to gene-expression subtypes revealed strong frontal lobe predominance in the proneural + proliferative genetic subtype (Fig 5B). The mesenchymal subgroup appeared to have the highest frequency of occurrence in diffuse regions throughout the right hemisphere (Fig 5A). ADIFFI statistical analysis confirmed independent localization of these 2 gene-expression phenotypes (a and b in Fig 5C).
PTEN Loss and PTEN Deficiency
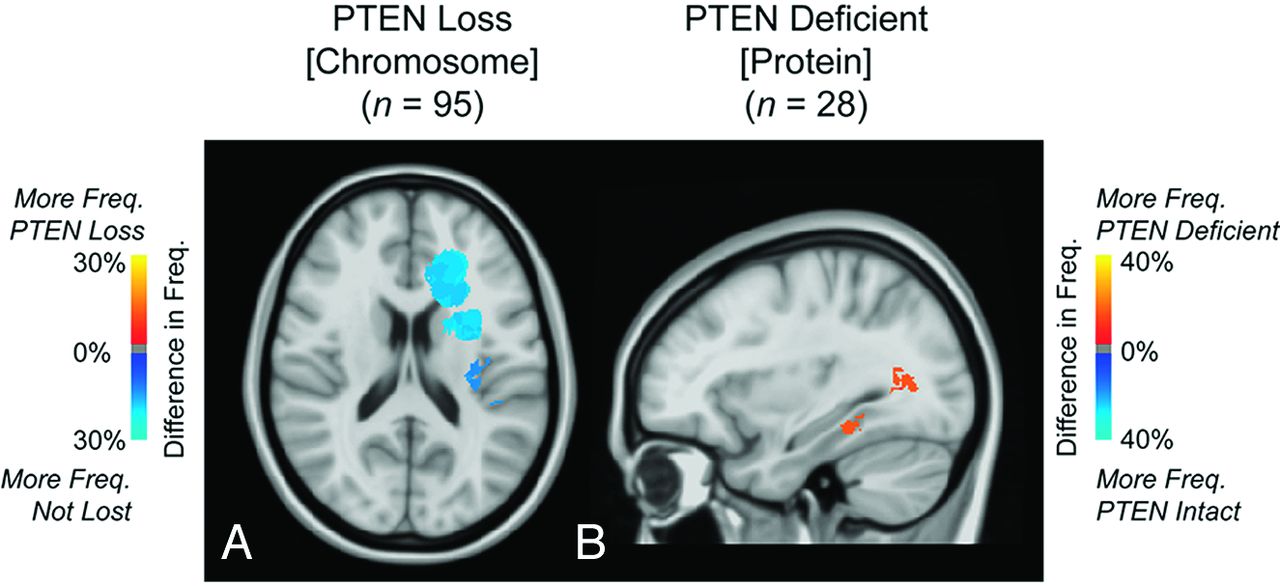
PTEN loss was apparent in 86% of the 95 patients with data available. ADIFFI analysis identified a cluster in the left frontal lobe associated with a significantly higher likelihood of lacking PTEN loss (Fig 6A). No differences in lesion volumes were found between tumors with PTEN loss and those without loss of PTEN (t test, P > .05). ADIFFI analysis of PTEN protein deficiency identified a single contiguous cluster having a significantly higher likelihood of being PTEN deficient running along the posterior aspect of the left lateral ventricle (Fig 6B). No differences in lesion volumes were found between PTEN-deficient and intact tumors (t test, P > .05).

Atlases of PTEN loss and PTEN deficiency. A, ADIFFI statistical analysis identified a cluster in the left frontal lobe associated with a high frequency of glioblastomas lacking PTEN loss (PTEN loss [n = 82] and lacking PTEN loss [n = 13]). B, Additionally, a cluster was isolated in periventricular white matter regions near the posterior aspect of the left lateral ventricle that may be associated with a high frequency of glioblastomas with PTEN protein deficiency (PTEN deficient [n = 12] and PTEN intact [n = 16]). T1+C tumor frequency is illustrated.
EGFR Amplification and EGFR variant 3 Expression
EGFR amplification information was available on 136 patients, of which 42% showed amplification. EGFR variant 3 expression was observed in 25% of the 48 patients with data available. ADIFFI analysis isolated 2 clusters both containing a significantly higher proportion of tumors exhibiting EGFR amplification (Fig 7A). ADIFFI analysis of EGFR variant 3 expression also identified 1 of the 2 clusters (a in Fig 7B). EGFR-amplified tumors had a significantly higher T1+C (t test, P = .049) and T2/FLAIR hyperintense volume (t test, P = .032) compared with tumors lacking EGFR amplification. No difference in tumor volumes was detected between EGFR variant 3-expressing tumors and tumors lacking EGFR variant 3 expression (t test, P > .05).

Atlases of EGFR amplification and EGFR variant 3 expression. A, ADIFFI analysis isolates 2 clusters associated with EGFR amplification (EGFR amplified [n = 79] and EGFR not amplified [n = 57]). B, One cluster a was also identified by examining EGFR variant 3 expression (EGFR variant 3 expressed [n = 12]; EGFR variant 3 not expressed [n = 36]). T1+C tumor frequency is illustrated.
Radiochemotherapy Interventional Phenotypes
Three hundred seventy-four patients with glioblastomas were initially treated with radiochemotherapy and showed progression at the time of censorship. ADIFFI analysis of tumor location between nonresponders (<6-month time to progression) and long-term responders (>12-month time to progression) identified 2 clusters (a and b in Fig 8C), both associated with a favorable response. No relationships between tumor volume and time to progression were identified (T1+C and T2/FLAIR, 1-way ANOVA; <6-month time to progression, 6- to 12-month time to progression, and >12-month time to progression; P > .05). When examining the interaction between MGMT promoter methylation and time to progression, ADIFFI statistical analysis identified 2 distinct clusters (a and b in Fig 8D) in a similar location in all glioblastomas; however, the lateral portion of cluster a and the anterolateral portion of cluster b were associated with long-term responders, whereas medial regions in cluster a and posterior regions in cluster b were regions associated with nonresponders.

Atlas of the radiochemotherapy interventional phenotype. Frequency of T1+C tumor occurrence for nonresponders (time to progression < 6 months, n = 124) (A) and long-term responders (time to progression > 12 months, n = 112) (B). C, ADIFFI results identify 2 distinct clusters, a and b, associated with a high frequency of tumor occurrence in long-term responders. D, Within MGMT promoter methylated tumors, which are known to have a survival advantage, ADIFFI analysis identifies the same 2 clusters, but they contain a mixture of responders and nonresponders. T1+C tumor frequency is illustrated.
Overall Survival
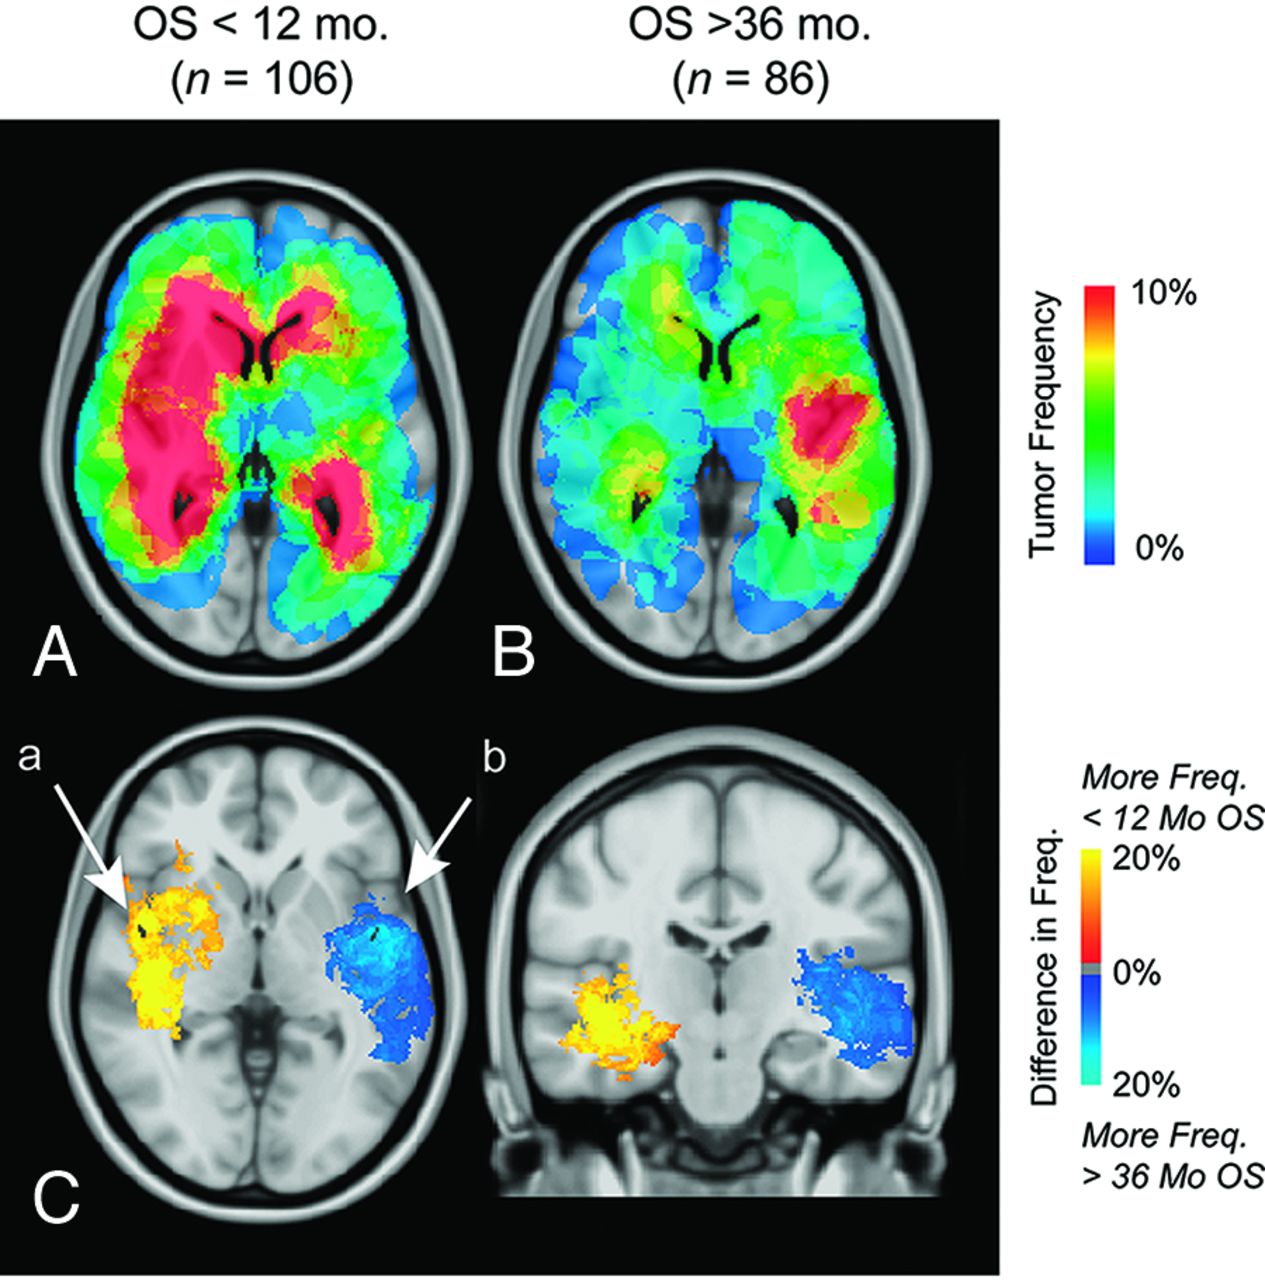
ADIFFI analysis identified 2 distinct clusters on separate hemispheres associated with either a short overall survival (<12-month overall survival; right hemisphere, a in Fig 9C) or a long overall survival (>36-month overall survival; left hemisphere, b in Fig 9C). Both T1+C and T2/FLAIR tumor volumes were not significantly different among different overall survivals (T1+C and T2/FLAIR, 1-way ANOVA; <12-month overall survival, 12–36-month overall survival, >36-month overall survival; P > .05).

Atlas of overall survival. Frequency of T1+C tumor occurrence for short-term (<12 months, n = 106) (A) and long-term survivors (>36 months, n = 86) (B). C, ADIFFI statistical analysis isolates 2 clusters in the temporal lobes, a and b, associated with a high frequency of tumor occurrence in short-term and long-term survivors, respectively.
Discussion
The current study demonstrates the utility of a comprehensive atlas of stereotactic tumor locations composed of >500 de novo glioblastomas and 10 different demographic, -omic, and interventional phenotypes. Restricted patterns in the topographic distribution of glioblastomas appear to arise from specific phenotypes, which appear consistent with the hypothesis of distinct glioma cells of origin. Our results appear to support the hypothesis that glioblastomas may arise from neural stem cells near the subventricular zone2,3 and may migrate along periventricular white matter tracts.
Atlas Stratifying the Extent of Resection Highlights Broca and Wernicke Areas
The extent of surgical resection is a significant prognostic factor in glioblastoma,20 which also reflects surgical practices of the attending neurosurgeons. At our institution, fMRI is performed to spare eloquent function and limit morbidity; therefore, we expected a high frequency of tumors in language functional areas to occur more often in subtotal resection. Consistent with this hypothesis, results from the current study clearly outlined a cluster of tissue connecting Broca and Wernicke areas as the primary region occurring most frequently in subtotal resection compared with gross total resection.
Atlas of MGMT Promoter Methylation Detects Temporal Lobe Asymmetry, Which May Be Dependent on Mutation of IDH1
A recent report containing a subset of patients from the current study demonstrated, in patients with glioblastoma, significant lateralization of MGMT promoter methylated tumors to the left temporal lobe and lateralization of MGMT unmethylated tumors to the right hemisphere.10 These findings were also consistent with those in the current study with more patients. Hemispheric asymmetry in brain structures is well documented,21,22 particularly in the temporal lobe.23 Hemispheric differences in gene expression have also been identified,24 including the suppressor of the fused homolog gene in the sonic hedgehog pathway that regulates brain tumor proliferation.25 Most interesting, localization of MGMT promoter methylated tumors was also present when examining the interaction between IDH1 mutation status and MGMT promoter methylation, suggesting that a significant number of IDH1 mutant tumors are localized to the frontal lobe only in MGMT promoter methylated tumors. The topographic link between IDH1 mutation and MGMT promoter methylation status supports findings that these 2 phenotypes are tightly correlated.26
Radiographic Atlases Identify a Subset of Tumors with Frontal Lobe Predominance
Results from the current study suggest that glioblastomas occurring in young patients and harboring IDH1 mutation, having proneural and/or proliferative gene expression and a lack of a loss of PTEN, are more likely to be localized to the frontal lobe. A recent study has suggested that IDH1 mutant gliomas arise from a distinct neural precursor population that may be spatially restricted to the frontal lobe and temporally restricted to younger patients.7 This report also established a link between the proneural gene expression subgroup and IDH1 mutant tumors as well as the mesenchymal subgroup and IDH1 wild-type tumors, which the current study suggests are diffuse and preferentially in the right hemisphere. Lower frequencies of PTEN loss were also detected in IHD1 mutant compared with wild-type tumors in both studies.
Radiographic Atlases Identify Regions Associated with Treatment Response and Survival
Results from the current study suggest that the periventricular white matter regions in the right hemisphere were associated with a short overall survival from the time of diagnosis. Similarly, this region was also shown to be contiguous with regions possessing the mesenchymal gene expression profile, lack of MGMT promoter methylation, and IDH1 wild-type classification, all of which are known to have a poor prognosis.7 In the radiochemotherapeutic interventional phenotype and when stratified by overall survival, tumors in the left temporal lobe had the best prognosis. When examining the response to radiochemotherapy in only the MGMT promoter methylated tumors, a similar region in the left temporal lobe was associated with a favorable response.
Bihemispheric clusters identified for EGFR amplification may explain contradicting results as to the prognostic relevance of EGFR amplification.27 When one considers both EGFR amplification and EGFR variant 3 expression, a common cluster occurs in the left temporal lobe anterior to the region identified by MGMT promoter methylation. As previously mentioned, this particular region was associated with a statistically longer progression-free survival and overall survival, supporting the findings from other investigators as to the negative prognostic value of EGFR amplification.28 Nevertheless, the relationship between tumor response to therapy, survival, and molecular phenotypes likely involves complex interactions that still need to be further delineated. We hypothesize that radiographic atlases illustrating the spatial correlations among these different phenotypes, as presented in the current study, may be important for deconvolving these interactions.
Limitations
There are a number of critical limitations to the current study. Because of the retrospective nature of the current study, we were unable to standardize the imaging data, which included heterogeneity with respect to field strength, type of gadolinium chelate used, imaging-section thickness, and the type of T2-weighted sequence (T2 FSE versus FLAIR). Second, image registration of anatomically distorted brains into standard stereotactic atlas space can be challenging. Despite our best effort to align images manually (when necessary) and verification of alignment by 2 independent observers, this lack of accuracy is a potential limitation.
Conclusions
Radiographic atlases identifying the location and frequency of glioblastoma tumor occurrence for specific demographic, -omic, and interventional phenotypes can provide new insight into potential overlap between prognostic variables and may help identify niche locations for glioma cells of origin. Results from the current study suggest that tumor laterality (left versus right hemisphere) and frontal lobe involvement may play a role in the particular molecular and genetic profile of tumors and their response to cytotoxic treatment and overall survival. Future studies aimed at determining the possible biologic mechanisms for these findings are warranted.
Acknowledgments
We thank Taryar Zaw, Kourosh Naeini, Nathan Stumpf, Yalda Behbahanian, and Sandy Mong for their tireless effort in segmenting tumor volumes and Heidi Phillips, MD, at Genentech, for her valuable guidance.
Footnotes
Disclosures: Albert Lai—RELATED: Consultancy: Genentech. William H. Yong—RELATED: Grant: National Institutes of Health, Ivy Foundation, UNRELATED: Grants/Grants Pending: National Institutes of Health (possibly),* Other: Amgen,* Genentech,* Tocagen,* Comments: collaborative research. Whitney B. Pope—UNRELATED: Consultancy: Genentech, Roche. Harry V. Vinters—RELATED: Grant: National Institutes of Health,* Rasmussen's Encephalitis Children's Project,* National Institute of Neurological Disorders and Stroke,* California Pediatric Neuropathology Consortium,* Comments: I supervise the Neuropathology and “Blood and Tissue” Cores for several National Institutes of Health-funded projects, UNRELATED: Stock/Stock Options: significant holdings in 3M, Teva Pharma, GE, Pfizer, Glaxo SmithKline Beecham, but none relevant to this work except that I suppose some imaging was done on GE machines.* Linda M. Liau—UNRELATED: Grants/Grants Pending: Northwest Biotherapeutics.* Paul S. Mischel—UNRELATED: Board Membership: James McDonnell Brain Cancer Advisory Board, Comments: They pay me $5000 to review grants. I am also on multiple journal editorial boards and external advisory boards, without payment. They do pay my travel to external advisory board meetings, Payment for Lectures (including service on Speakers Bureaus): I have given multiple lectures at various university department symposia around the United States and at Keystone meetings. I sometimes receive honoraria, usually $500–$1000. Timothy F. Cloughesy—UNRELATED: Consultancy: Roche, Genentech, Novartis, Merck Serono, Merck, Payment for Lectures (including service on Speakers Bureaus): Merck. * Money paid to the institution.
This work was supported by the University of California Cancer Research Coordinating Committee Grant (B.M.E.); a UCLA Radiology Exploratory Research Grant (B.M.E.); a UCLA Institute for Molecular Medicine Seed Grant (B.M.E.); the Art of the Brain (T.F.C.); the Ziering Family Foundation in memory of Sigi Ziering (T.F.C.); the Singleton Family Foundation (T.F.C.); and the Clarence Klein Fund for Neuro-Oncology (T.F.C.).
References
- Received May 20, 2012.
- Accepted after revision May 26, 2012.
- © 2013 by American Journal of Neuroradiology
In this issue


Jump to section
Related Articles
Cited By...
- IDH-mutant gliomas arise from glial progenitor cells harboring the initial driver mutation
- Unravelling the Impact of Tumor Location on Patient Survival in Glioblastoma: A Genomics and Radiomics Approach
- Overview of prognostic factors in adult glioma; a 10-year experience at a single institution
- A birds eye view to the homeostatic, Alzheimer and Glioblastoma attractors
- Sex-specific impact of patterns of imageable tumor growth on survival of primary glioblastoma patients
- Deep-Learning Convolutional Neural Networks Accurately Classify Genetic Mutations in Gliomas
- Computational Identification of Tumor Anatomic Location Associated with Survival in 2 Large Cohorts of Human Primary Glioblastomas
- Fluoroscopy Operators Brains and Radiation
- Quantification of Nonenhancing Tumor Burden in Gliomas Using Effective T2 Maps Derived from Dual-Echo Turbo Spin-Echo MRI
- Magnetic resonance image features identify glioblastoma phenotypic subtypes with distinct molecular pathway activities
- Mapping p53 Mutations in Low-Grade Glioma: A Voxel-Based Neuroimaging Analysis